Social Dominance Orientation [2018]
A Politico-Psychological Analysis
1 Study Characteristics
1.2 Sample
N=TBD
Sample description for the 2018 PPBS CINT Post-election study to be added.
2 Descriptives
2.1 Means, SD, Range, & SE
| mean | sd | median | max | range | |
|---|---|---|---|---|---|
| Dominance_mean | 3.51 | 1.54 | 3.75 | 8.25 | 7.25 |
| Antiegalitarianism_mean | 3.78 | 1.68 | 4.00 | 9.00 | 8.00 |
| SDO | 3.65 | 1.46 | 3.88 | 8.25 | 7.25 |
| Note: | |||||
| n = 2759, min = 1, se = 0.03 |
| mean | sd | median | se | |
|---|---|---|---|---|
| Dominance1 | 4.06 | 2.49 | 5.00 | 0.05 |
| Dominance2 | 3.63 | 2.18 | 4.00 | 0.04 |
| Dominance3 | 4.00 | 2.24 | 5.00 | 0.04 |
| Dominance4 | 3.43 | 2.31 | 3.00 | 0.04 |
| Dominance5 | 3.25 | 2.07 | 3.00 | 0.04 |
| Dominance6 | 2.93 | 2.03 | 2.00 | 0.04 |
| Dominance7 | 3.29 | 2.21 | 3.00 | 0.04 |
| Dominance8 | 3.54 | 2.09 | 4.00 | 0.04 |
| Antiegalitarianism1 | 3.95 | 2.38 | 4.00 | 0.05 |
| Antiegalitarianism2 | 4.52 | 2.60 | 5.00 | 0.05 |
| Antiegalitarianism3 | 4.07 | 2.41 | 5.00 | 0.05 |
| Antiegalitarianism4 | 4.69 | 2.49 | 5.00 | 0.05 |
| Antiegalitarianism5 | 2.84 | 1.88 | 2.00 | 0.04 |
| Antiegalitarianism6 | 3.49 | 2.06 | 3.00 | 0.04 |
| Antiegalitarianism7 | 3.07 | 1.96 | 3.00 | 0.04 |
| Antiegalitarianism8 | 3.59 | 2.20 | 4.00 | 0.04 |
| SDO | 3.65 | 1.46 | 3.88 | 0.03 |
| Dominance_mean | 3.51 | 1.54 | 3.75 | 0.03 |
| Antiegalitarianism_mean | 3.78 | 1.68 | 4.00 | 0.03 |
| Note: | ||||
| All items: n = 2759, min = 1, max = 9. SDO: min = 1, max = 8.25. Dominance_mean: min = 1, max = 8.25. Antiegalitarianism_mean: min = 1, max = 9 |
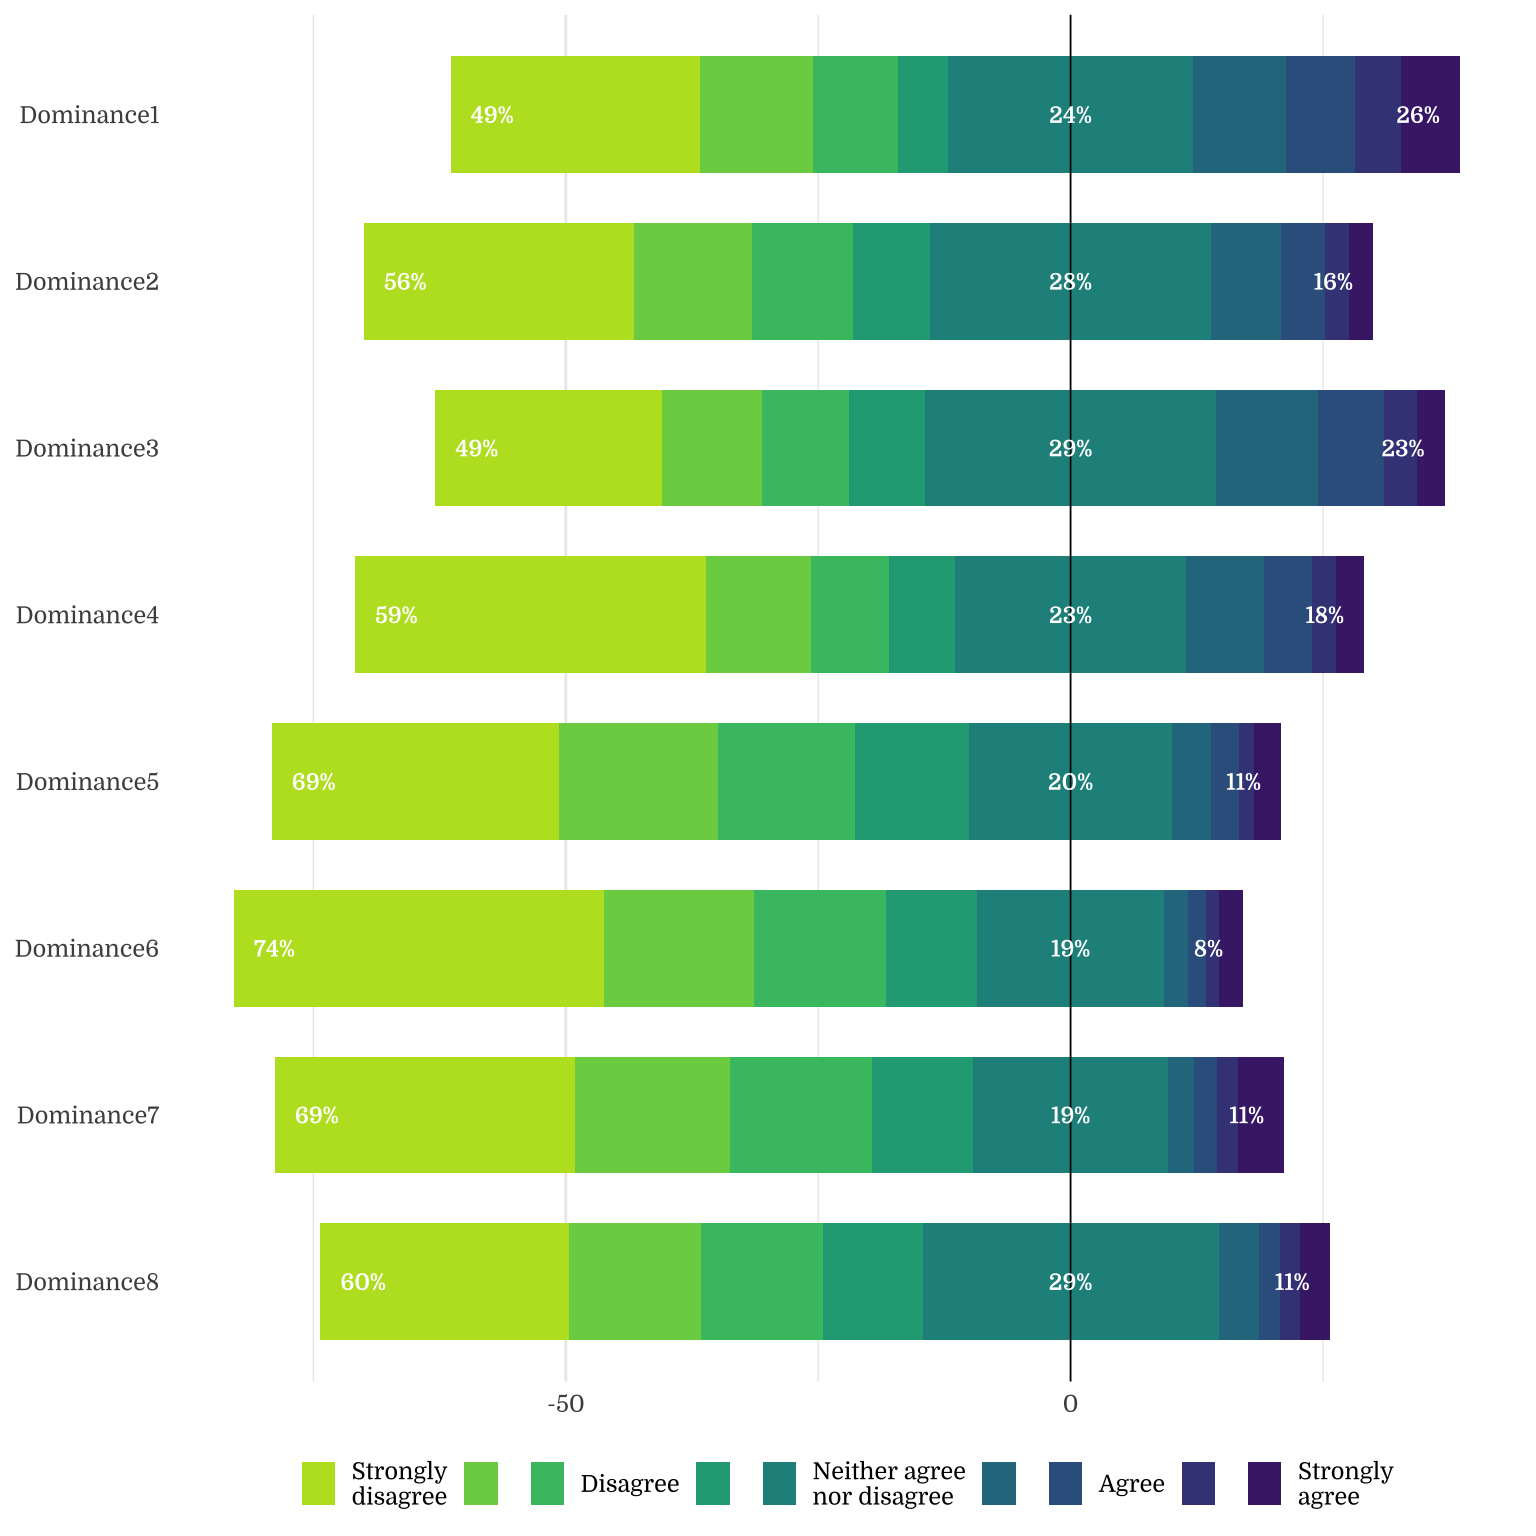
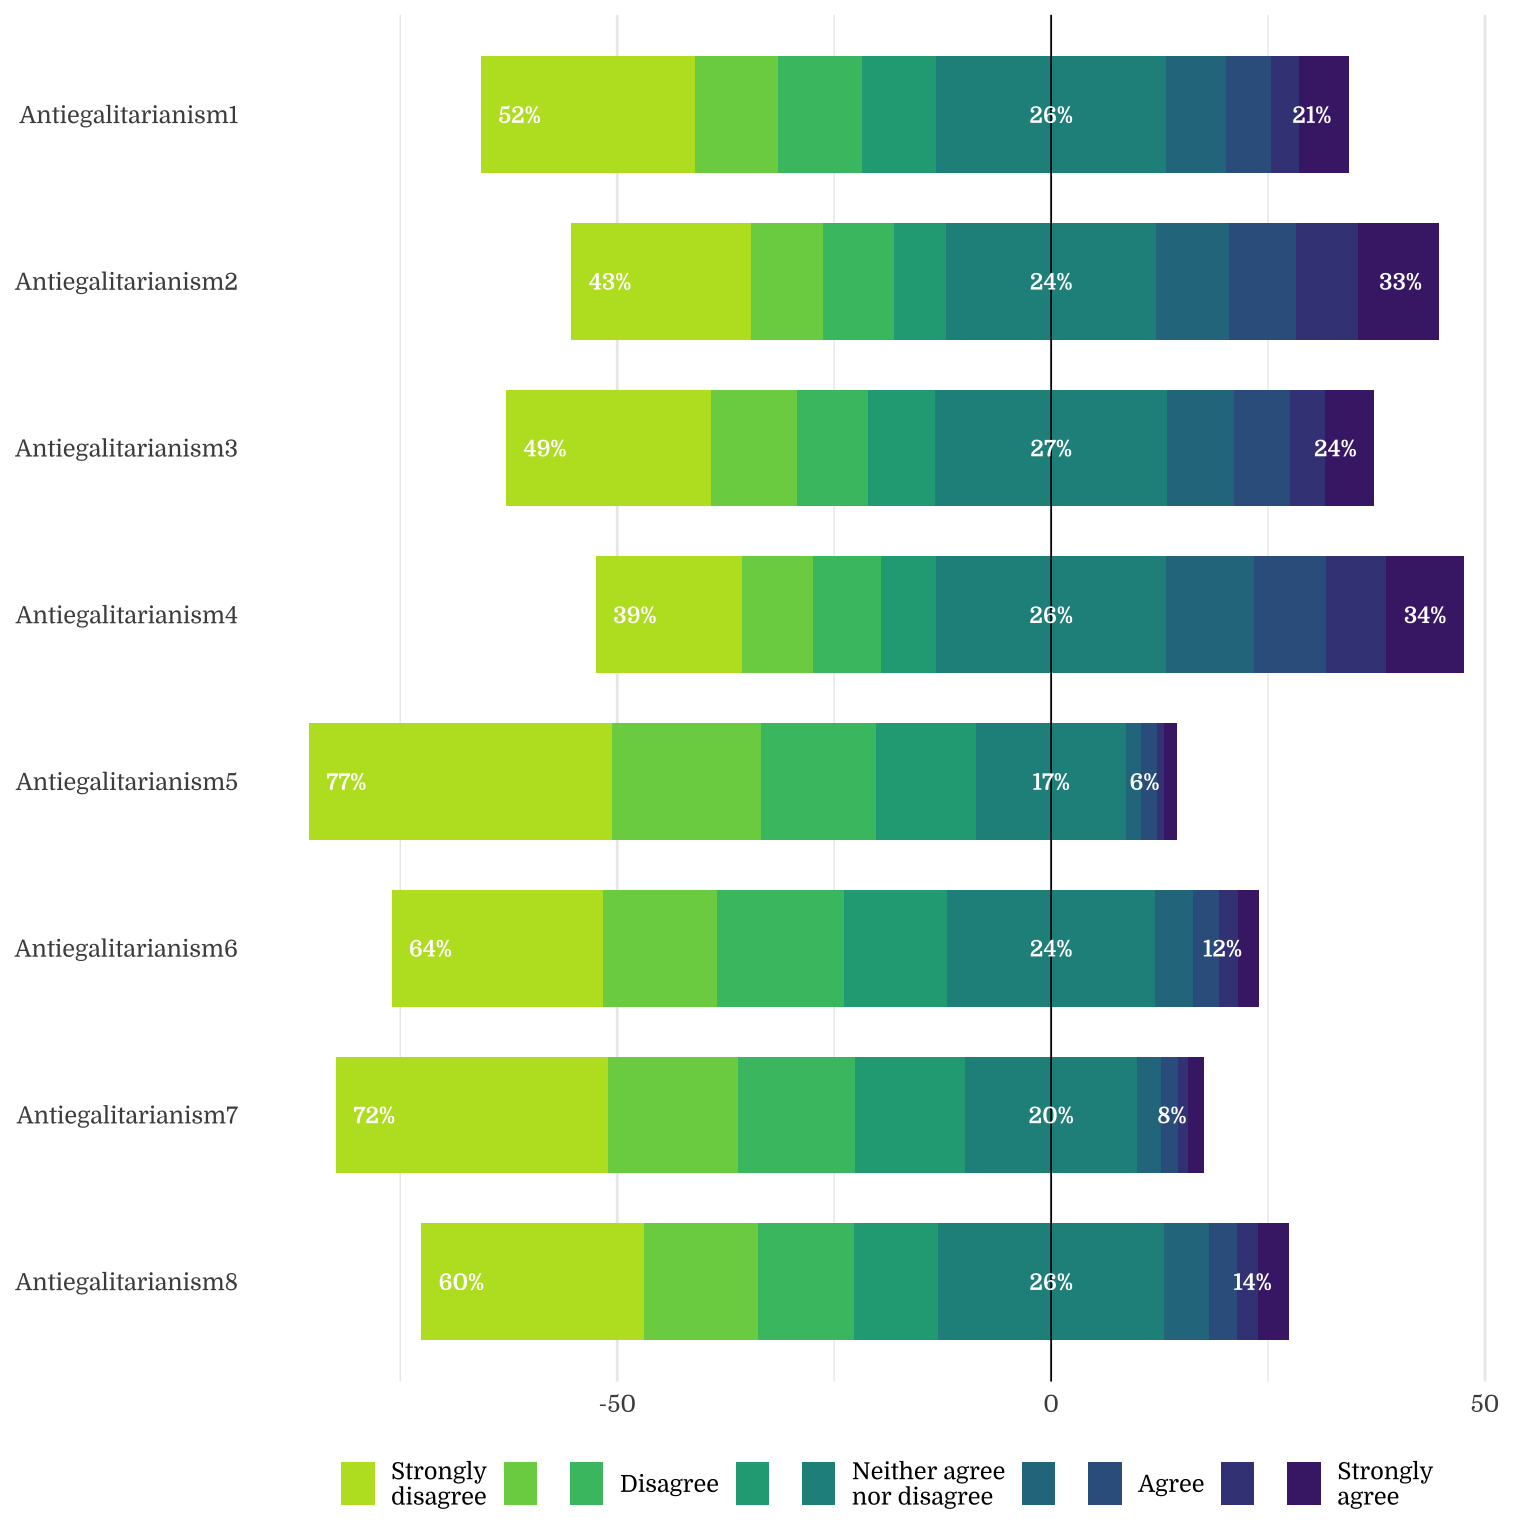
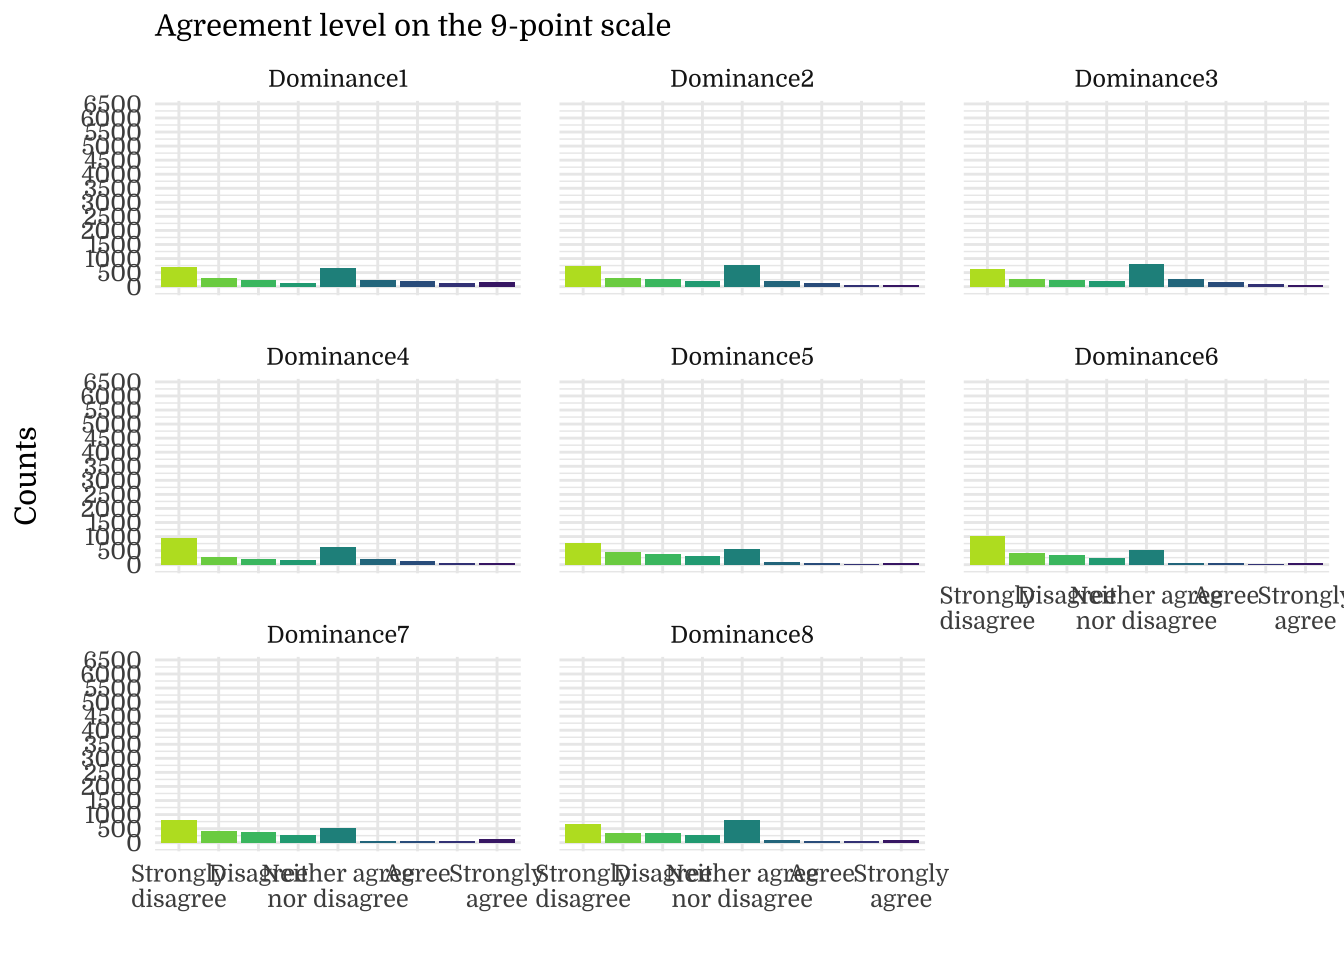
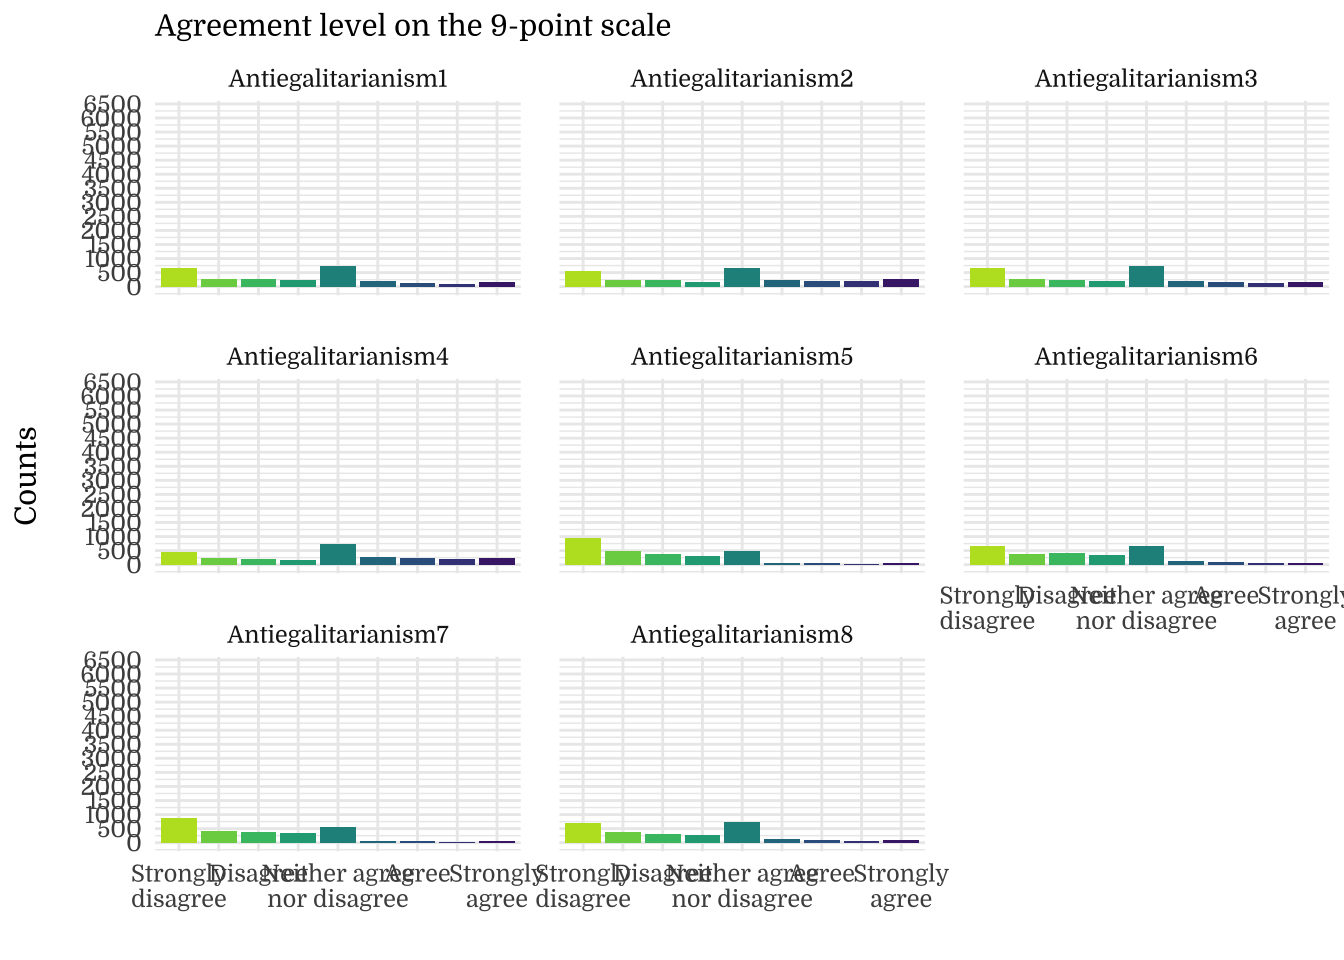
2.2 Response Distribution
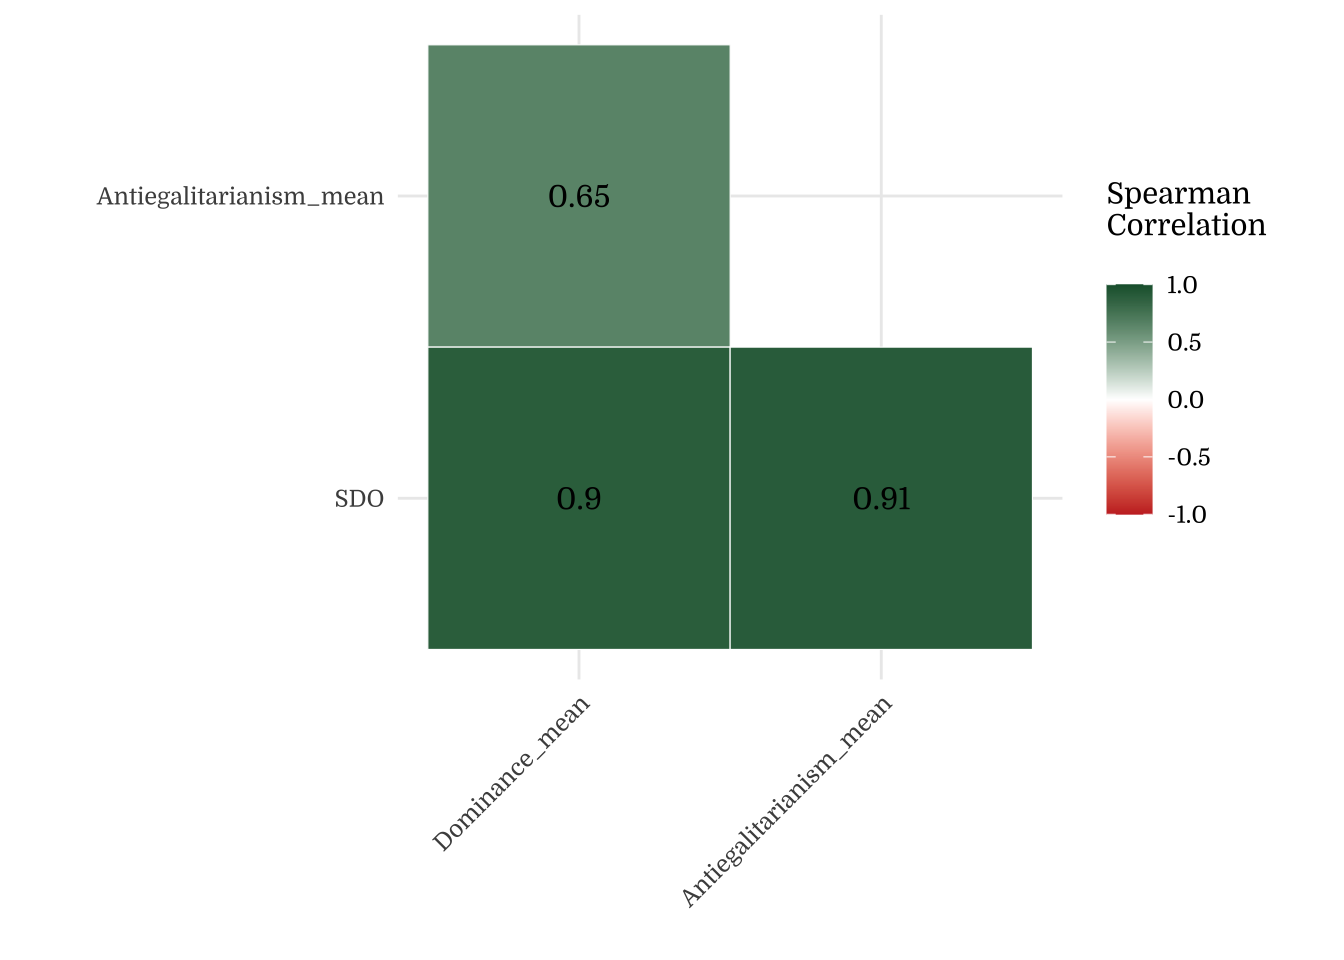
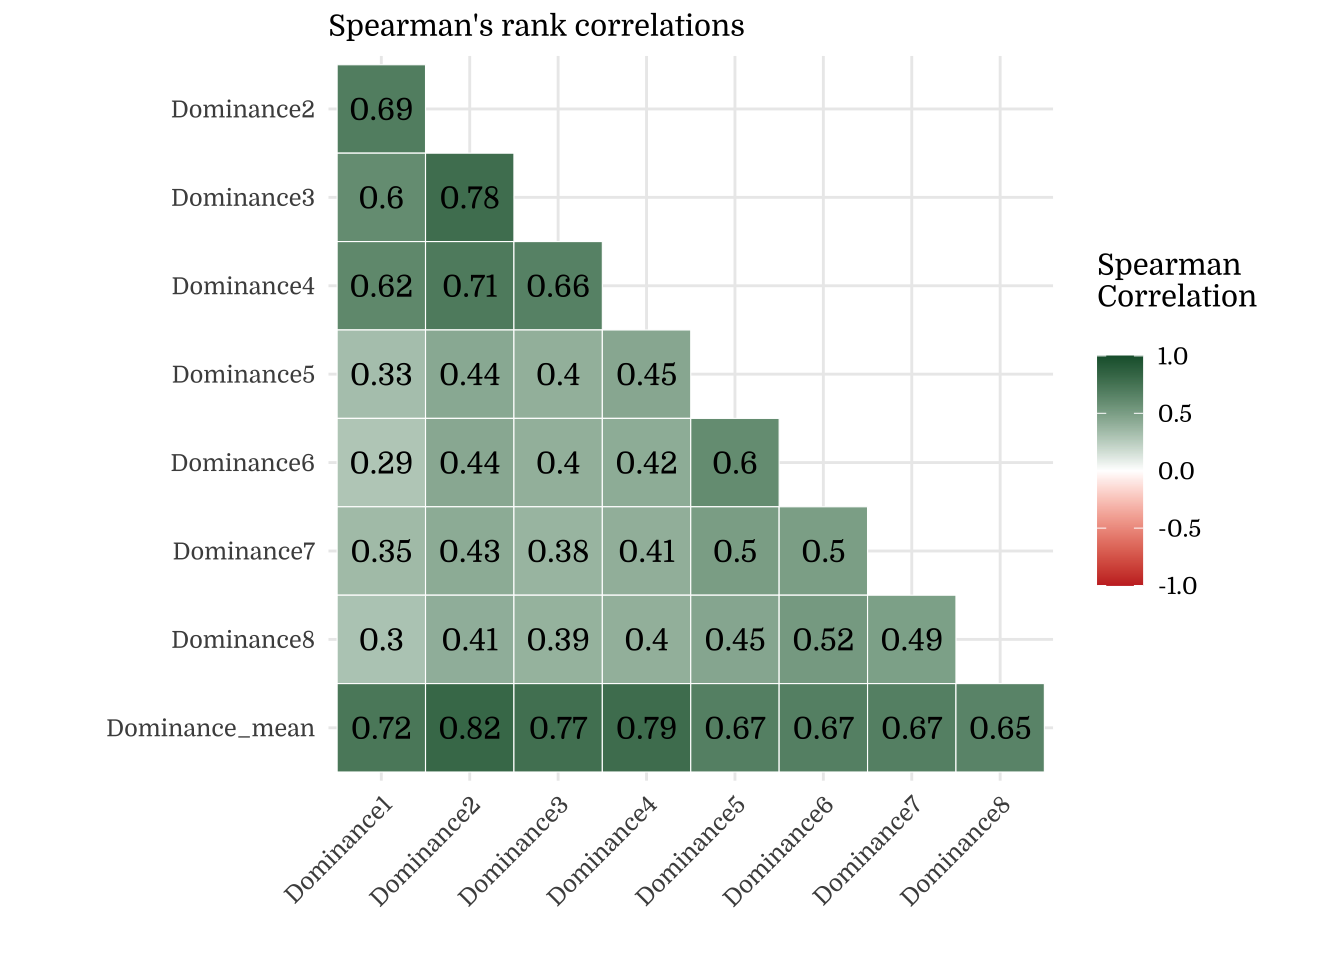
2.3 Correlations
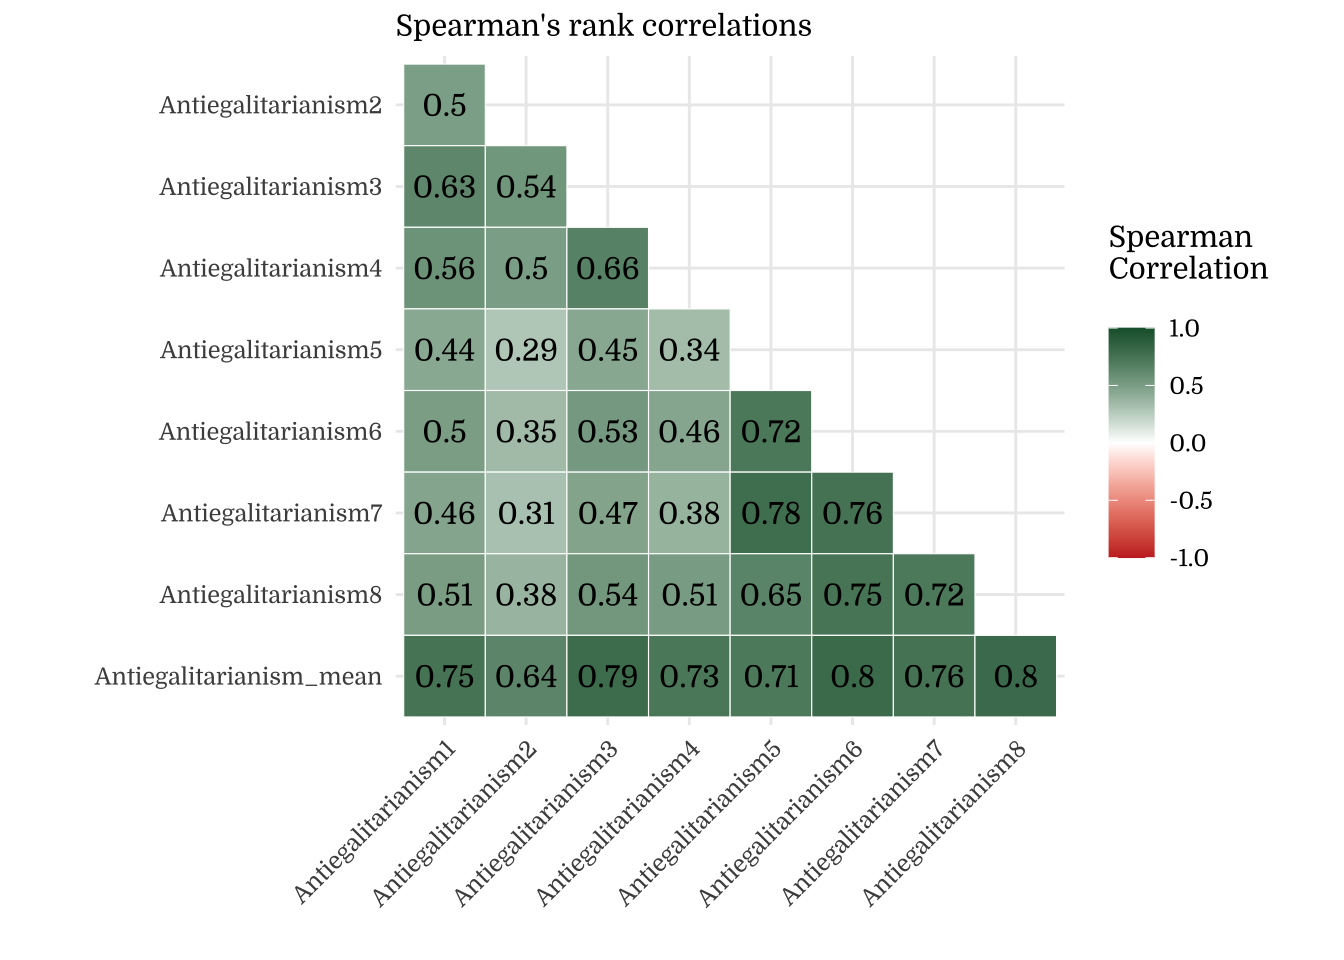
2.3.1 Correlation Plots
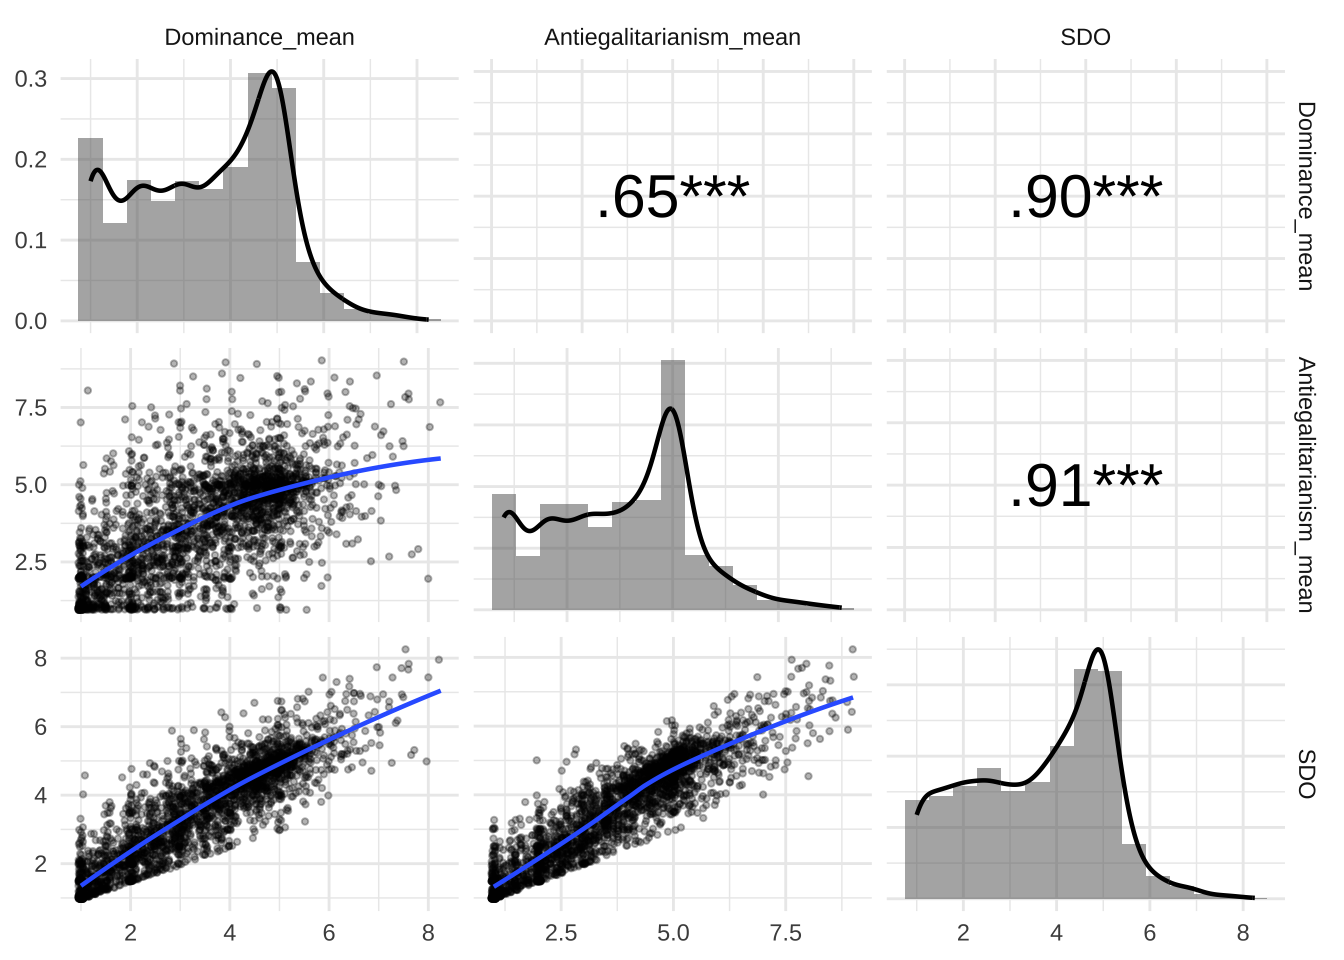
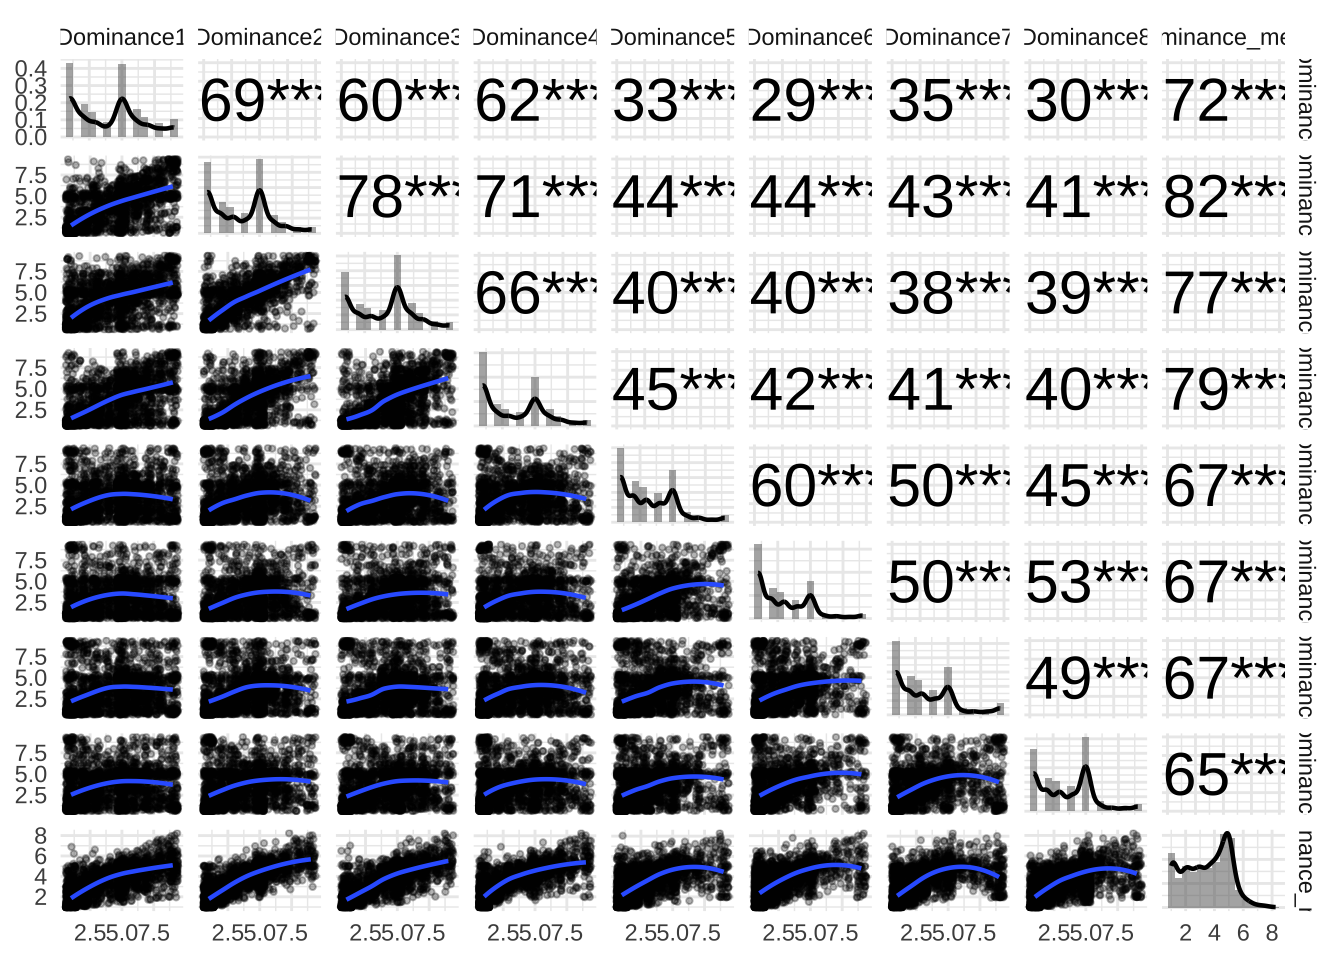
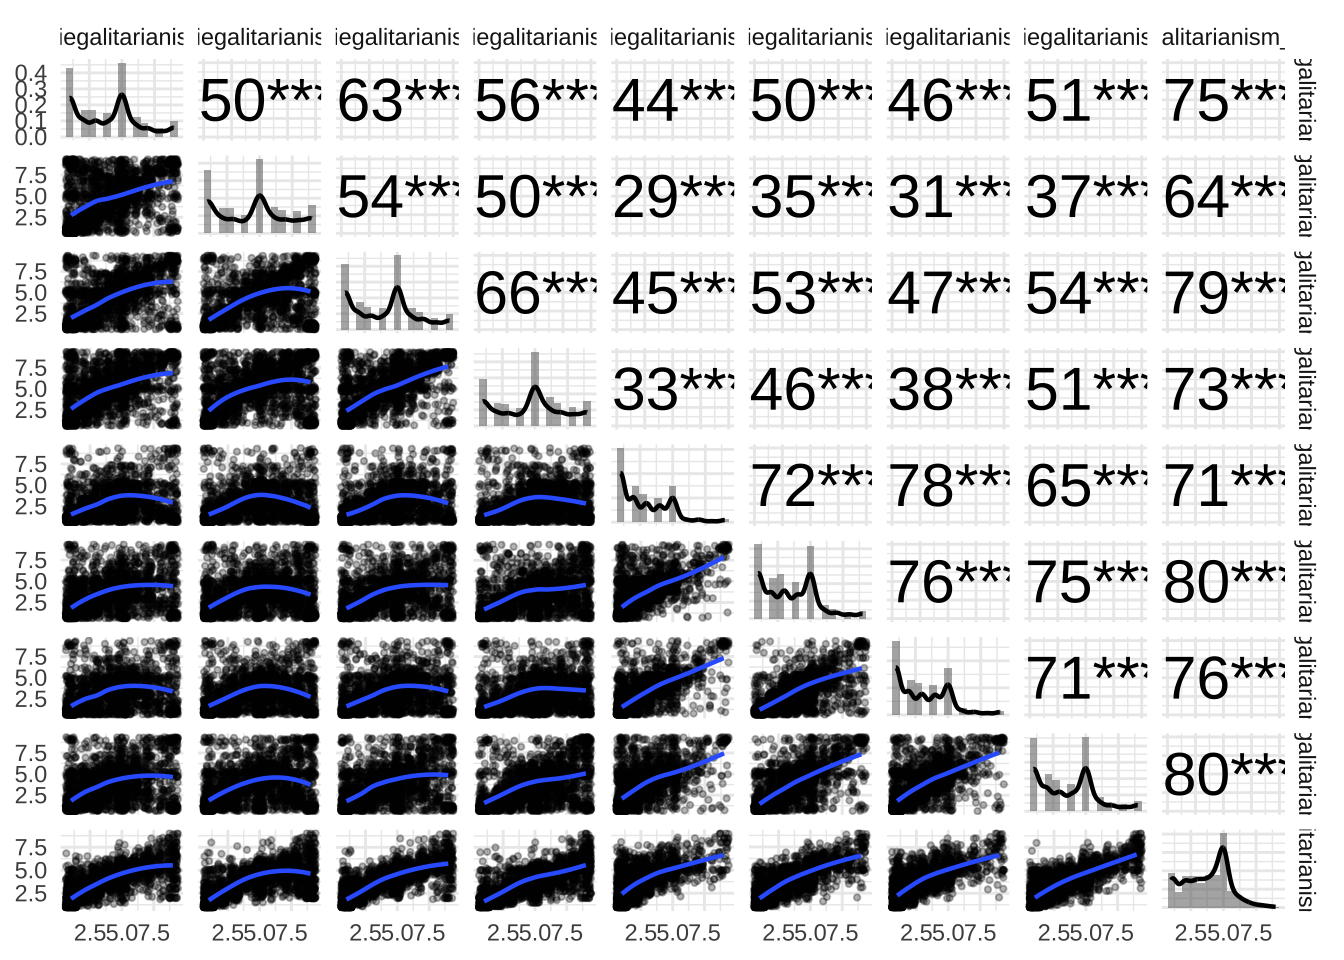
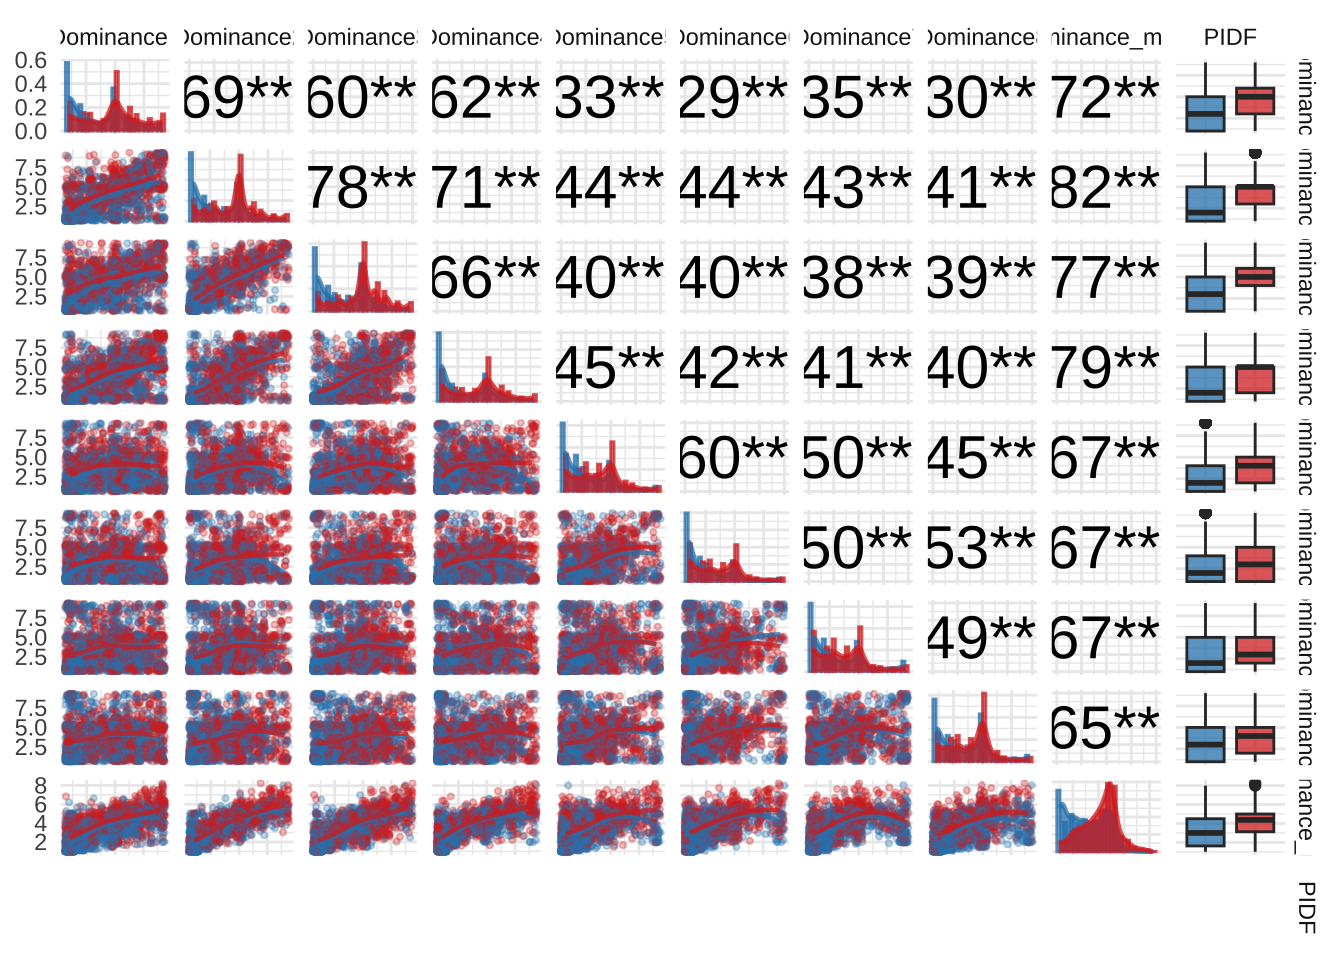
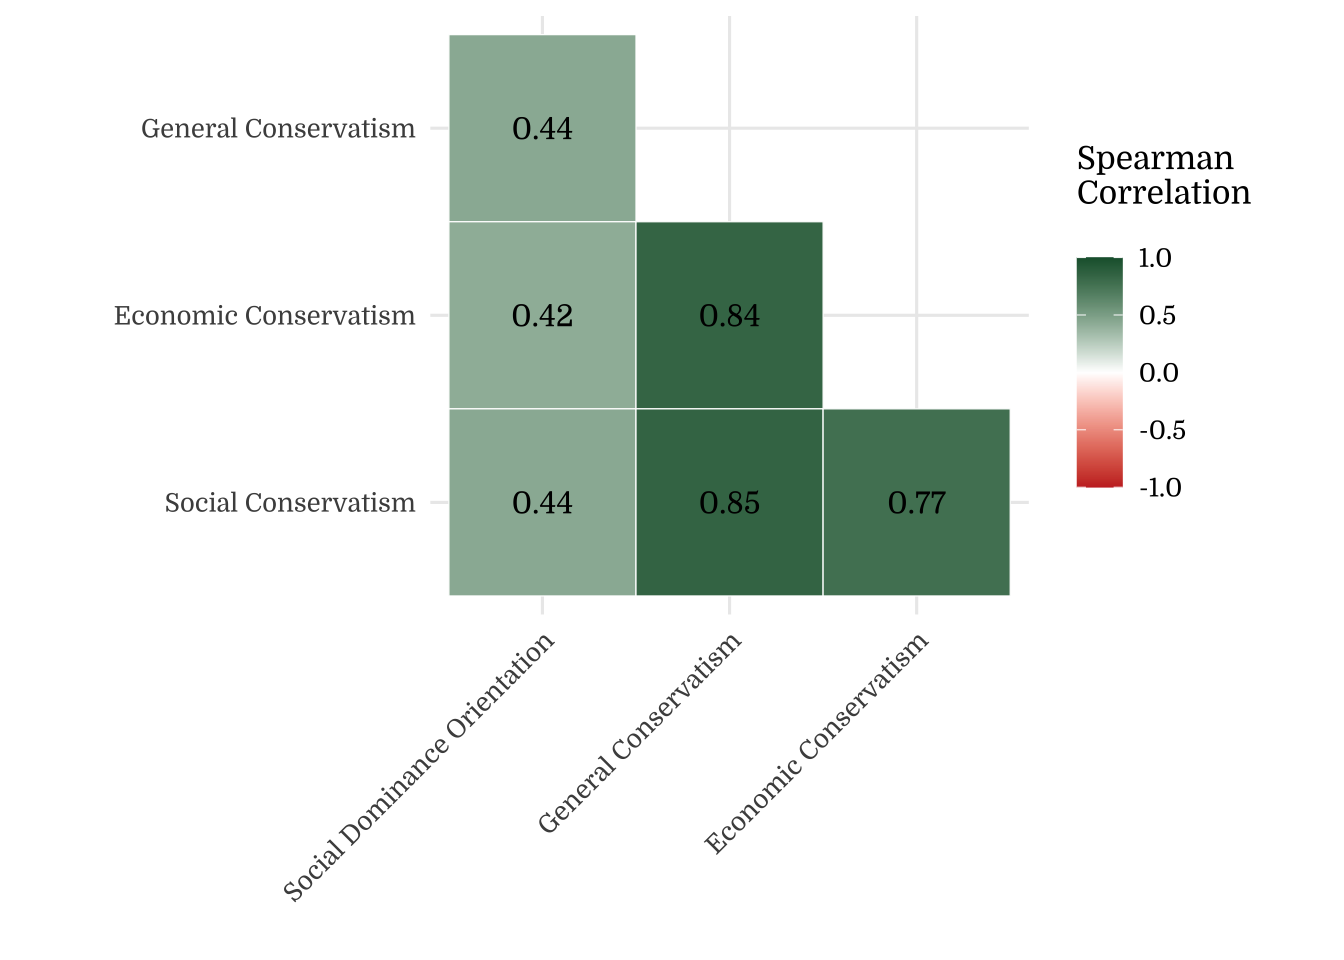
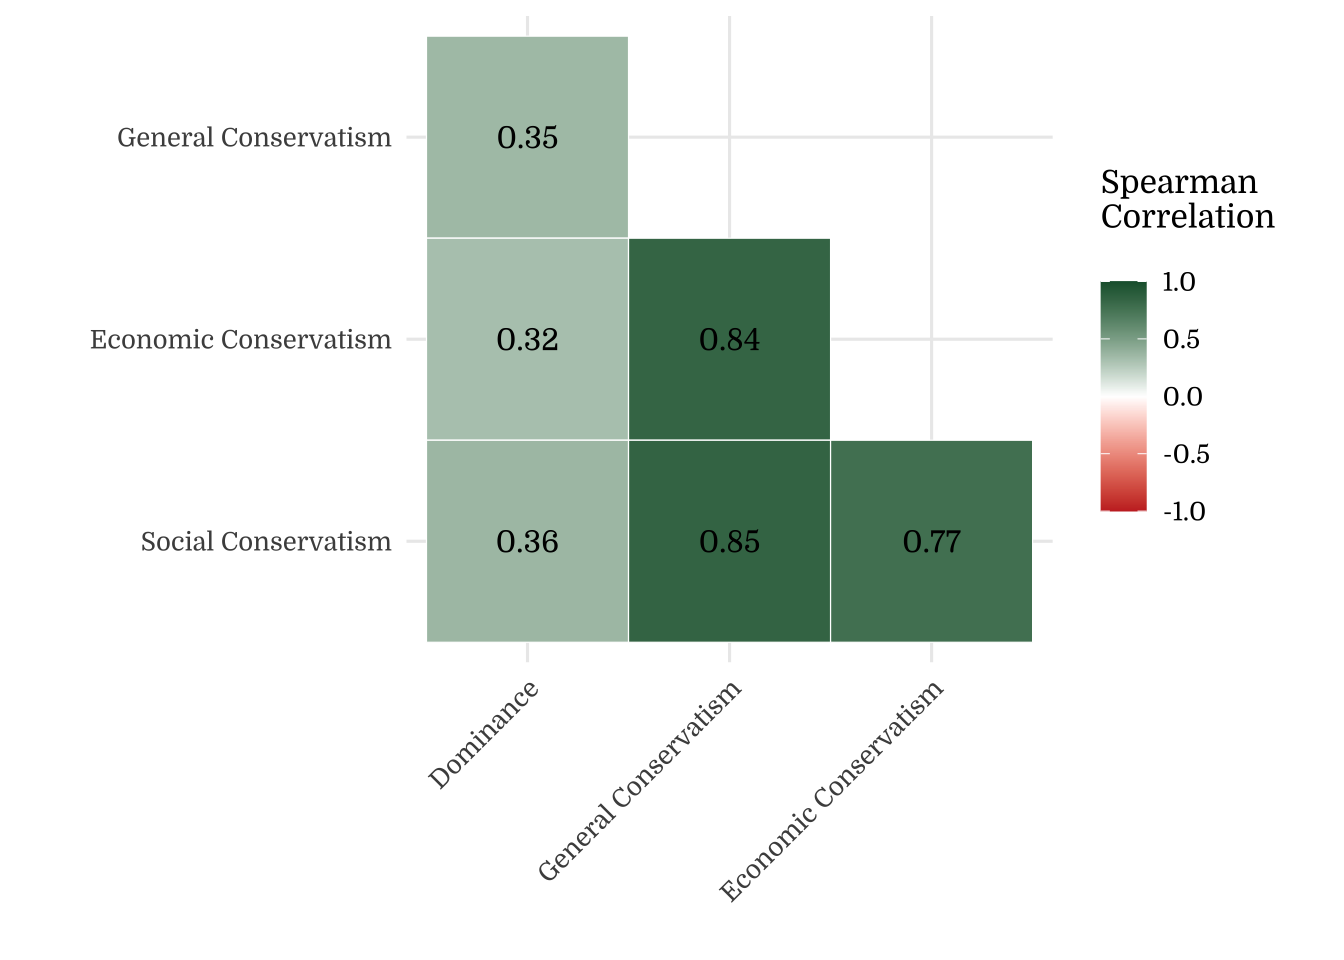
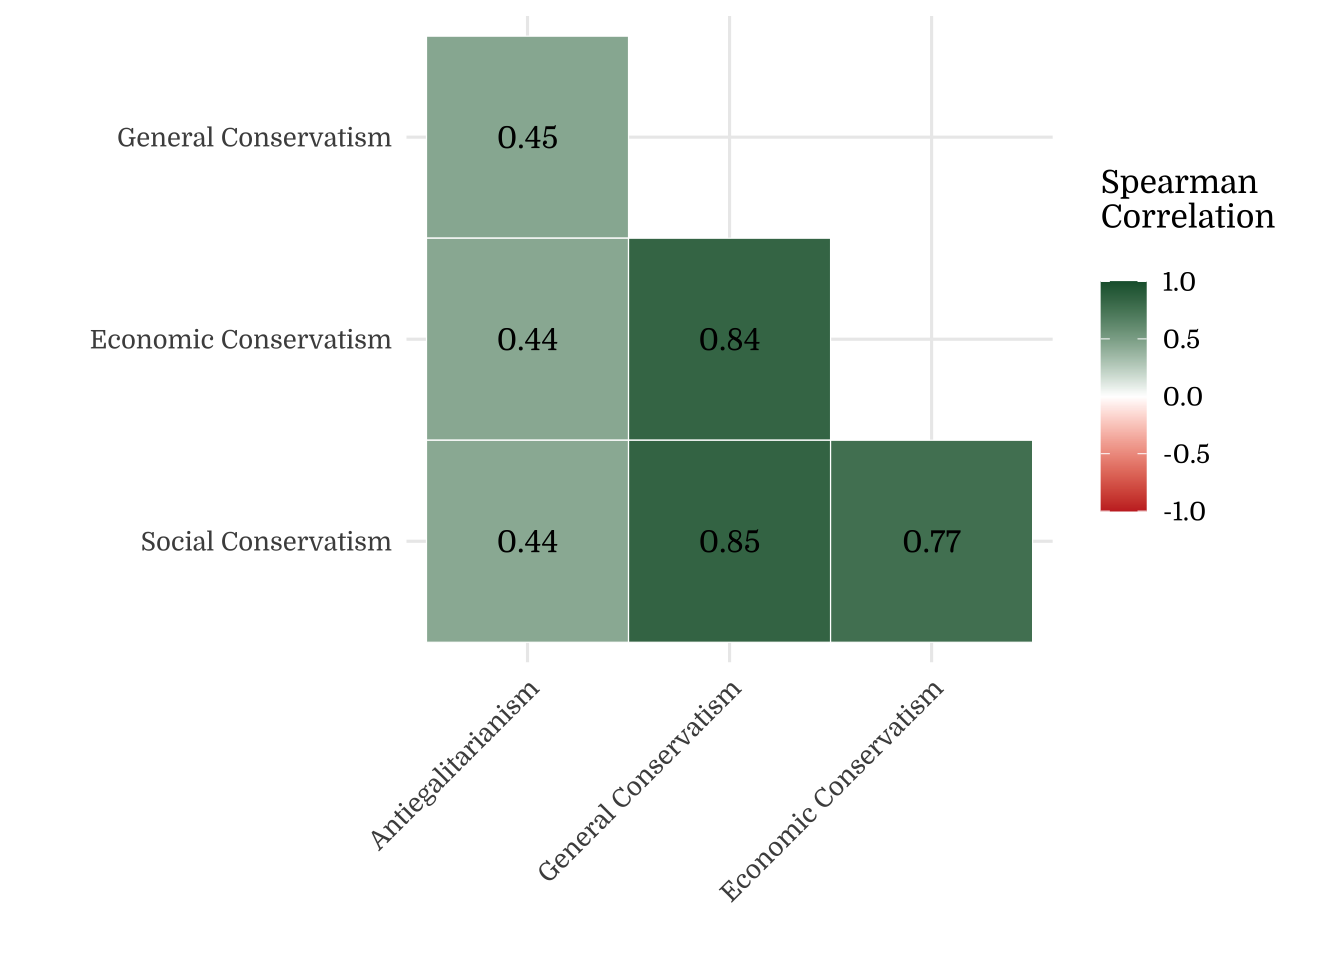
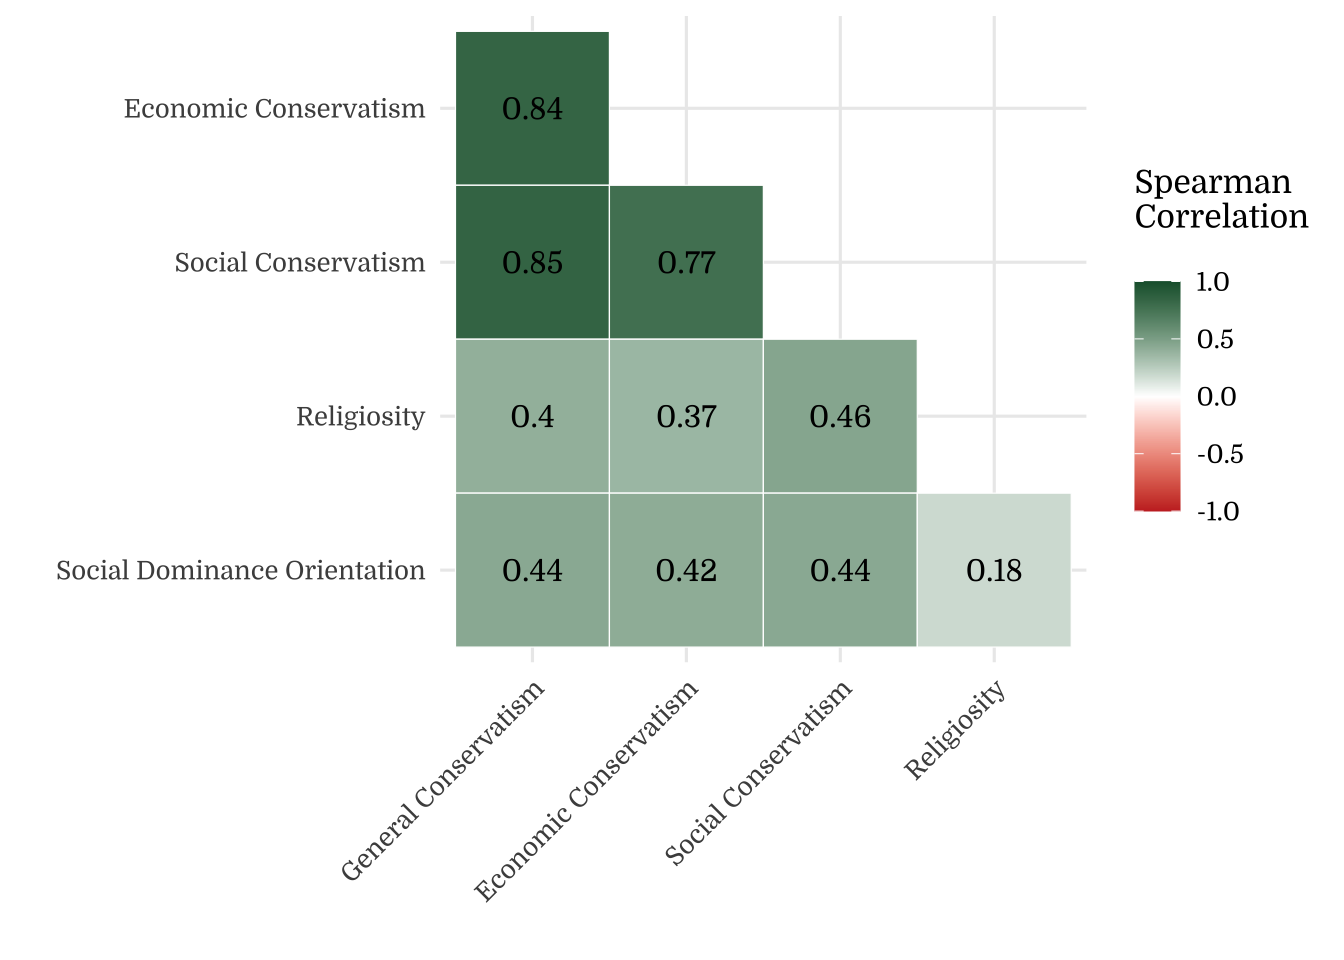
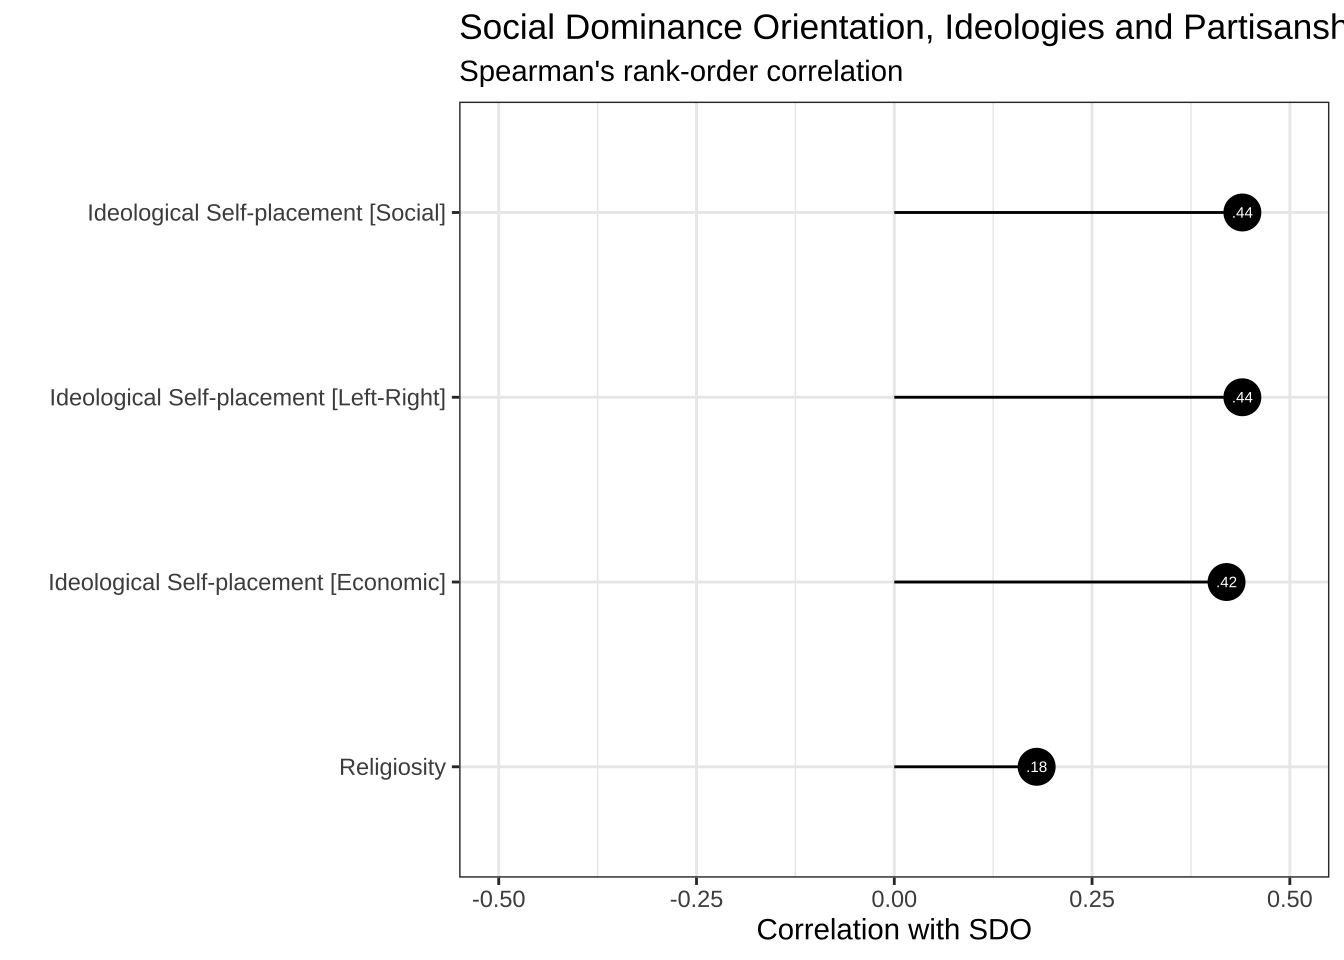
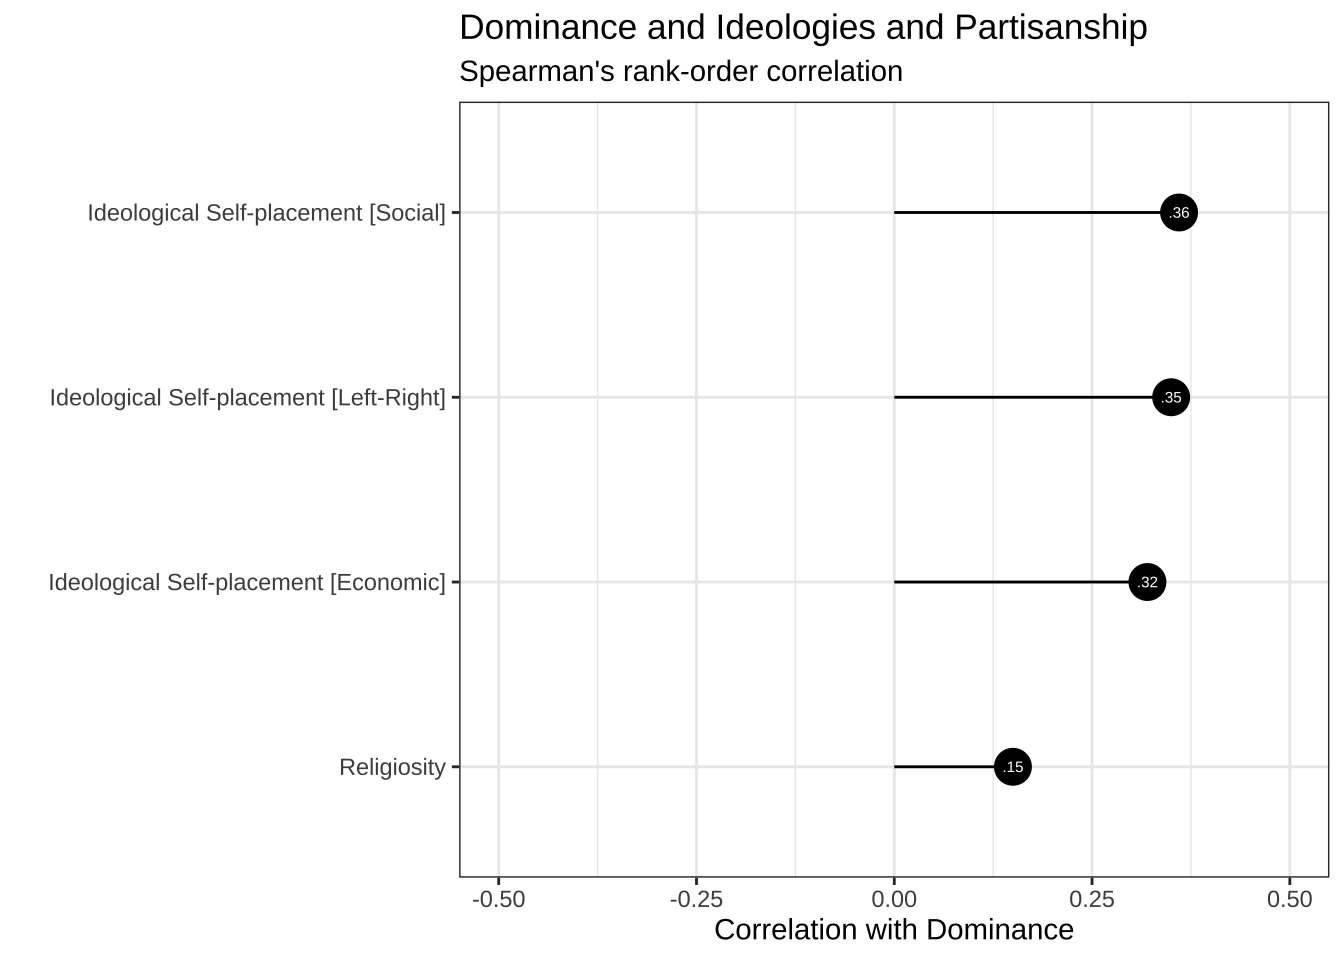
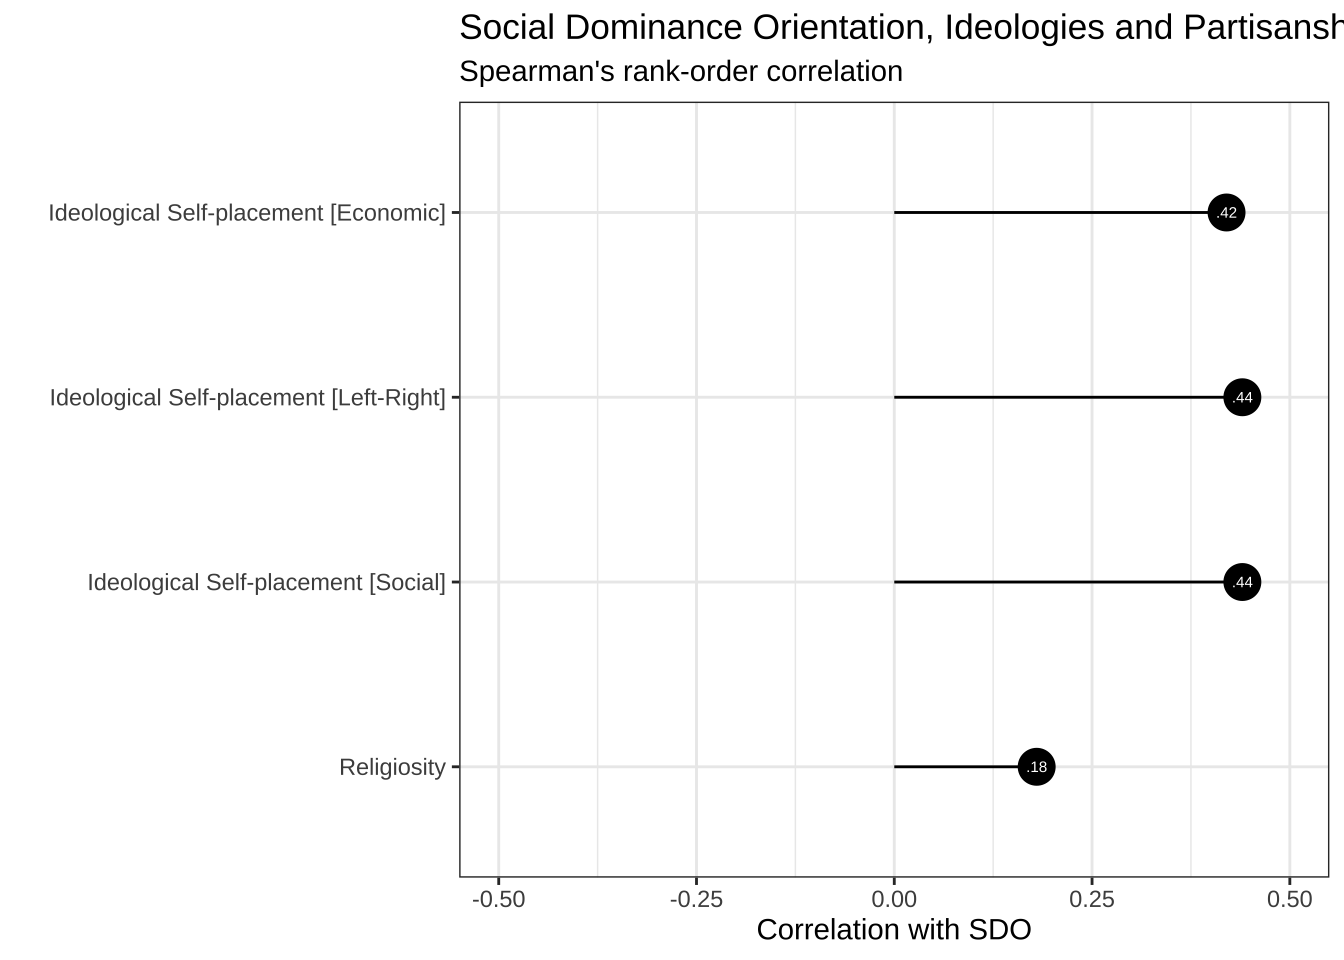
Note. Upper triangle shows Spearman’s rank-order correlations. *** p < .001, ** p < .01, * p < .05.
2.3.2 PIDF
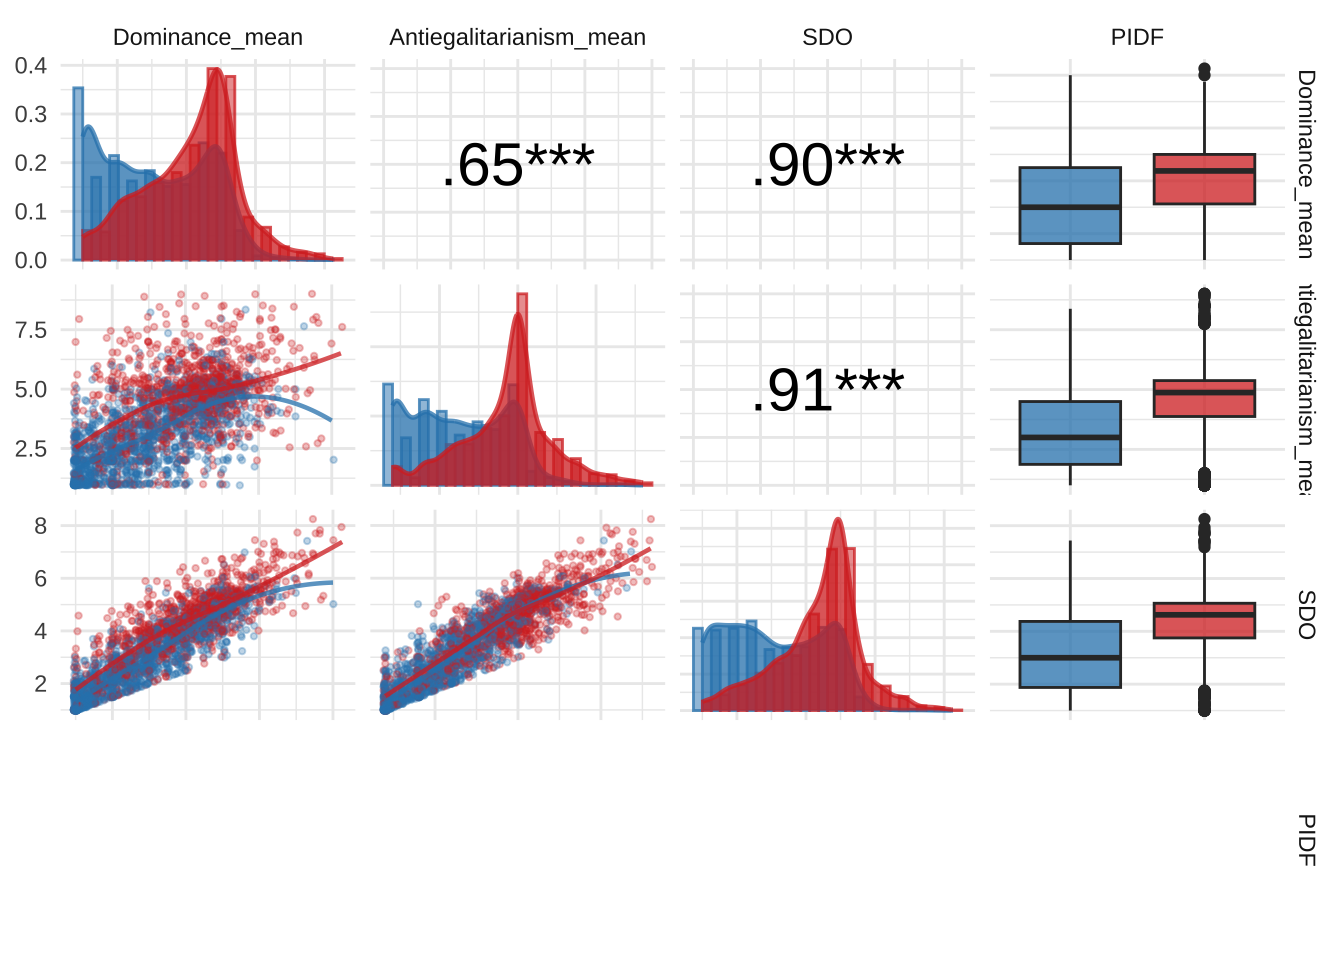
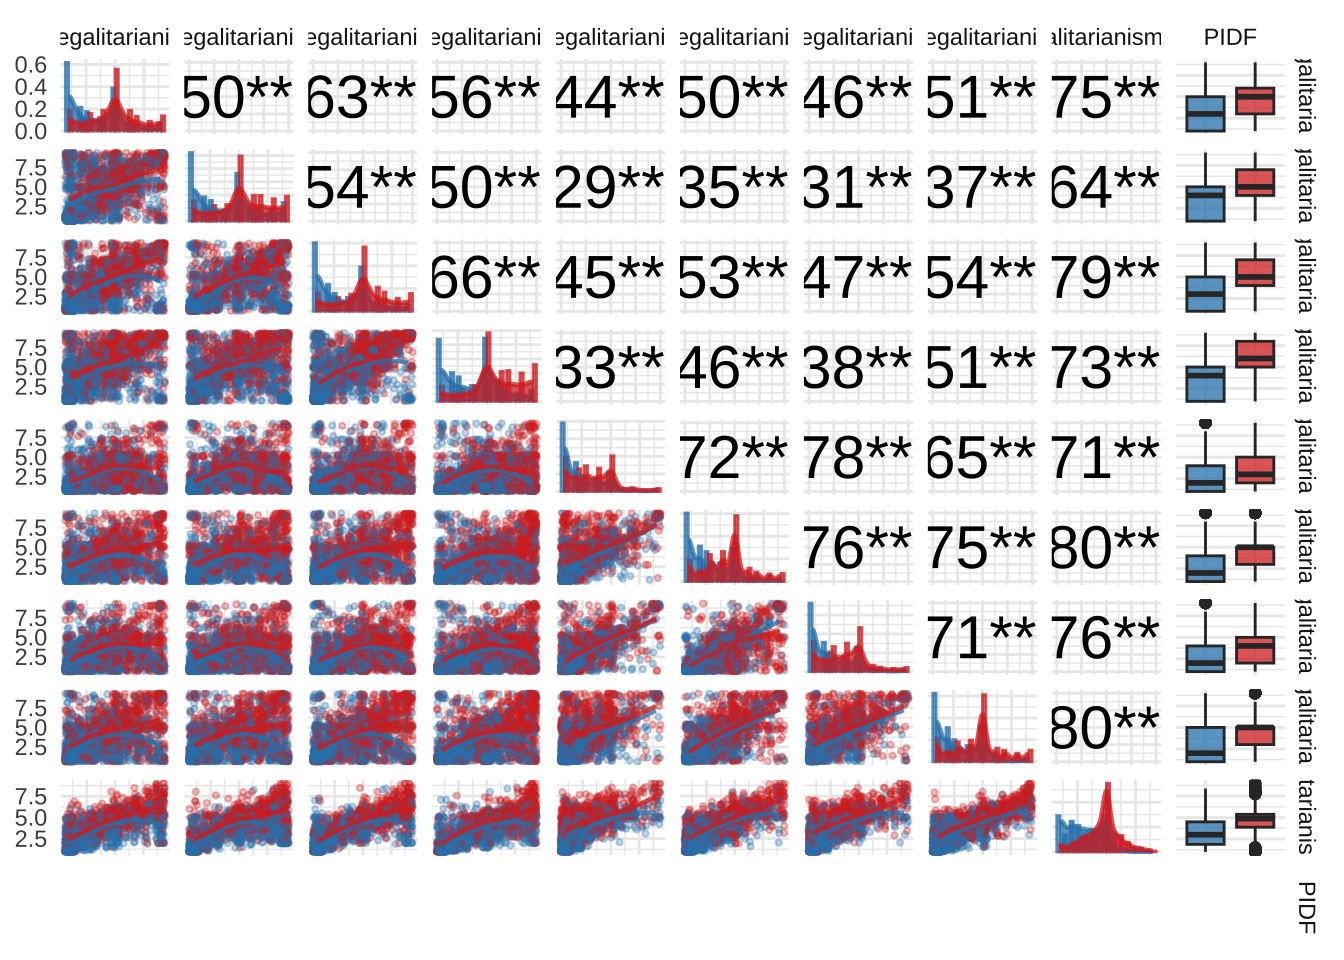
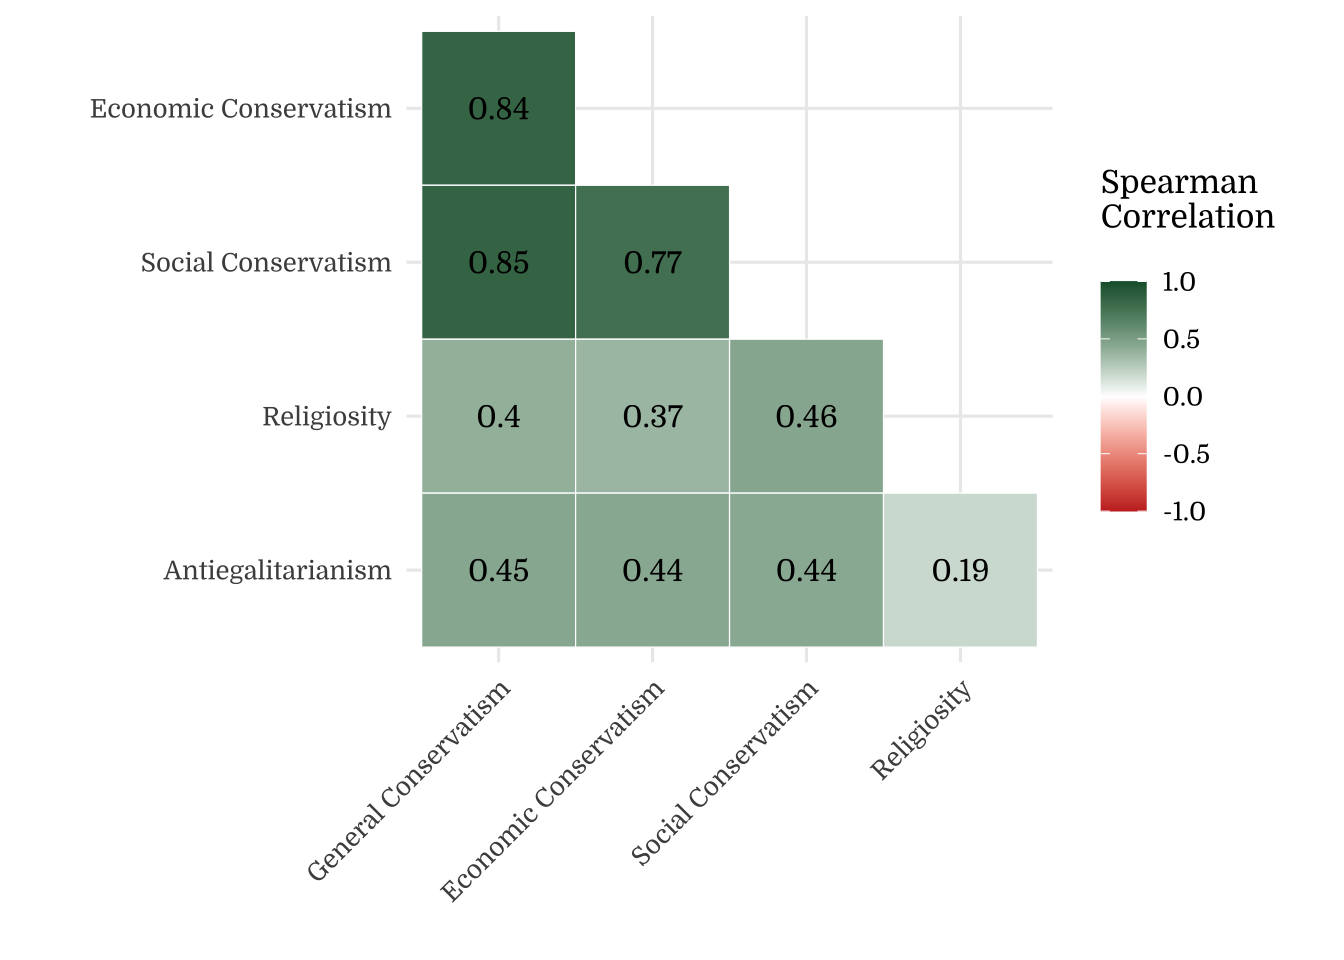
Note. Upper triangle shows Spearman’s rank-order correlations by party identity. *** p < .001, ** p < .01, * p < .05.
2.3.3 Correlation Matrix
3 Demographics
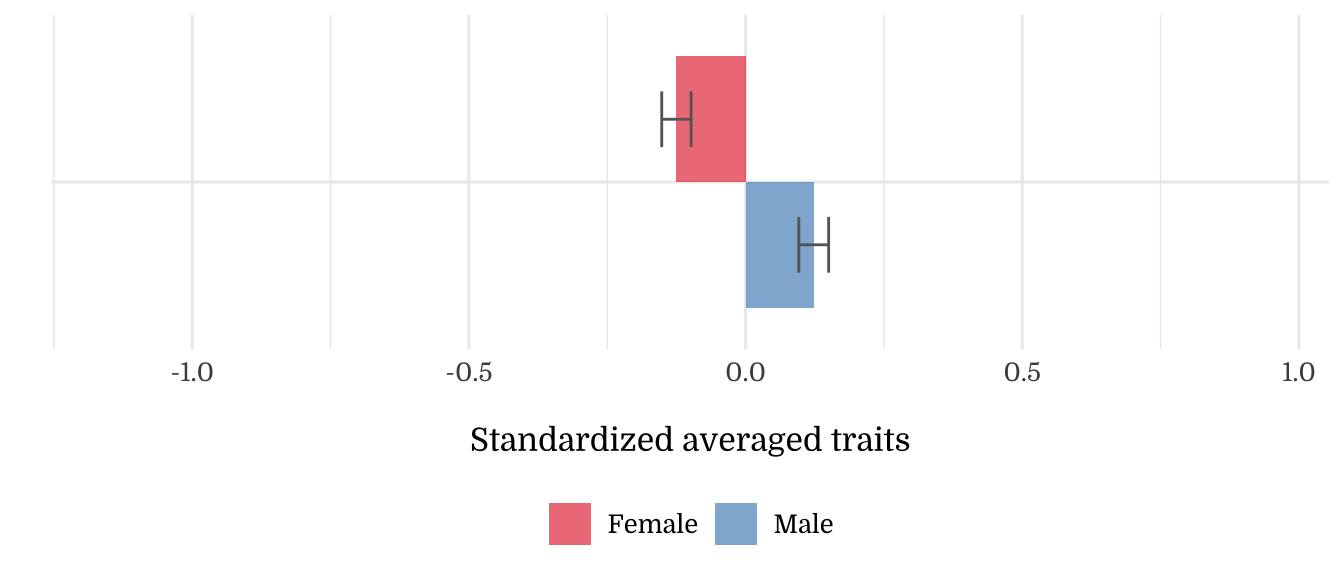
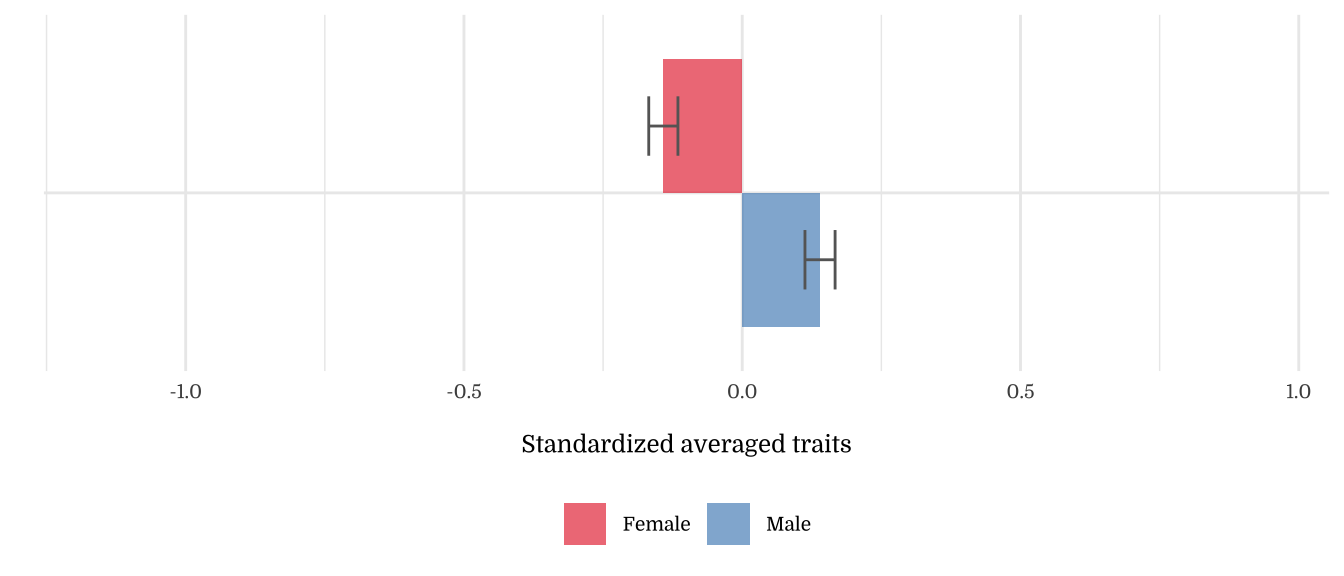
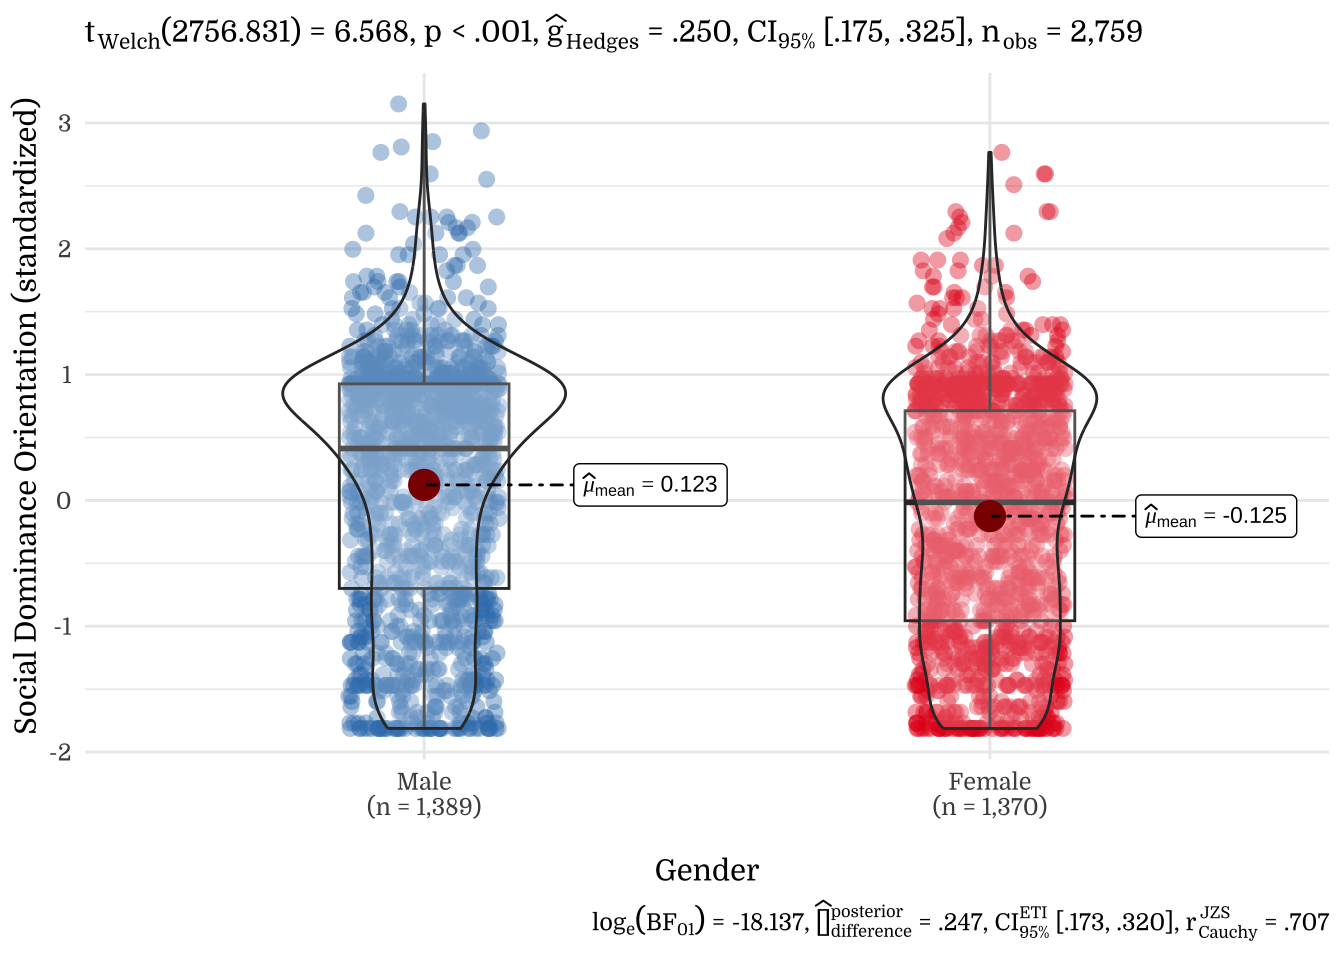
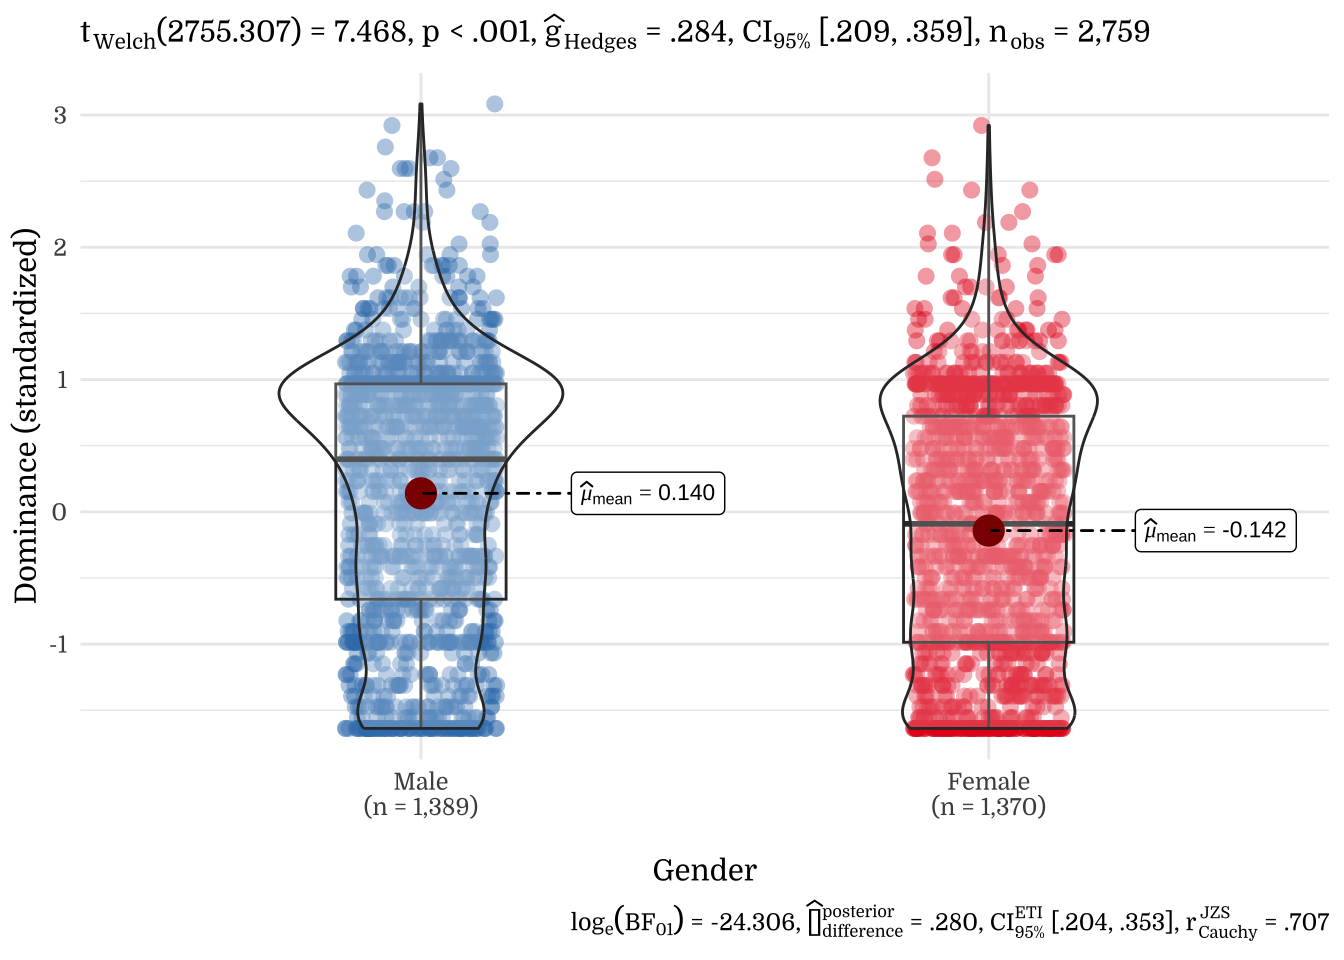
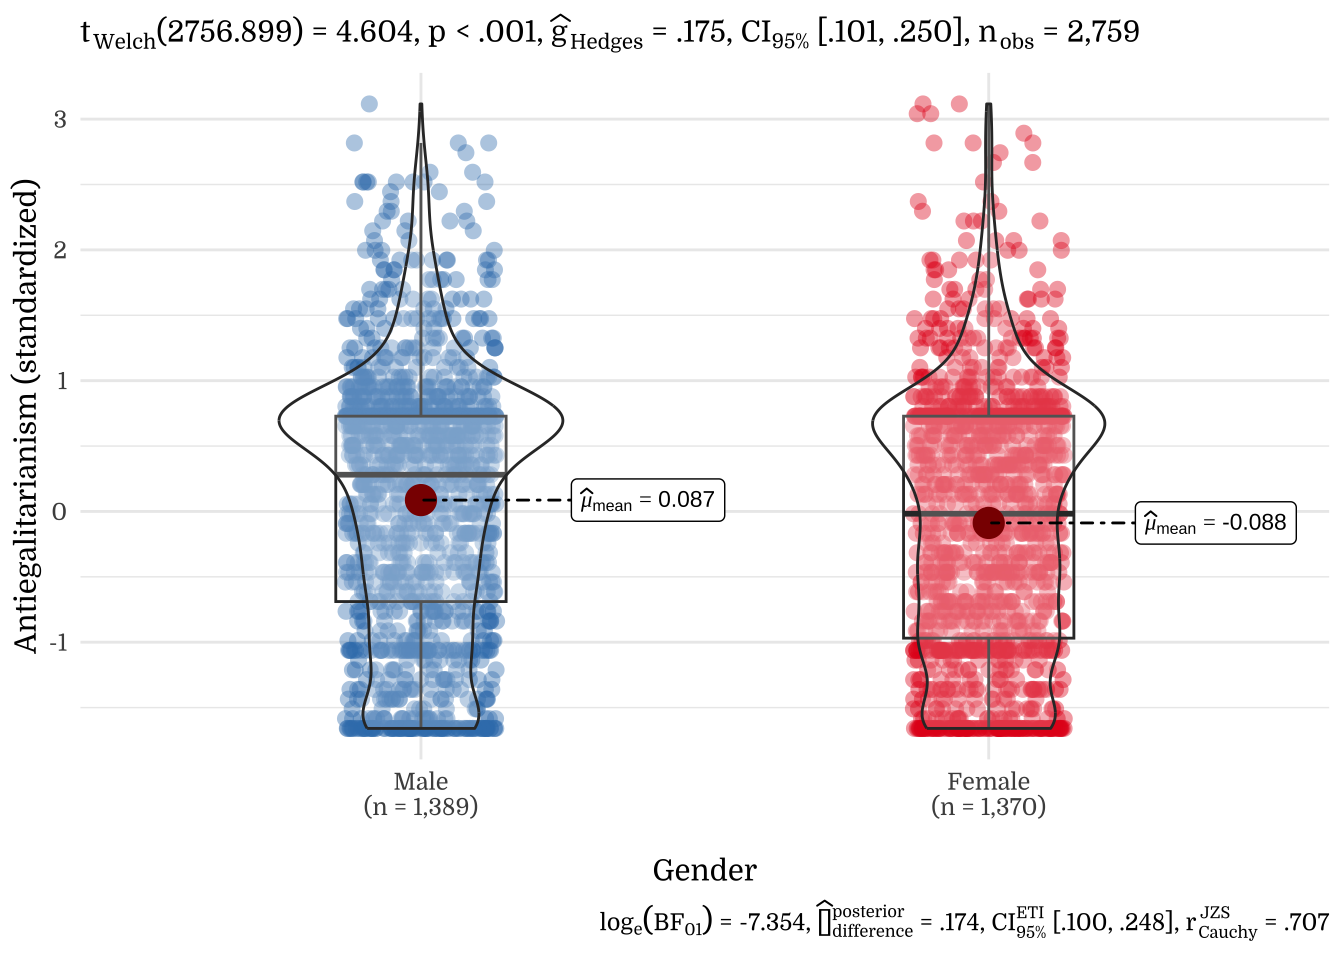
3.2 Gender
| Gender | N | Mean | SD |
|---|---|---|---|
| Female | 1370 | -0.14 | 0.97 |
| Male | 1389 | 0.14 | 1.01 |
| Gender | N | Mean | SD |
|---|---|---|---|
| Female | 1370 | -0.09 | 0.99 |
| Male | 1389 | 0.09 | 1.00 |
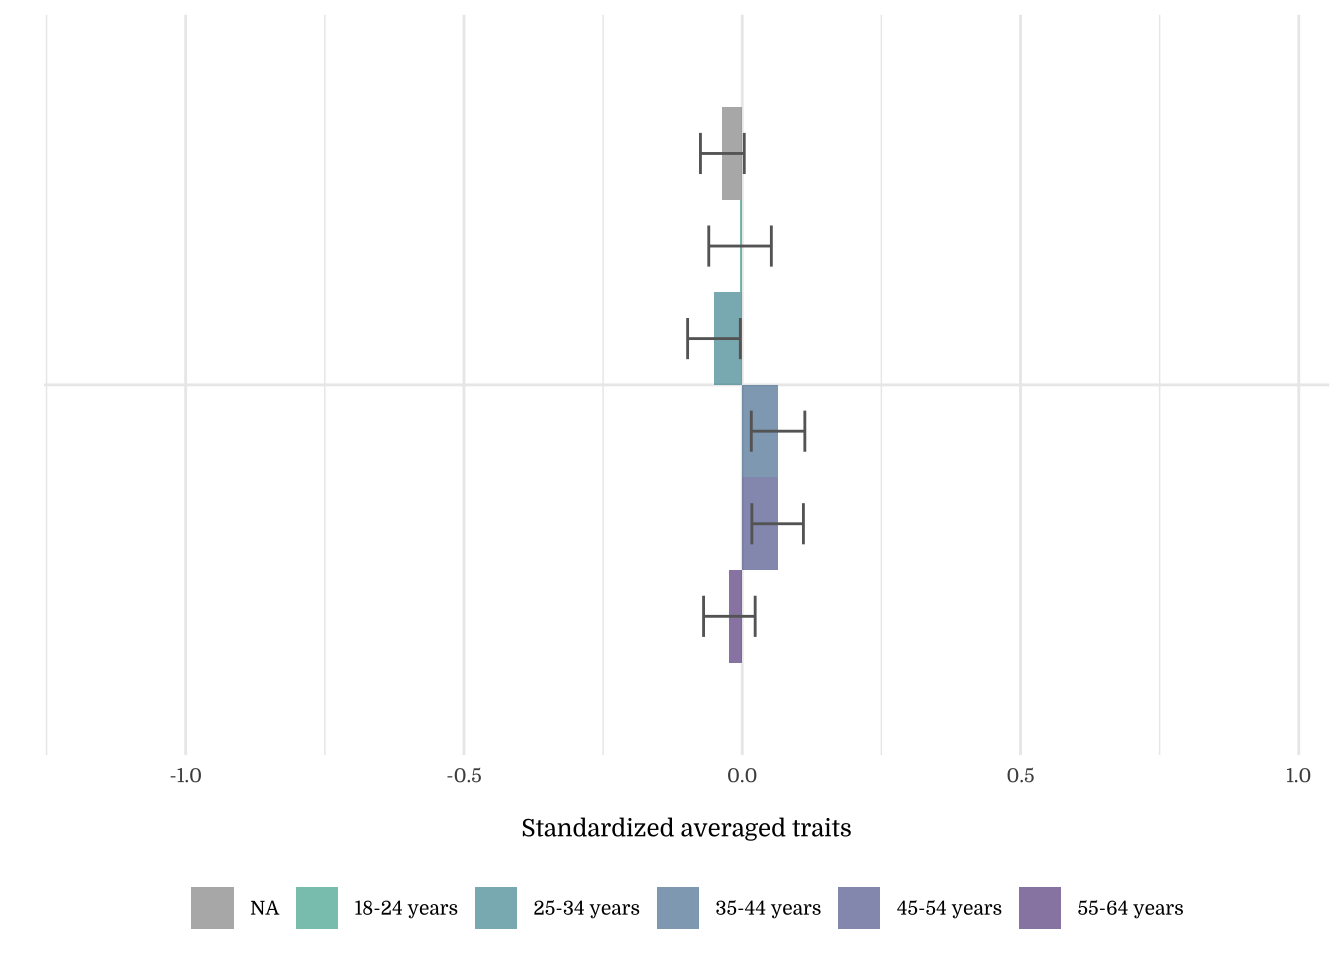
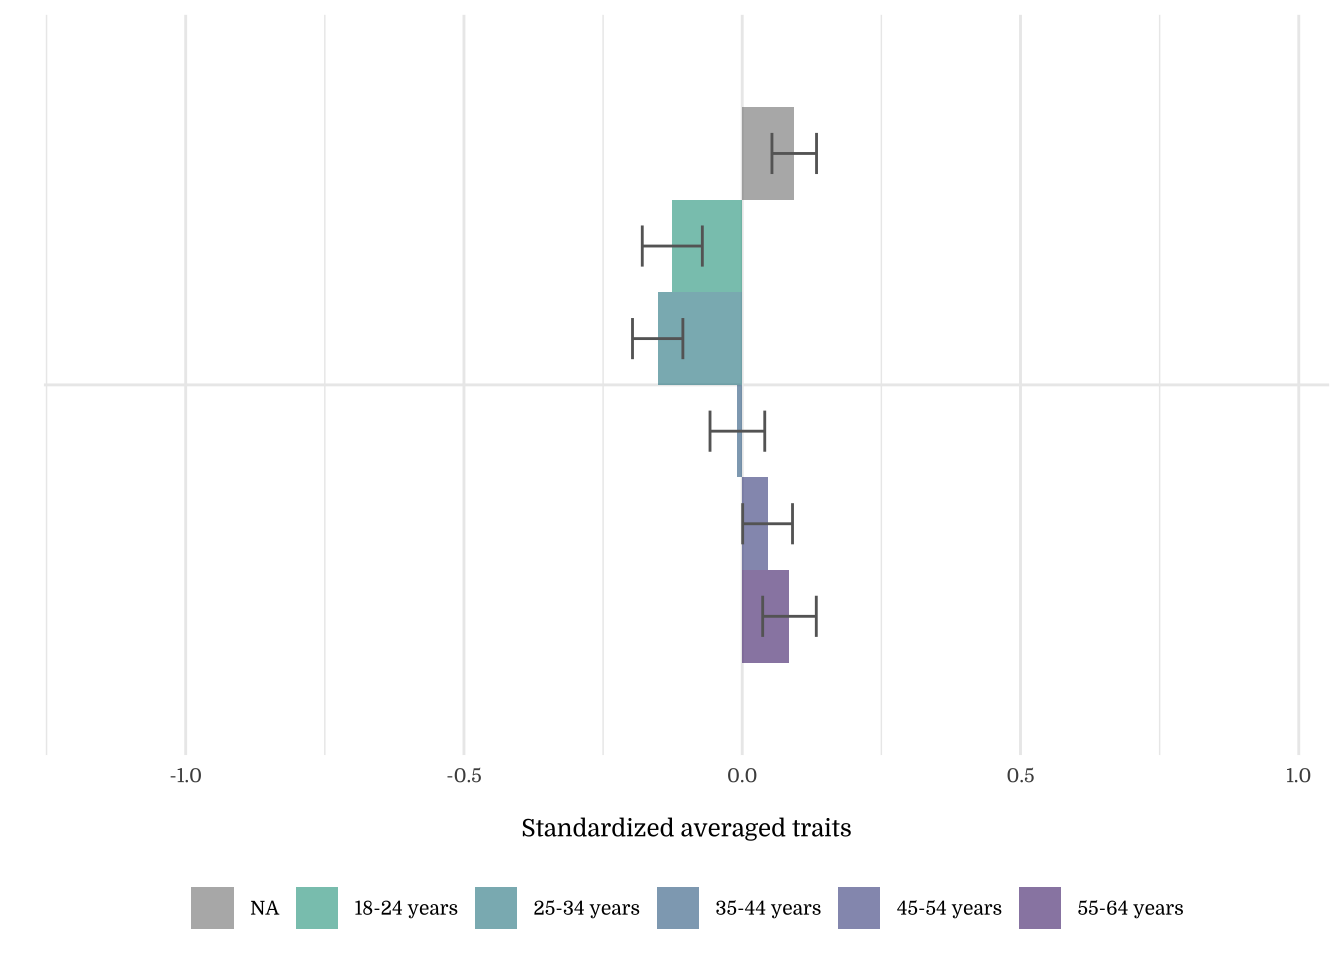
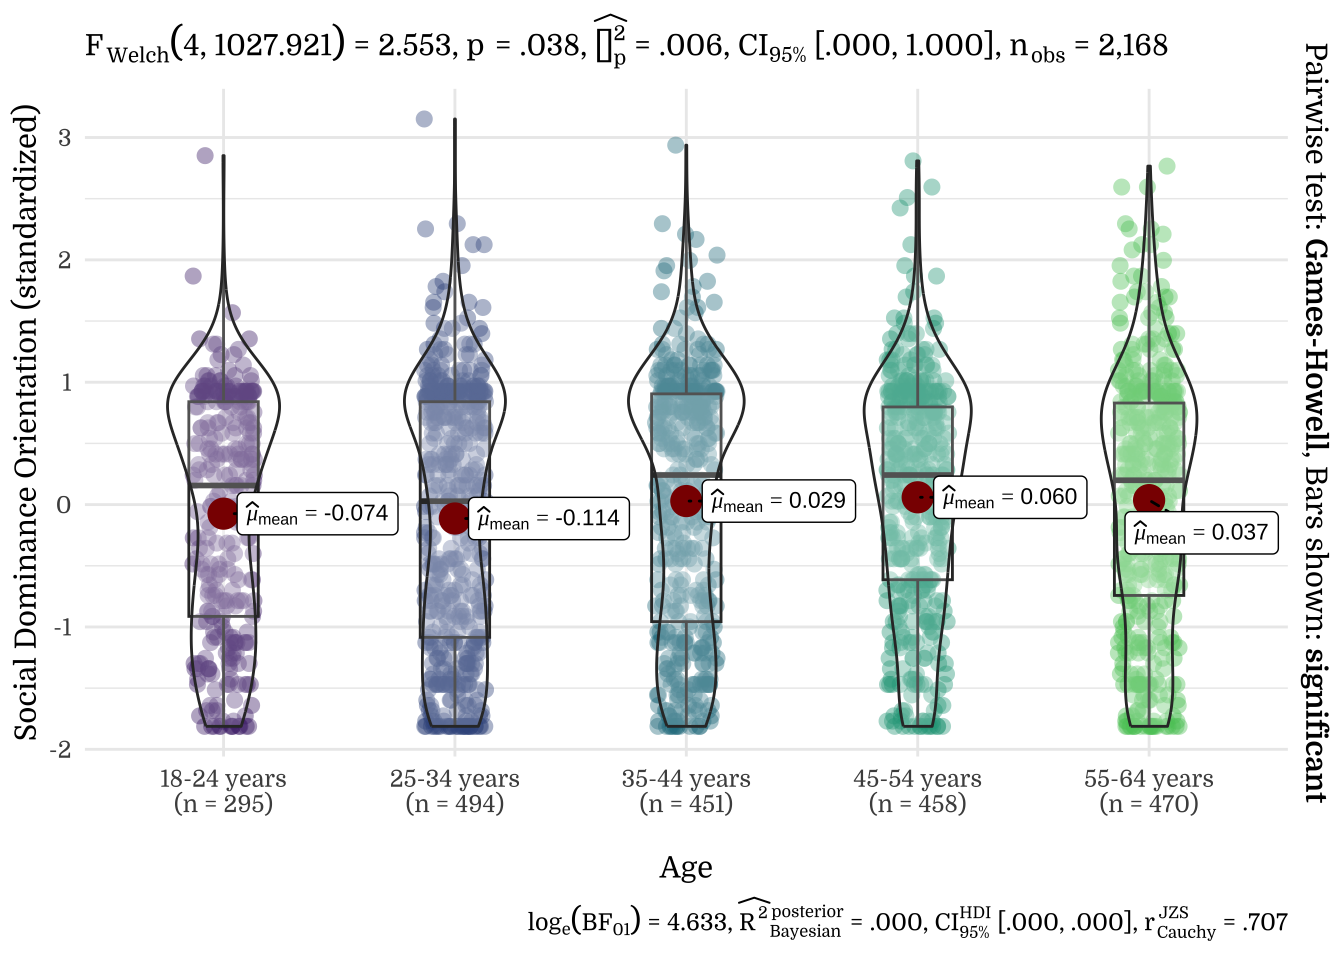
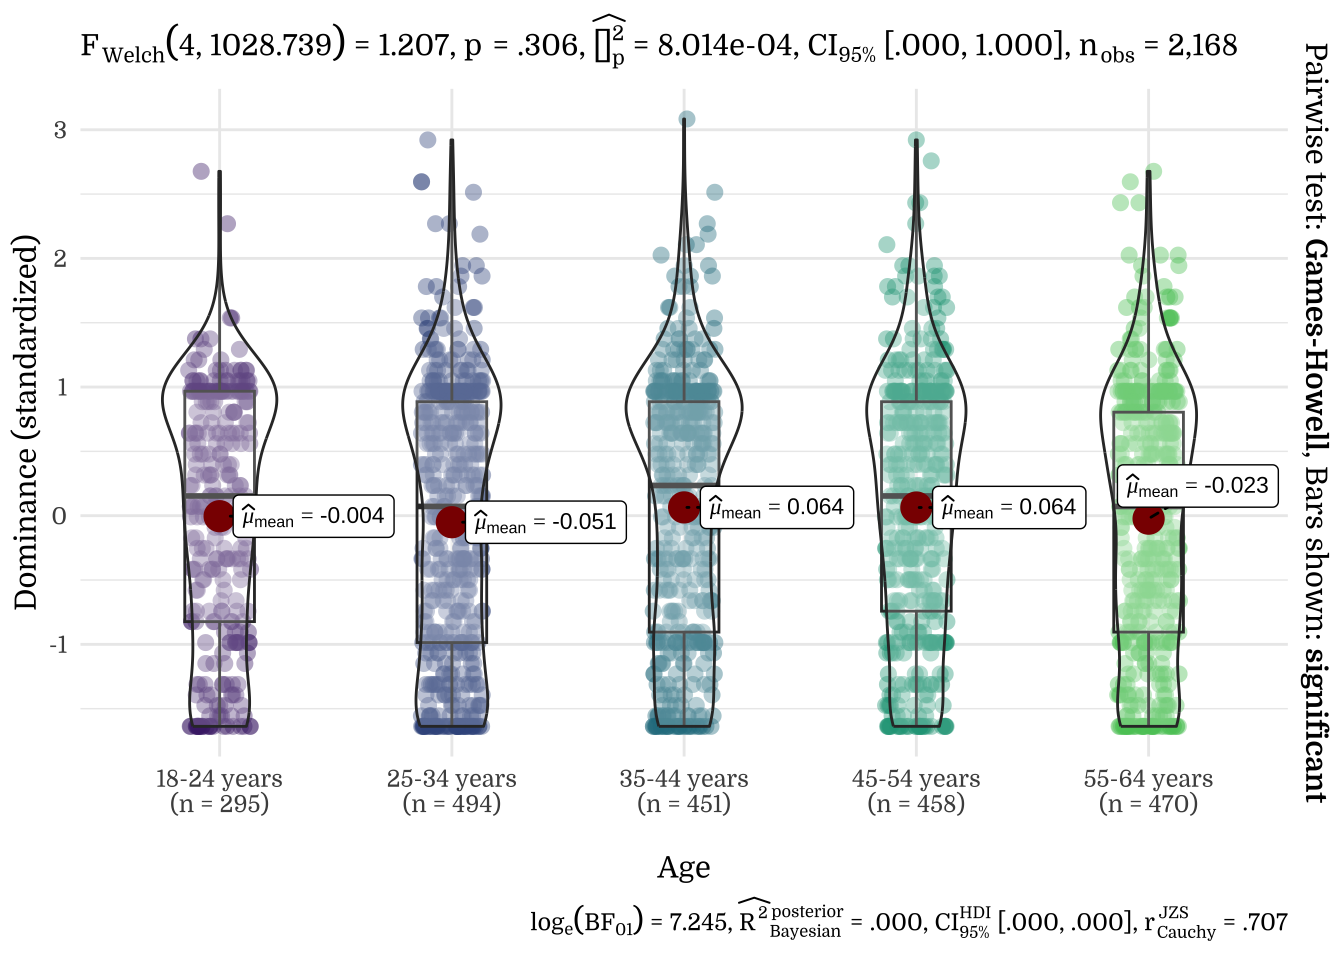
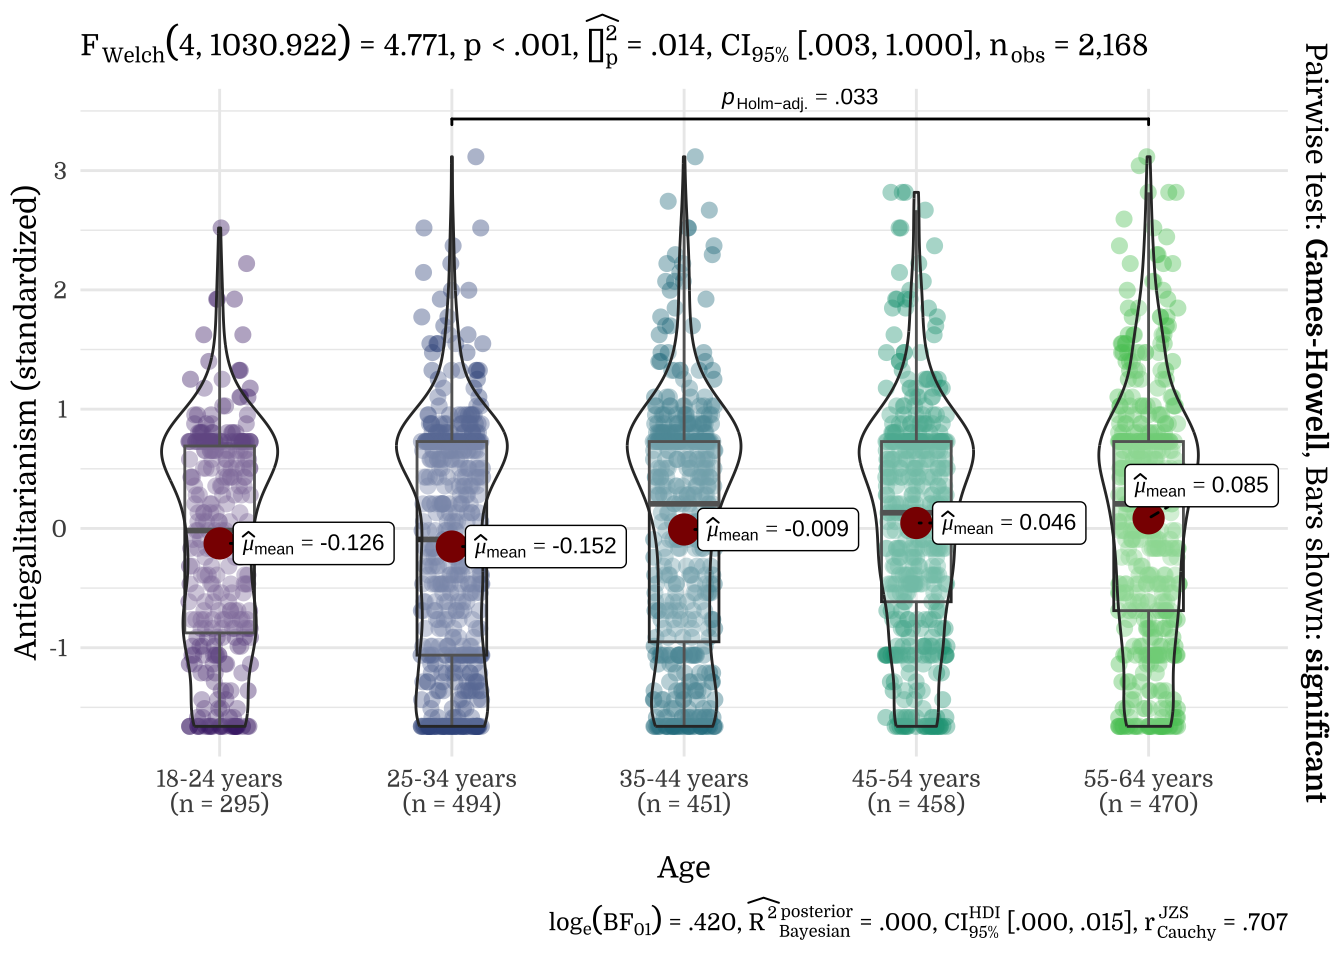
3.3 Age

| Age | N | Mean | SD |
|---|---|---|---|
| 18-24 years | 295 | 0.00 | 0.97 |
| 25-34 years | 494 | -0.05 | 1.05 |
| 35-44 years | 451 | 0.06 | 1.02 |
| 45-54 years | 458 | 0.06 | 0.99 |
| 55-64 years | 470 | -0.02 | 1.00 |
| NA | 591 | -0.04 | 0.96 |
| Age | N | Mean | SD |
|---|---|---|---|
| 18-24 years | 295 | -0.13 | 0.93 |
| 25-34 years | 494 | -0.15 | 1.01 |
| 35-44 years | 451 | -0.01 | 1.04 |
| 45-54 years | 458 | 0.05 | 0.96 |
| 55-64 years | 470 | 0.08 | 1.04 |
| NA | 591 | 0.09 | 0.97 |
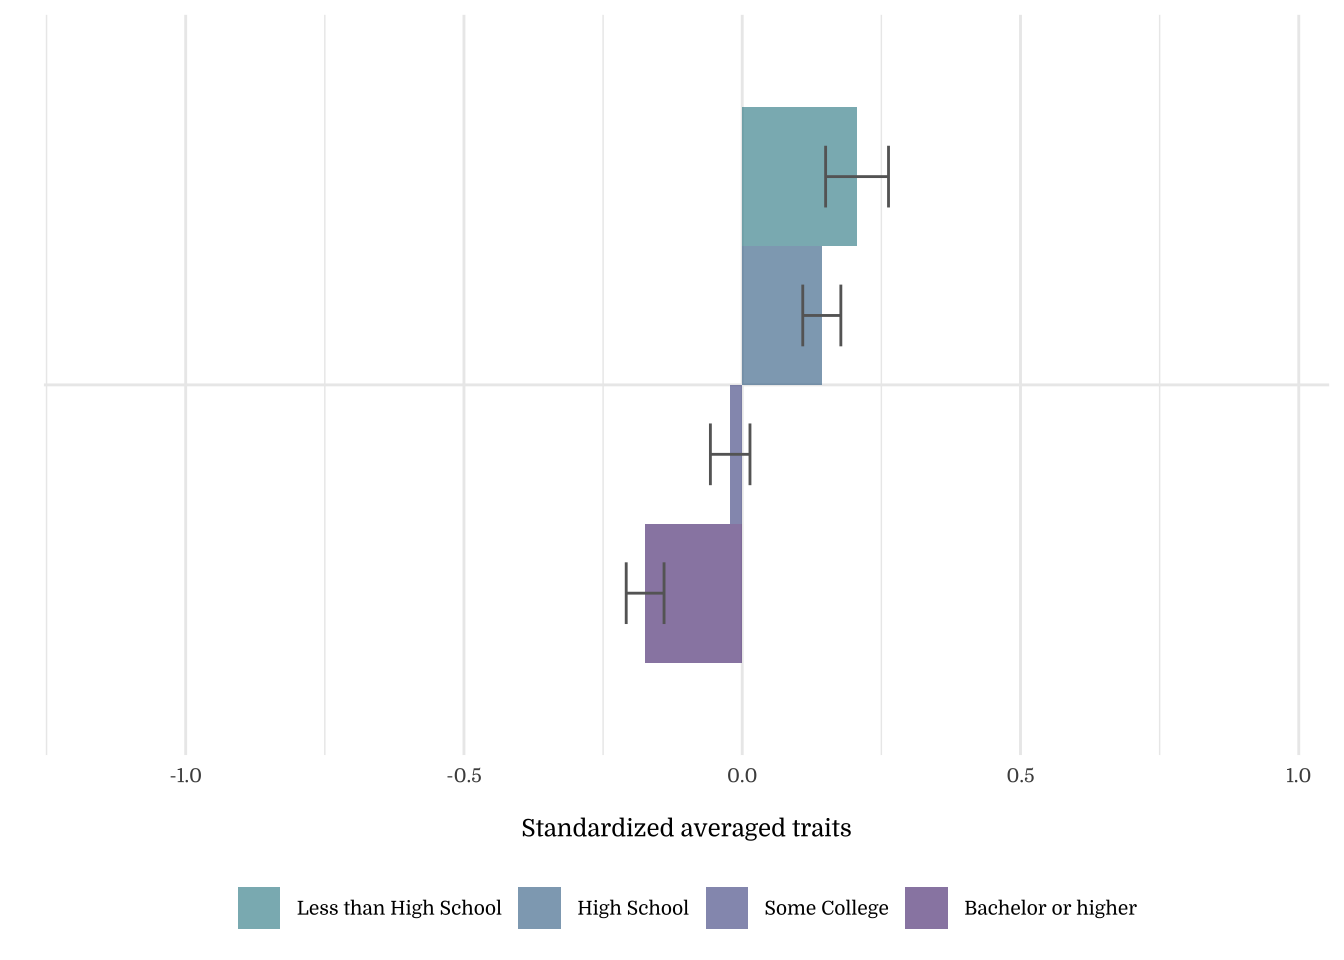
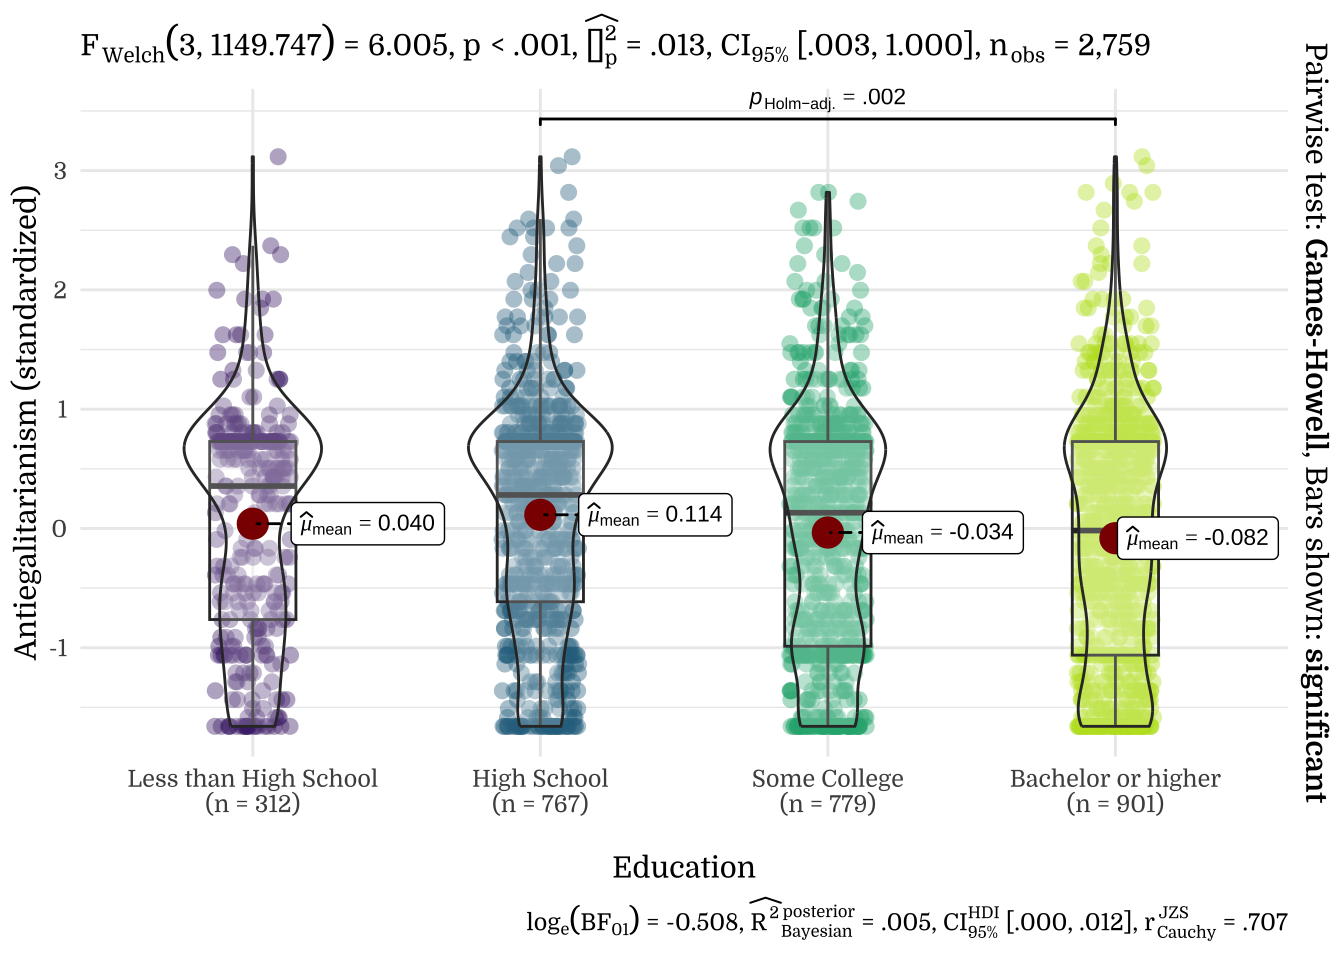
3.4 Education
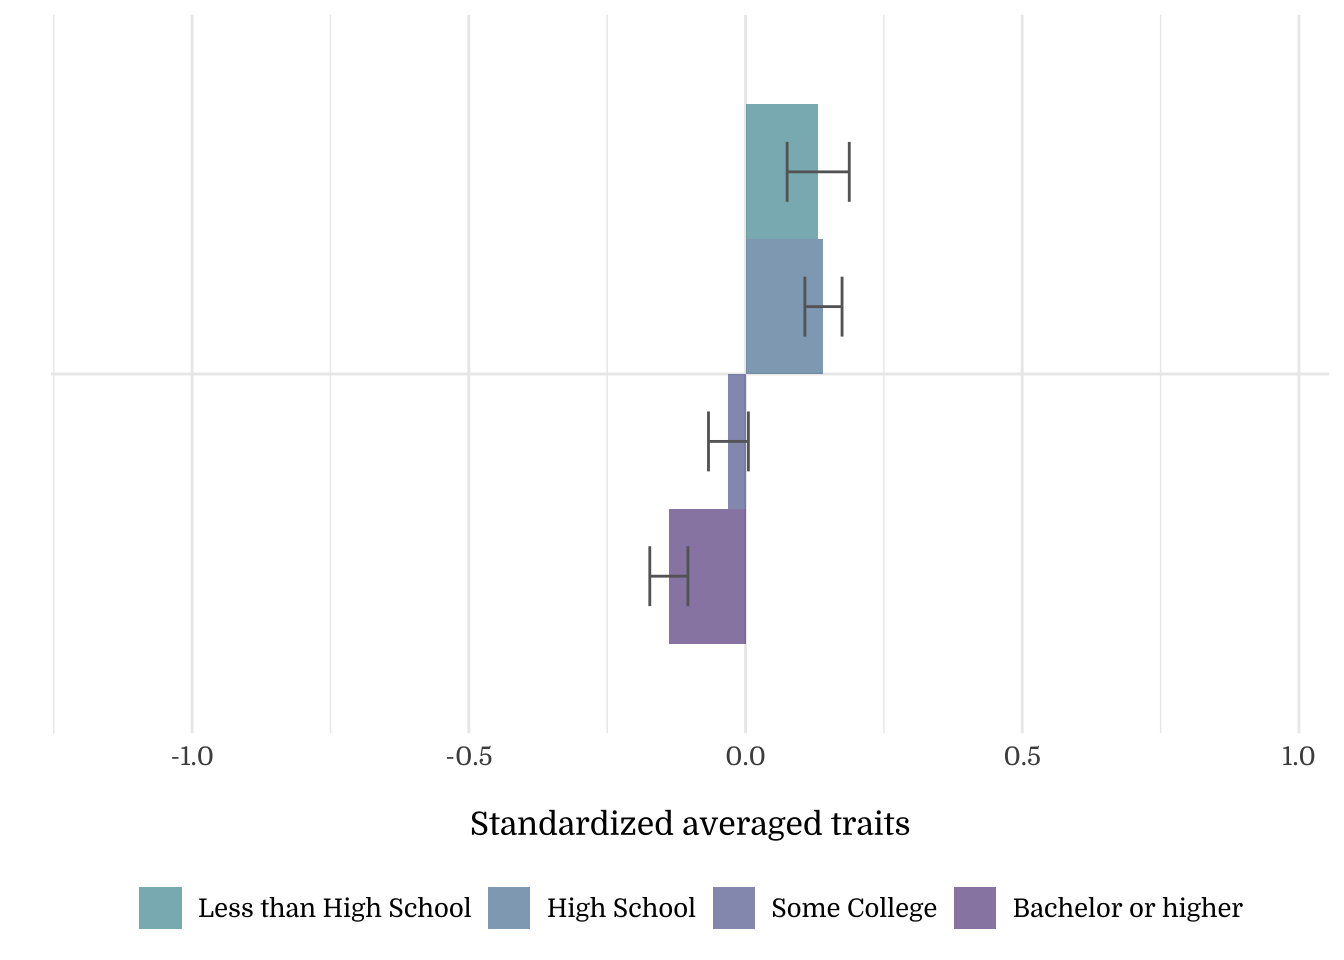
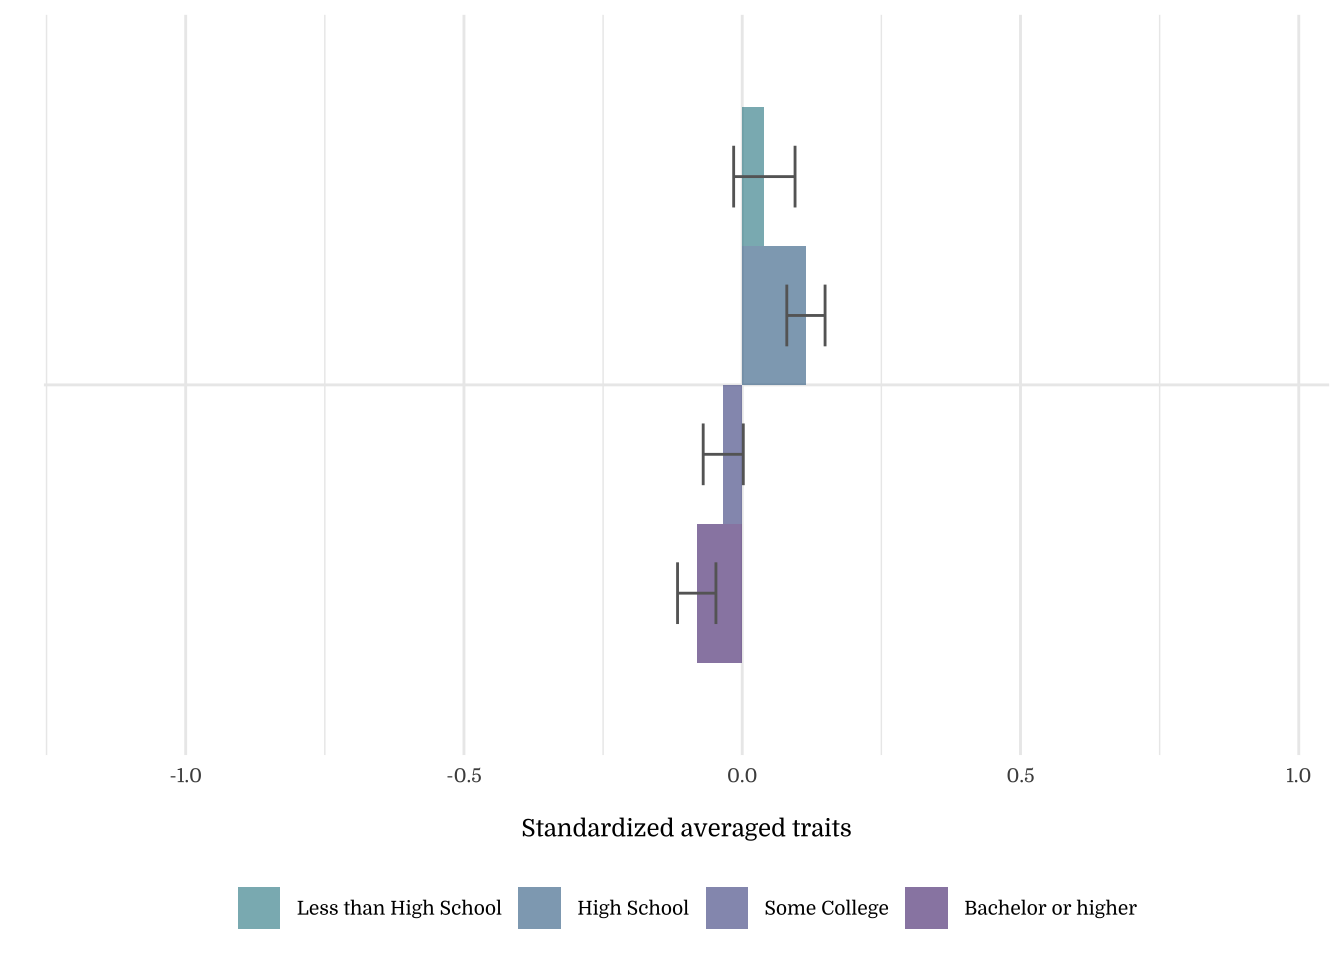
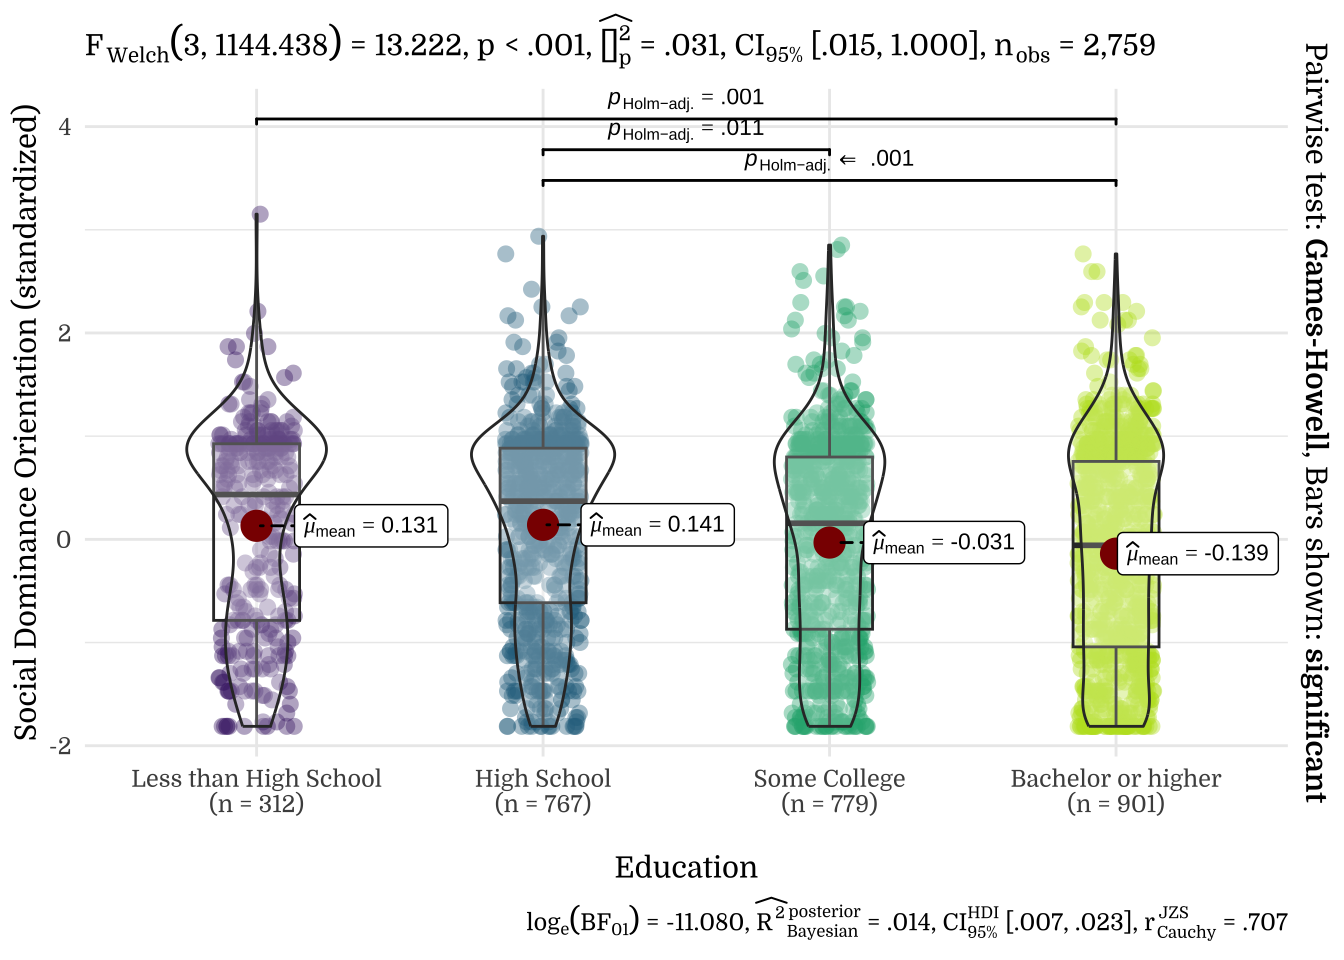
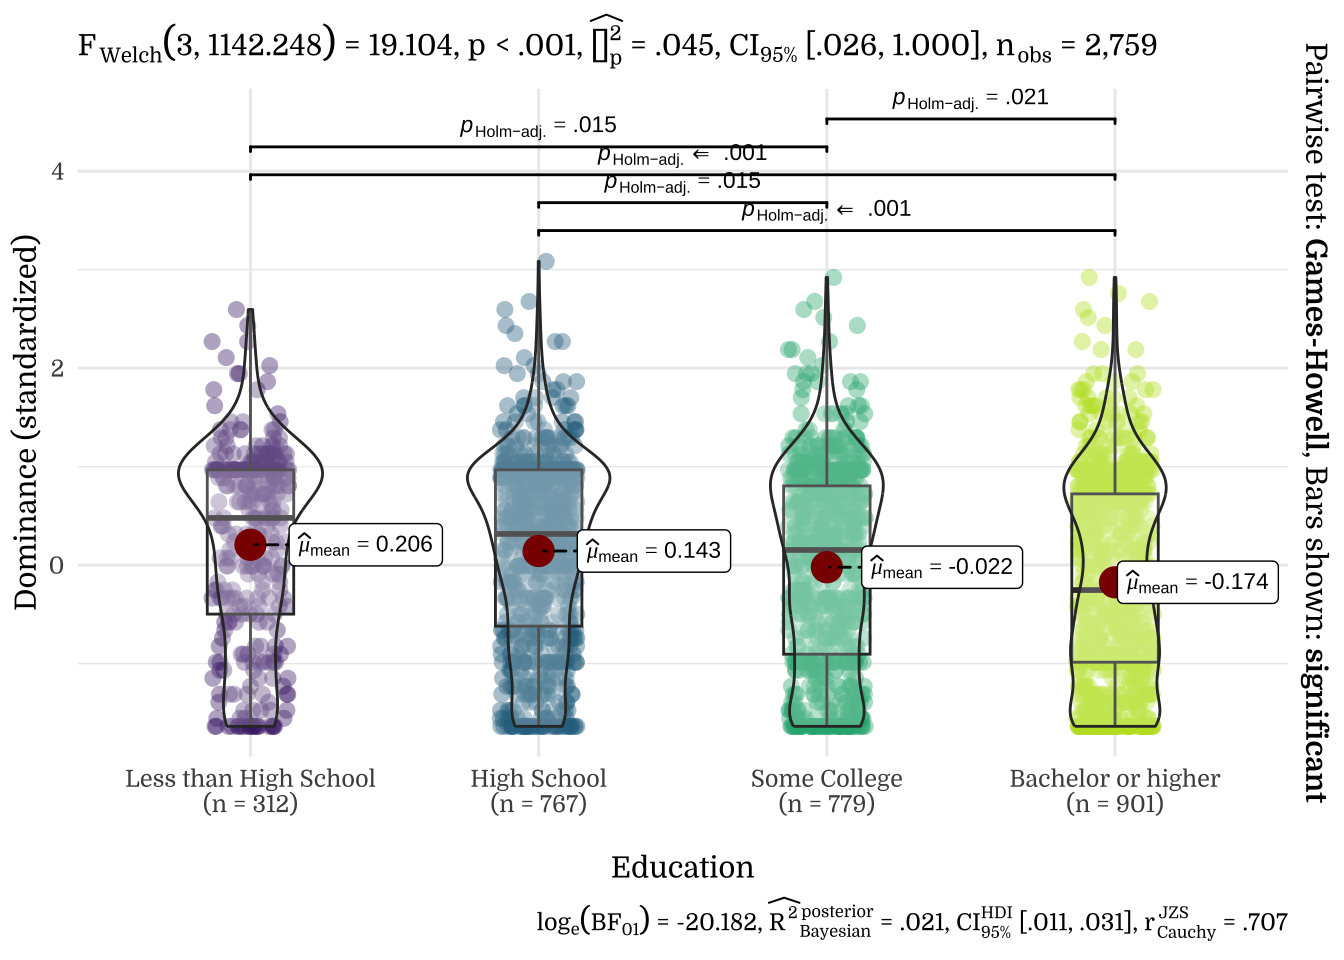
| Education | N | Mean | SD |
|---|---|---|---|
| Less than High School | 312 | 0.21 | 1.00 |
| High School | 767 | 0.14 | 0.95 |
| Some College | 779 | -0.02 | 0.99 |
| Bachelor or higher | 901 | -0.17 | 1.02 |
| Education | N | Mean | SD |
|---|---|---|---|
| Less than High School | 312 | 0.04 | 0.97 |
| High School | 767 | 0.11 | 0.95 |
| Some College | 779 | -0.03 | 1.01 |
| Bachelor or higher | 901 | -0.08 | 1.03 |
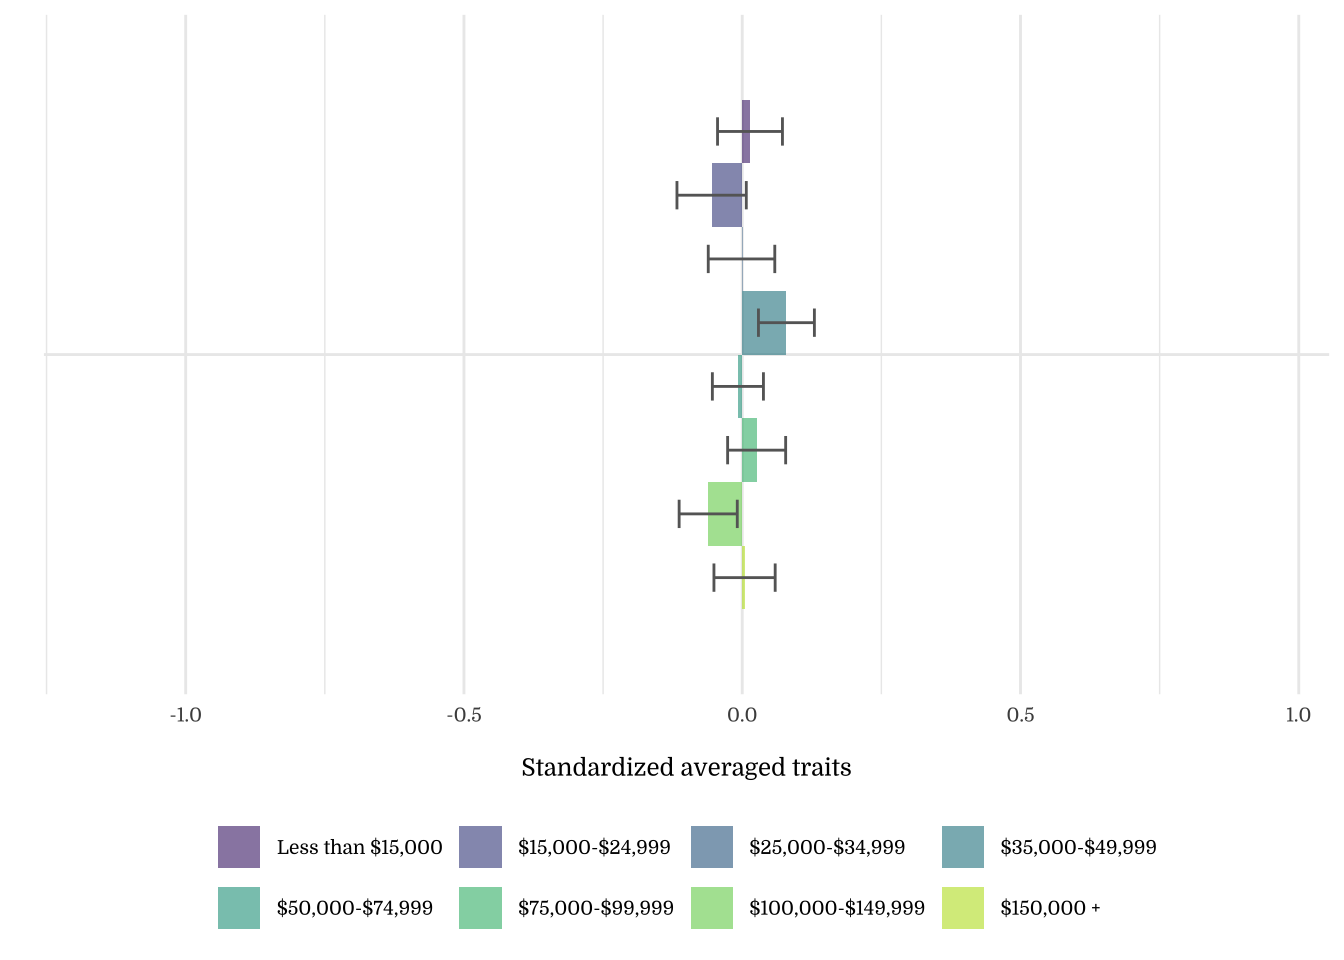
3.5 Income Levels
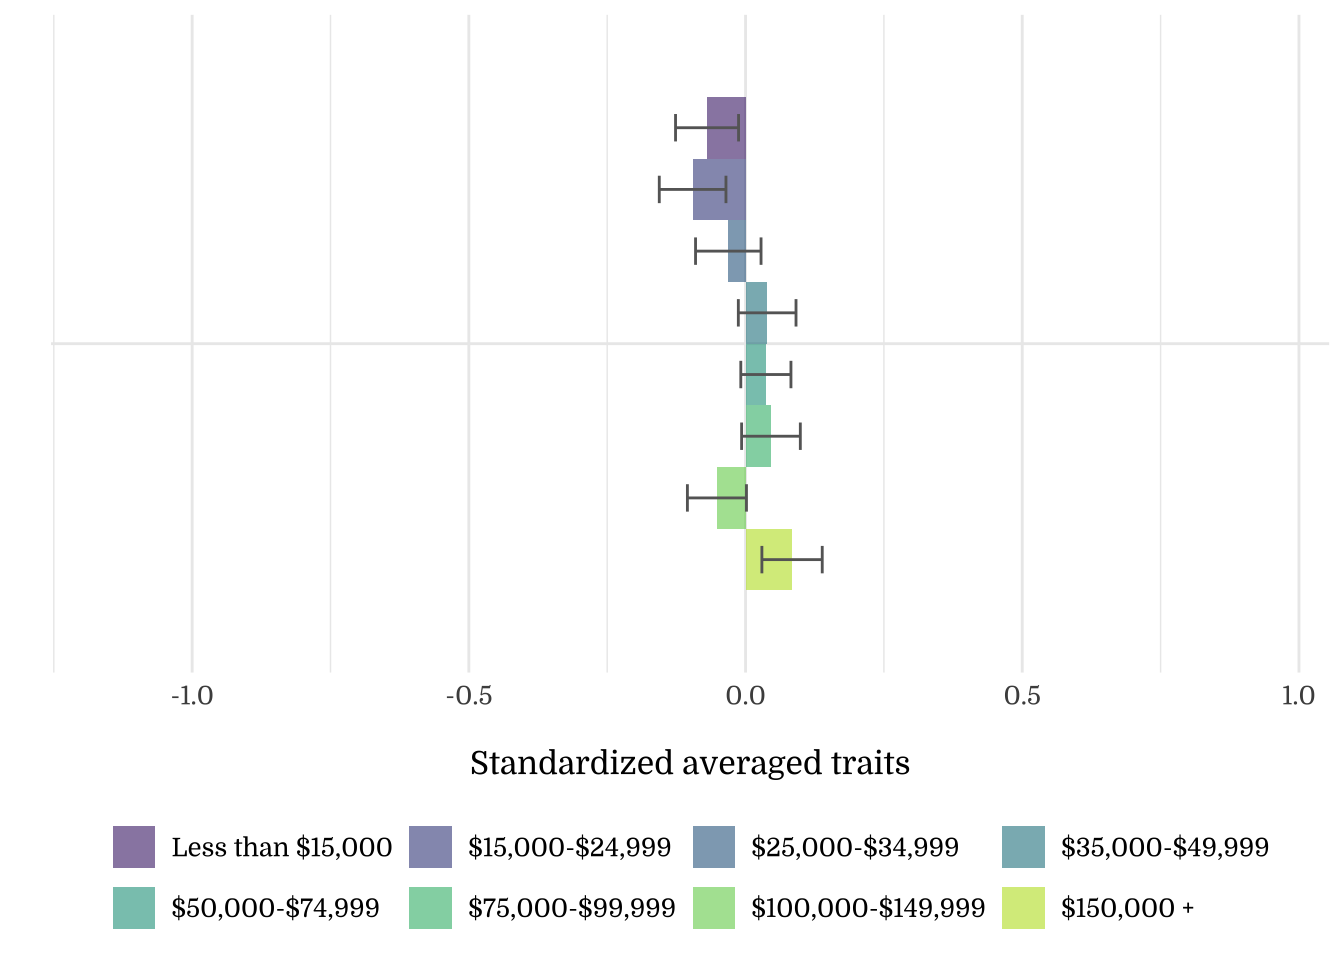
| Income Levels | N | Mean | SD |
|---|---|---|---|
| Less than $15,000 | 310 | 0.01 | 1.03 |
| $15,000-$24,999 | 275 | -0.05 | 1.03 |
| $25,000-$34,999 | 260 | 0.00 | 0.96 |
| $35,000-$49,999 | 351 | 0.08 | 0.94 |
| $50,000-$74,999 | 495 | -0.01 | 1.02 |
| $75,000-$99,999 | 355 | 0.03 | 0.98 |
| $100,000-$149,999 | 384 | -0.06 | 1.02 |
| $150,000 + | 329 | 0.00 | 1.00 |
| Income Levels | N | Mean | SD |
|---|---|---|---|
| Less than $15,000 | 310 | -0.13 | 0.98 |
| $15,000-$24,999 | 275 | -0.12 | 0.97 |
| $25,000-$34,999 | 260 | -0.05 | 0.96 |
| $35,000-$49,999 | 351 | 0.00 | 0.98 |
| $50,000-$74,999 | 495 | 0.07 | 1.00 |
| $75,000-$99,999 | 355 | 0.06 | 1.00 |
| $100,000-$149,999 | 384 | -0.03 | 1.04 |
| $150,000 + | 329 | 0.14 | 1.01 |
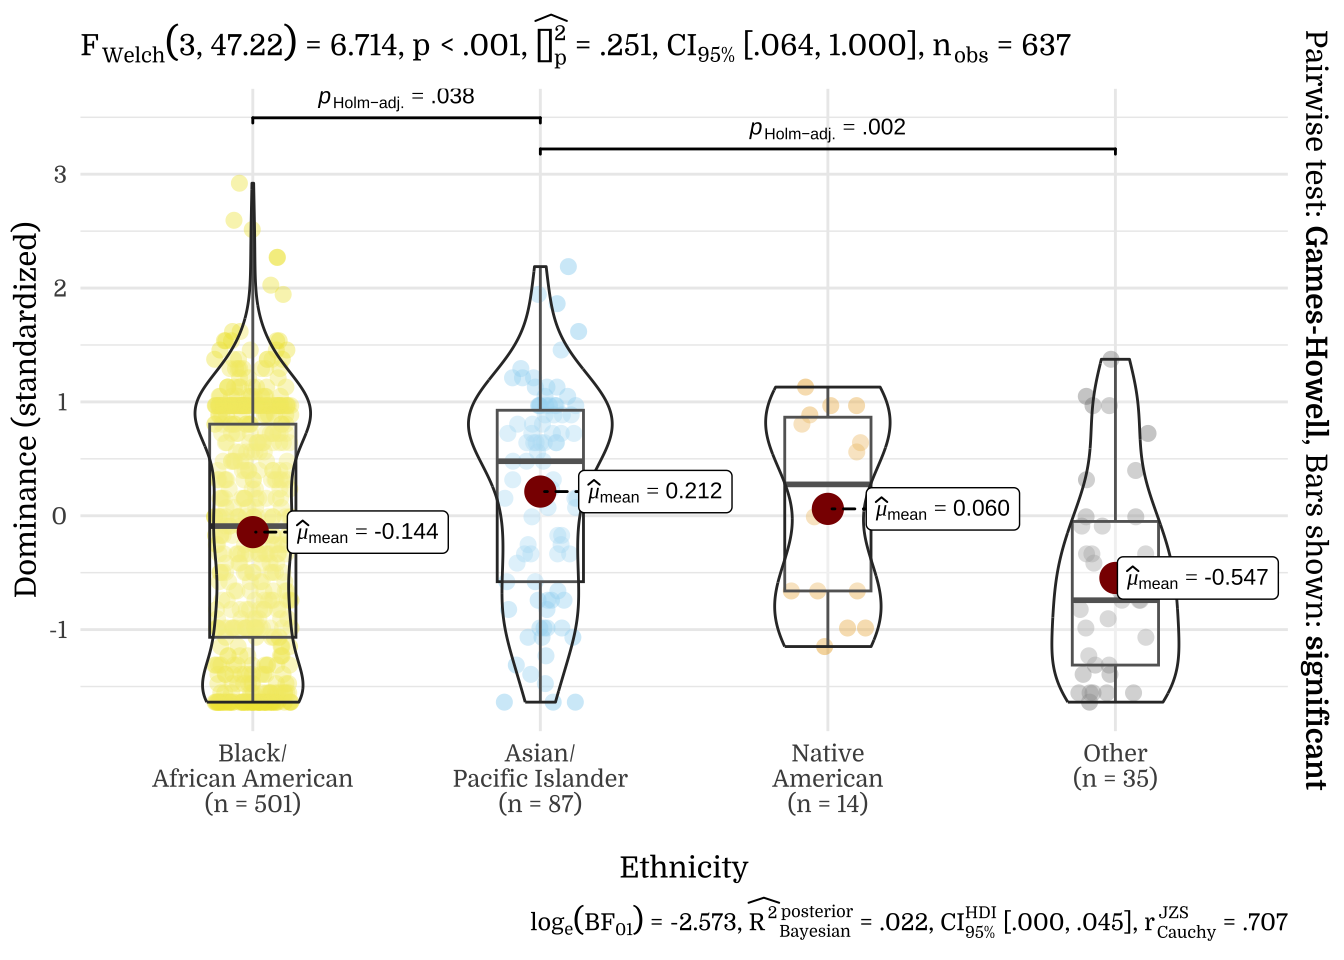
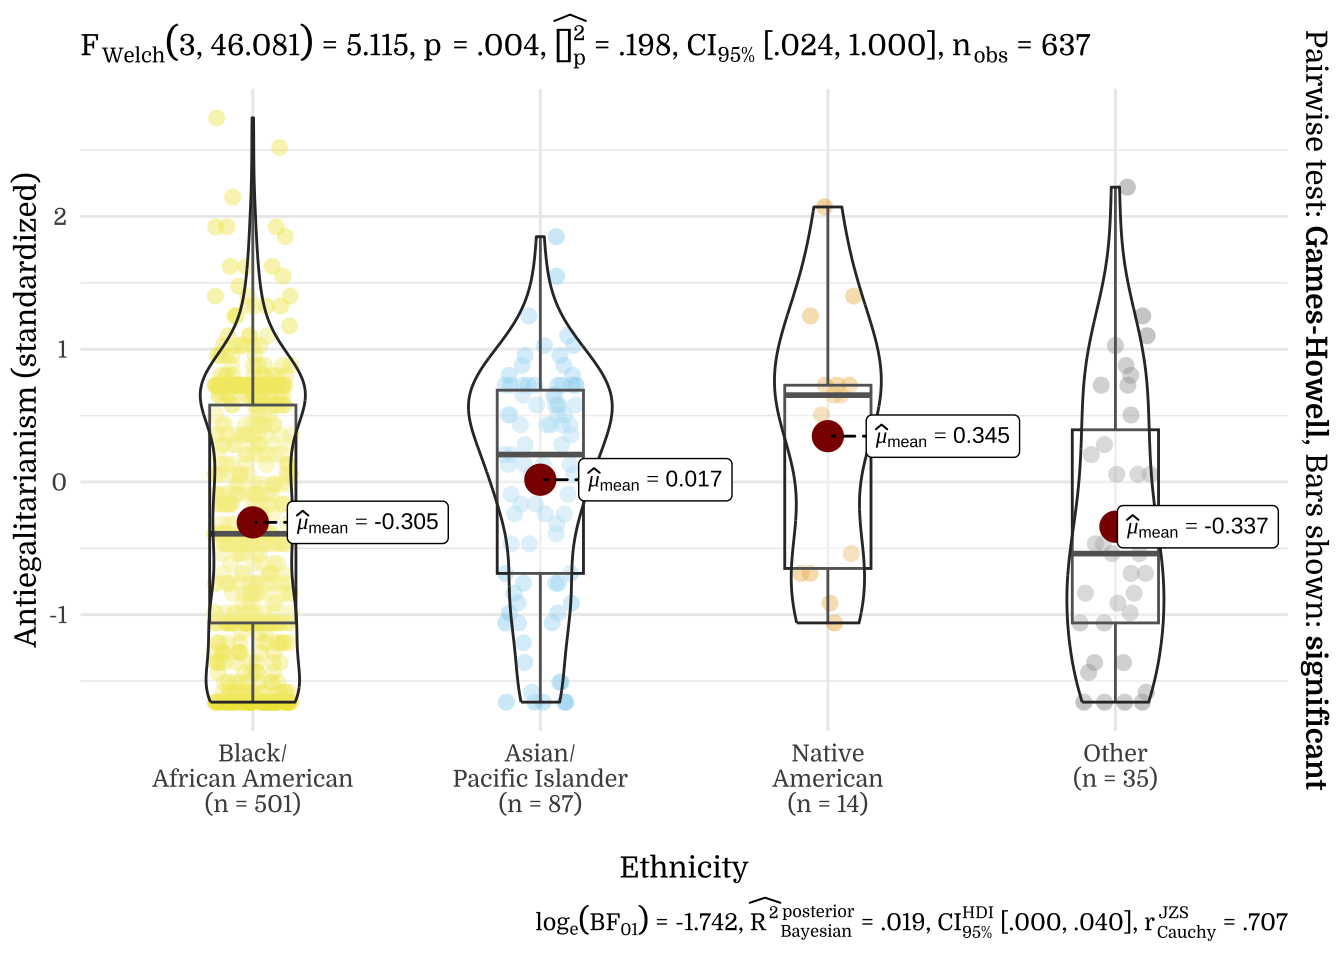
3.6 Ethnicity
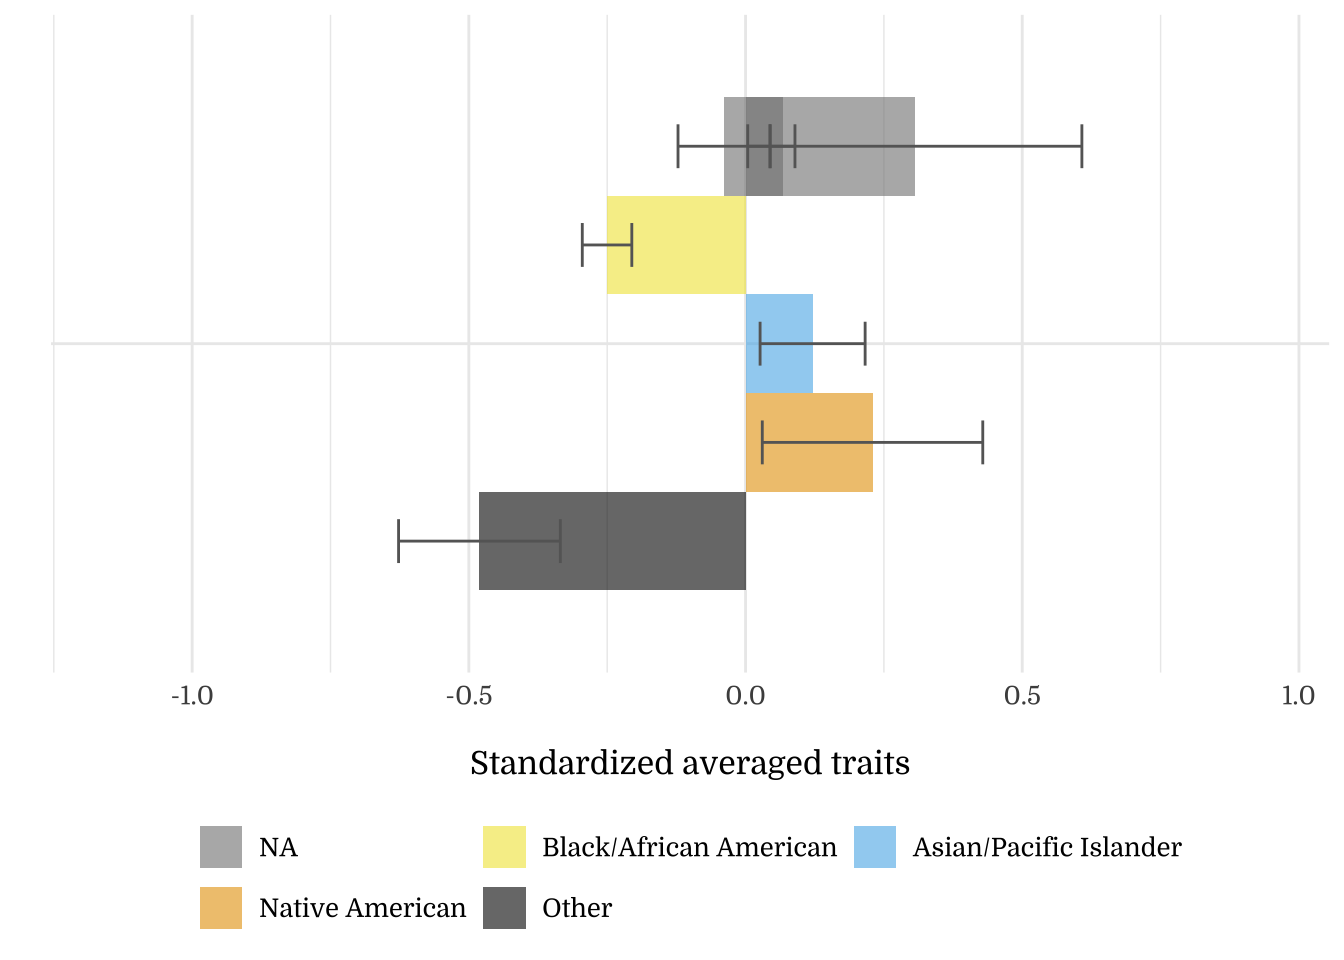
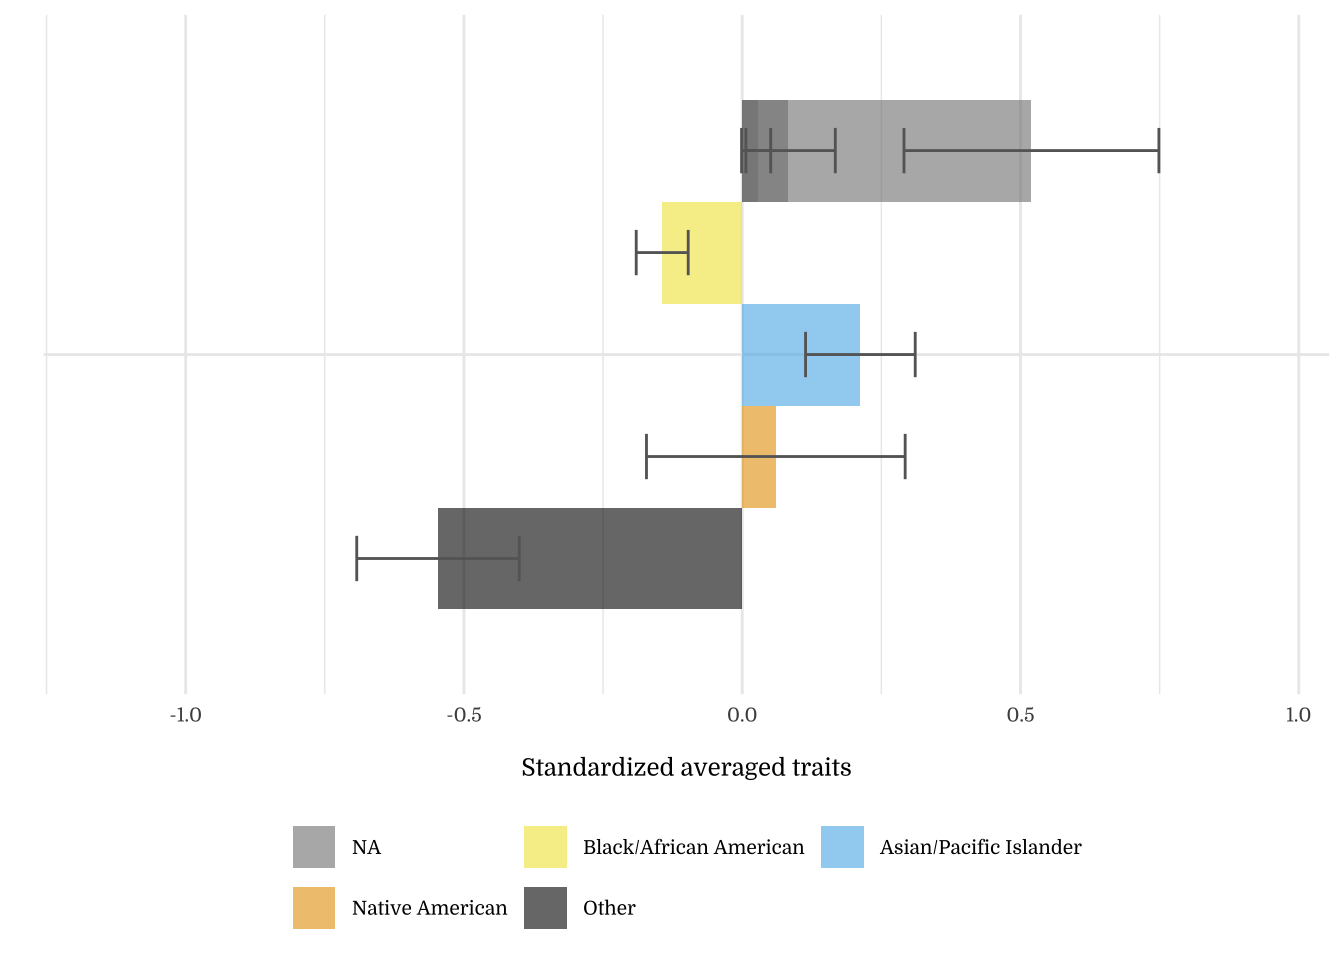
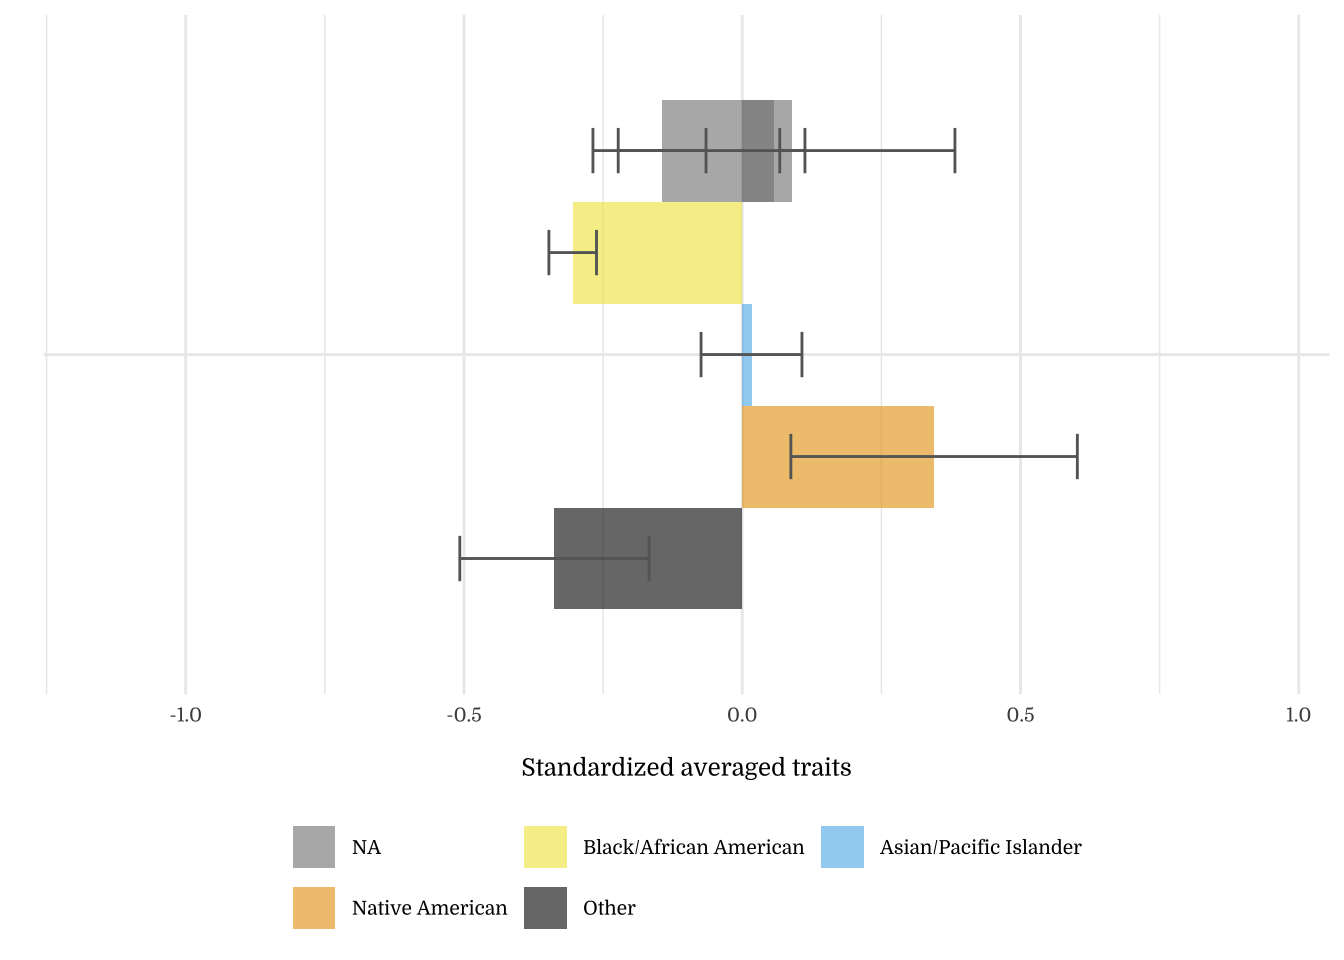
Note on the Okabe-Ito color palette. The Okabe-Ito color palette (seen above) is a set of colorblind-friendly categorical colors available in R. We are using this palette for graphs with non-ordered variables (e.g., groups, categories) for accessibility.
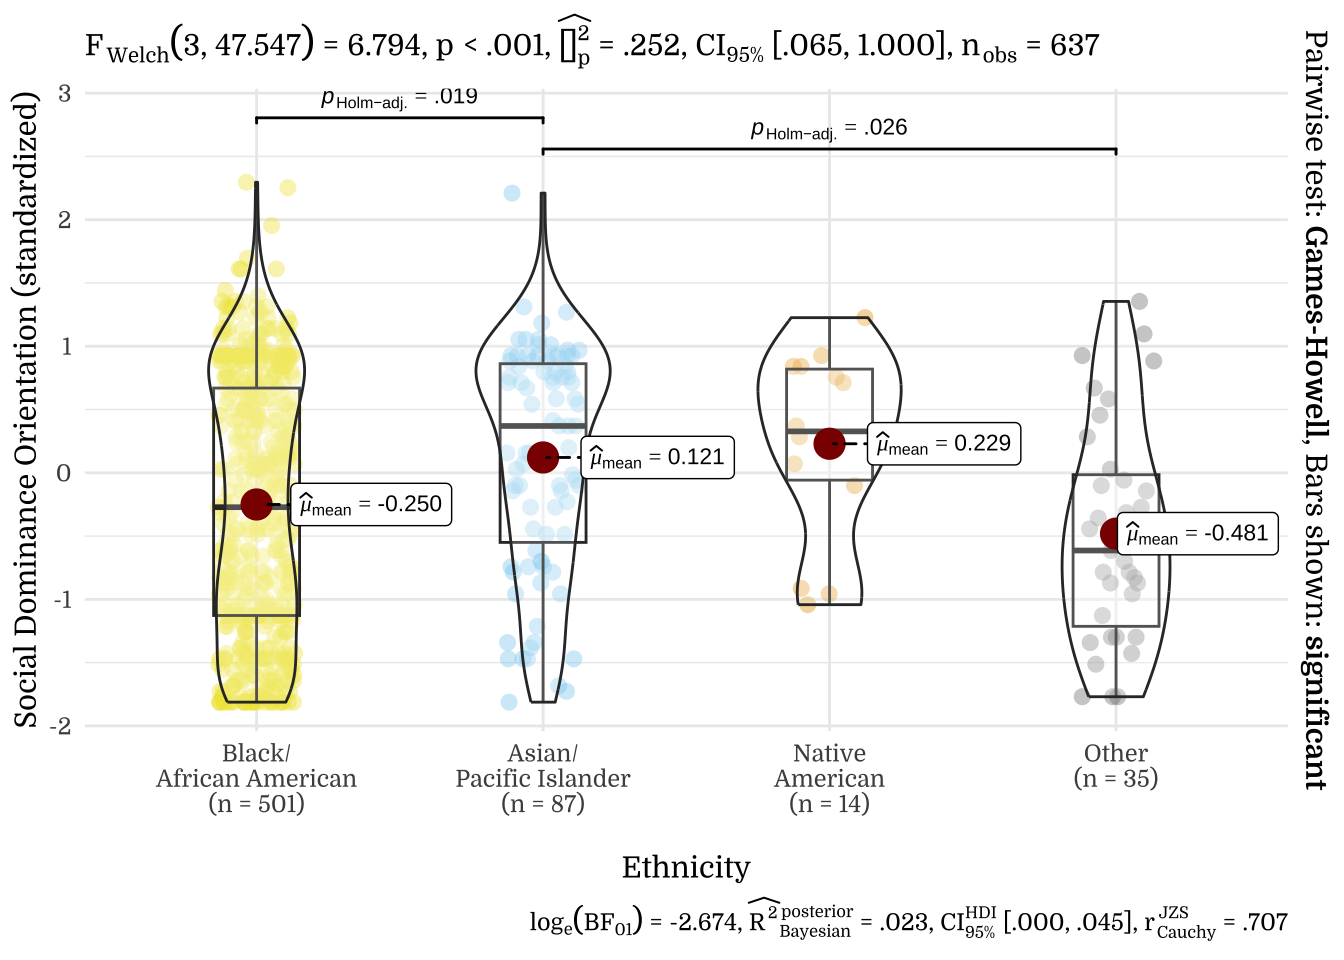
| Ethnicity | N | Mean | SD |
|---|---|---|---|
| Black/African American | 501 | -0.14 | 1.05 |
| Asian/Pacific Islander | 87 | 0.21 | 0.92 |
| Native American | 14 | 0.06 | 0.87 |
| Other | 35 | -0.55 | 0.86 |
| NA | 1976 | 0.03 | 0.99 |
| NA | 140 | 0.08 | 1.00 |
| NA | 6 | 0.52 | 0.56 |
| Ethnicity | N | Mean | SD |
|---|---|---|---|
| Black/African American | 501 | -0.30 | 0.96 |
| Asian/Pacific Islander | 87 | 0.02 | 0.85 |
| Native American | 14 | 0.34 | 0.96 |
| Other | 35 | -0.34 | 1.01 |
| NA | 1976 | 0.09 | 1.01 |
| NA | 140 | -0.14 | 0.93 |
| NA | 6 | 0.06 | 0.80 |
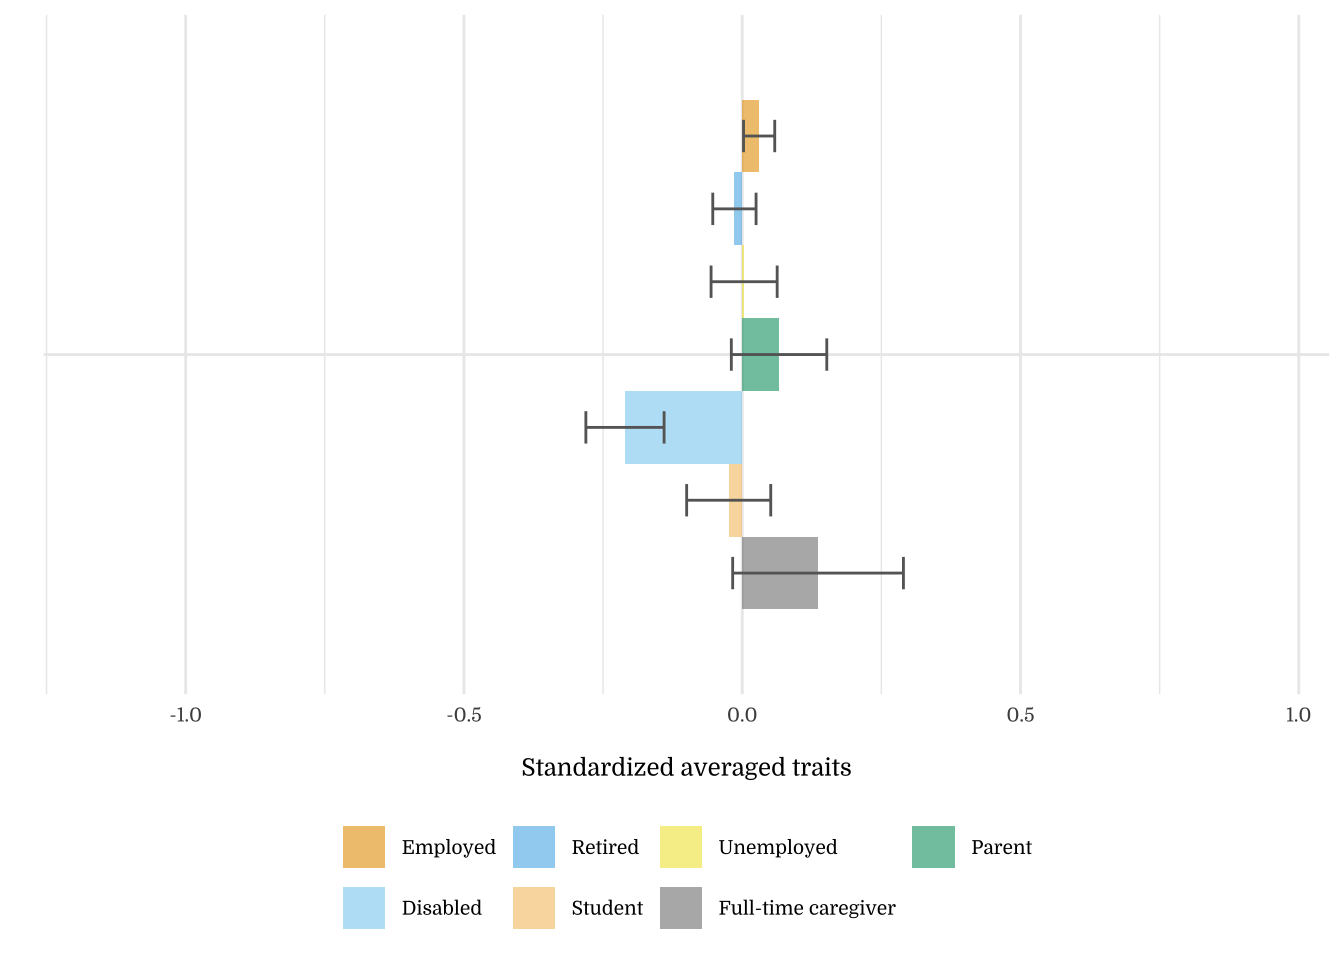
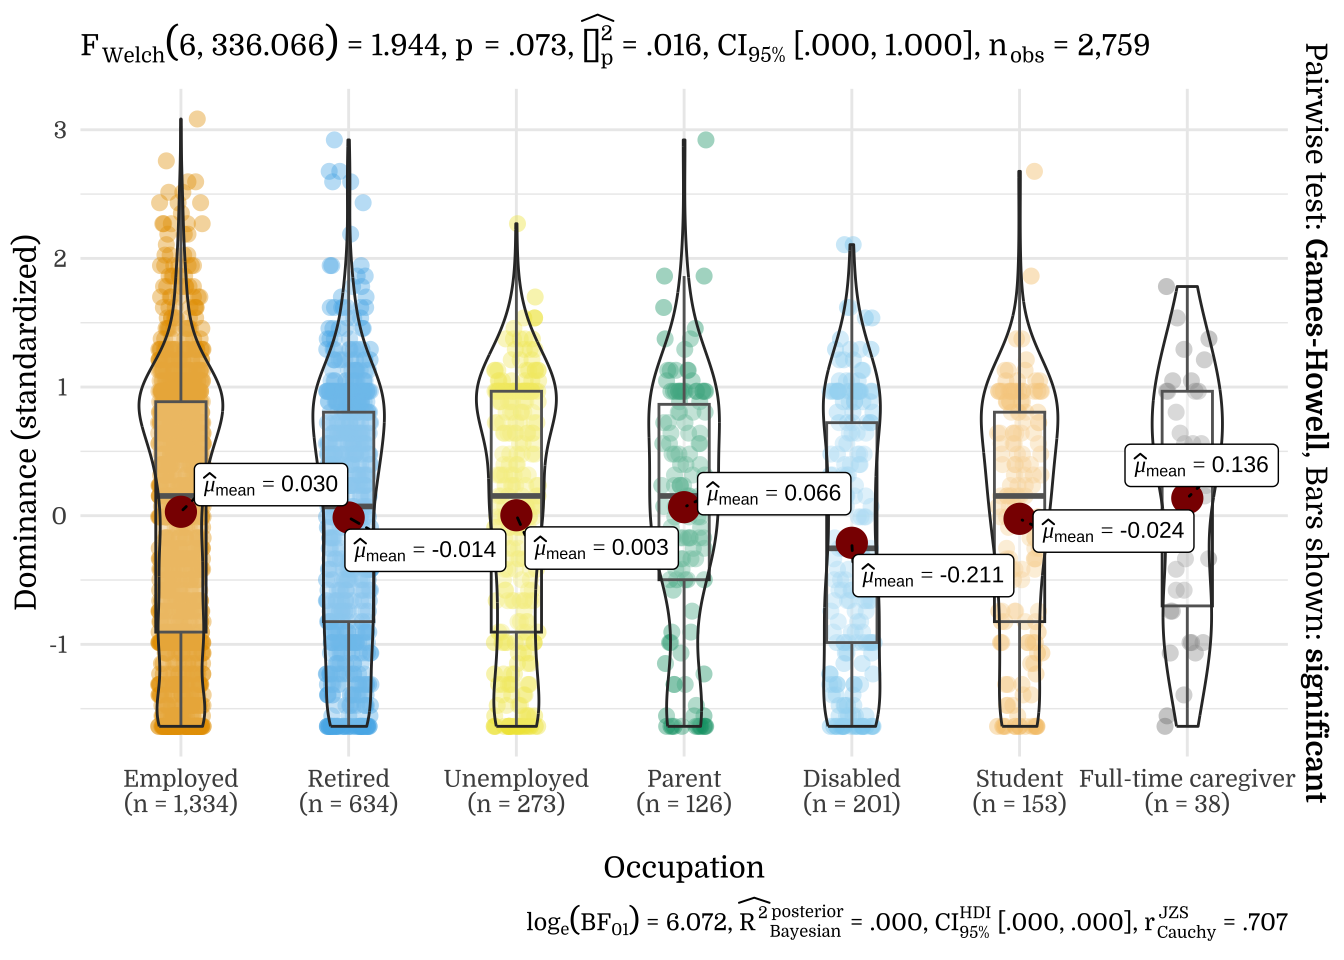
3.7 Occupation
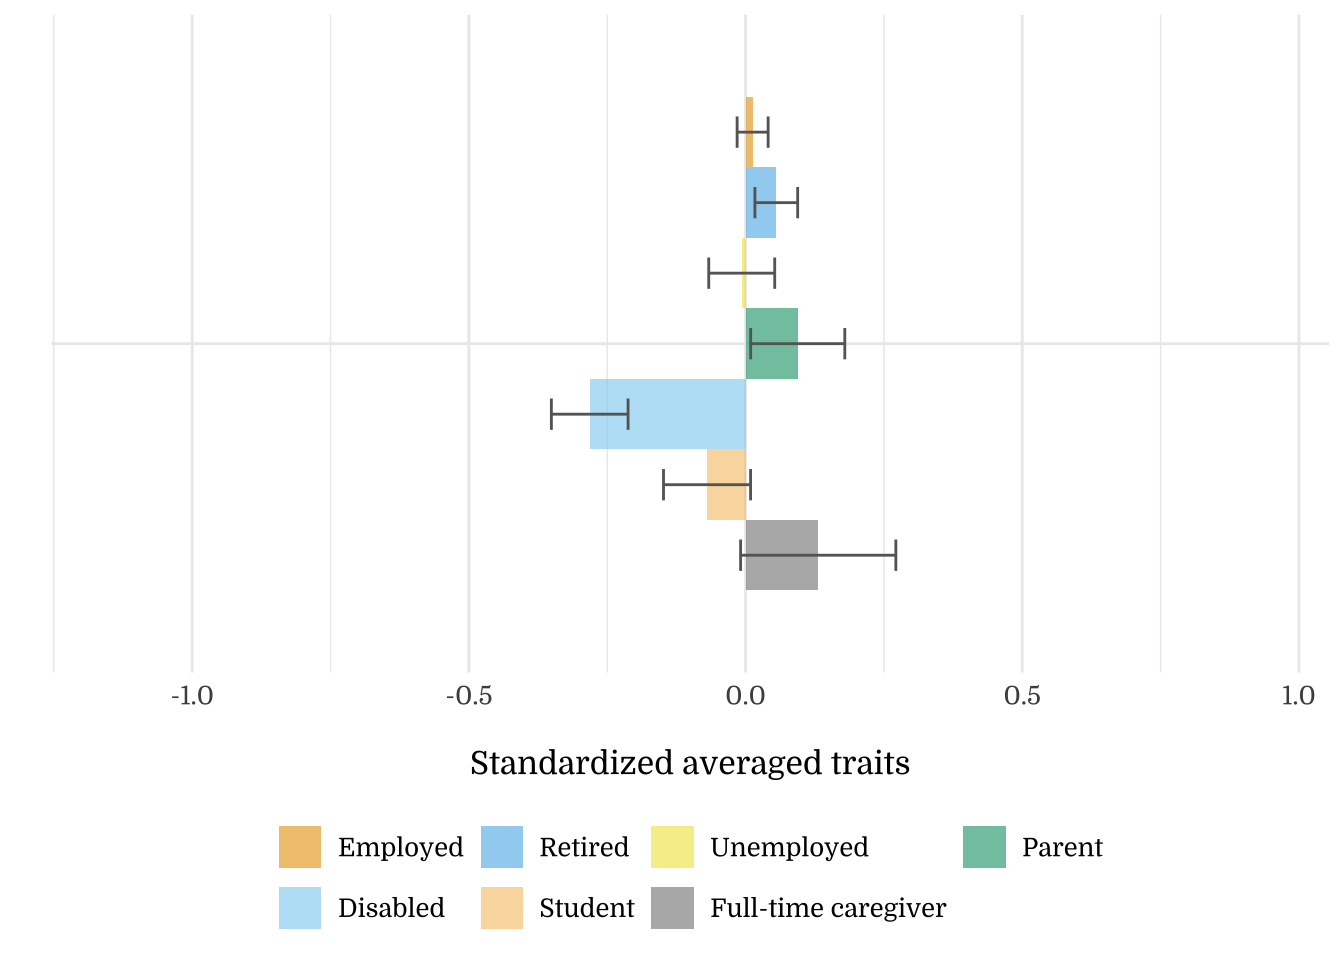
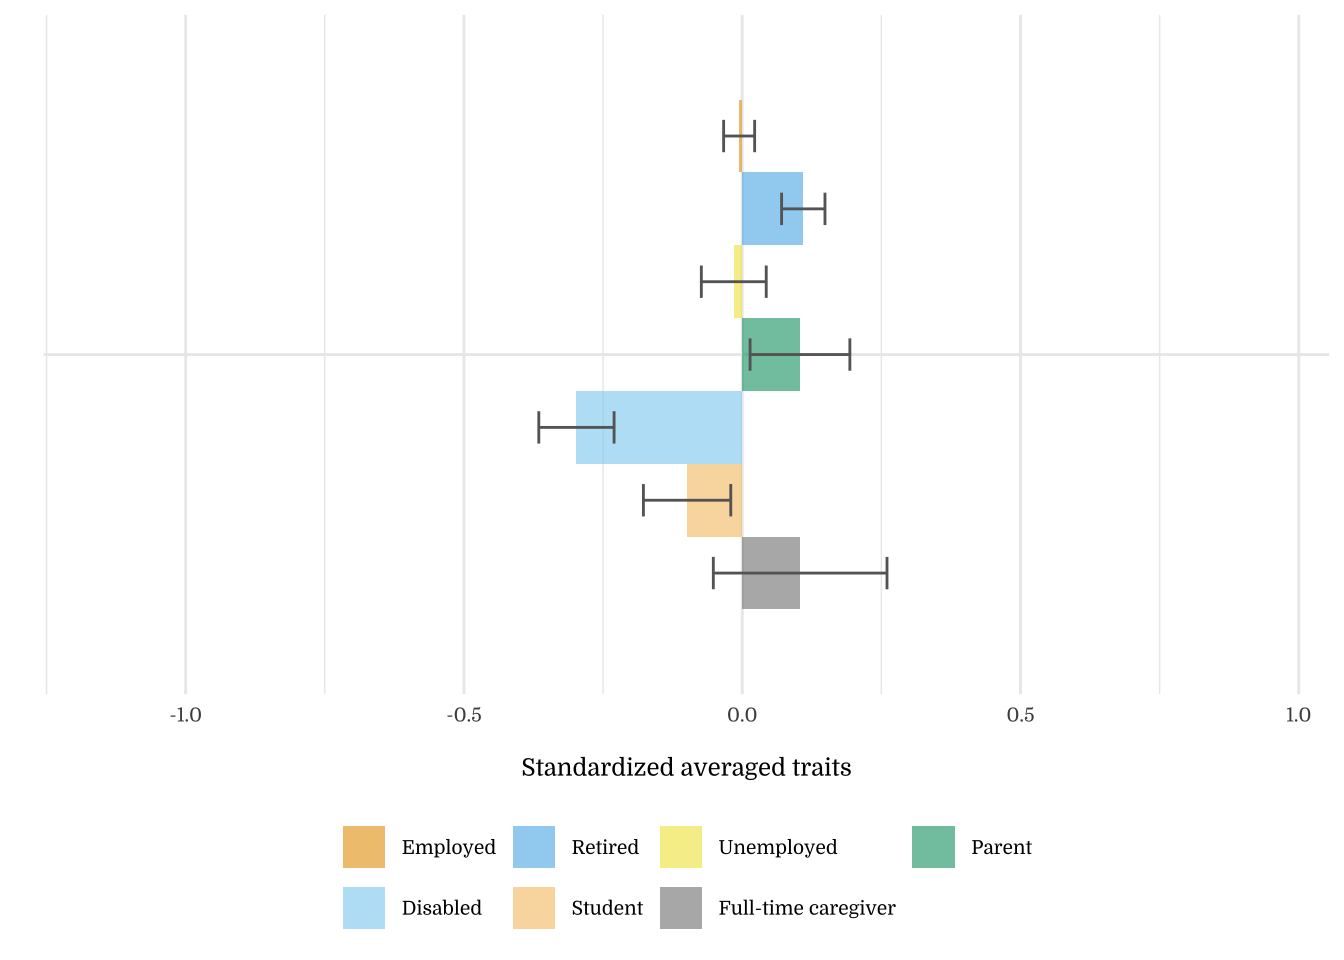
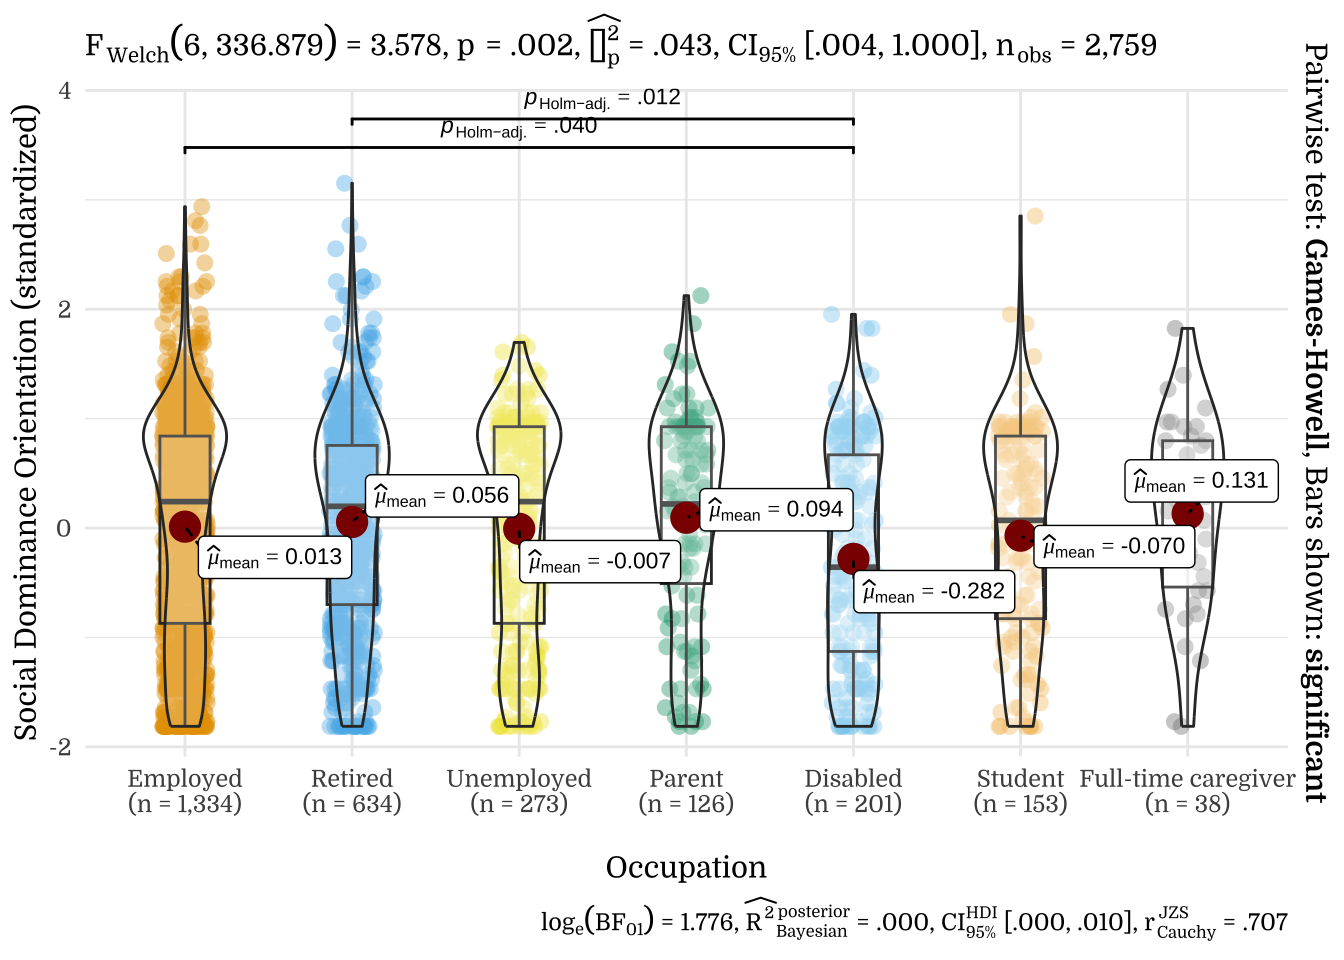
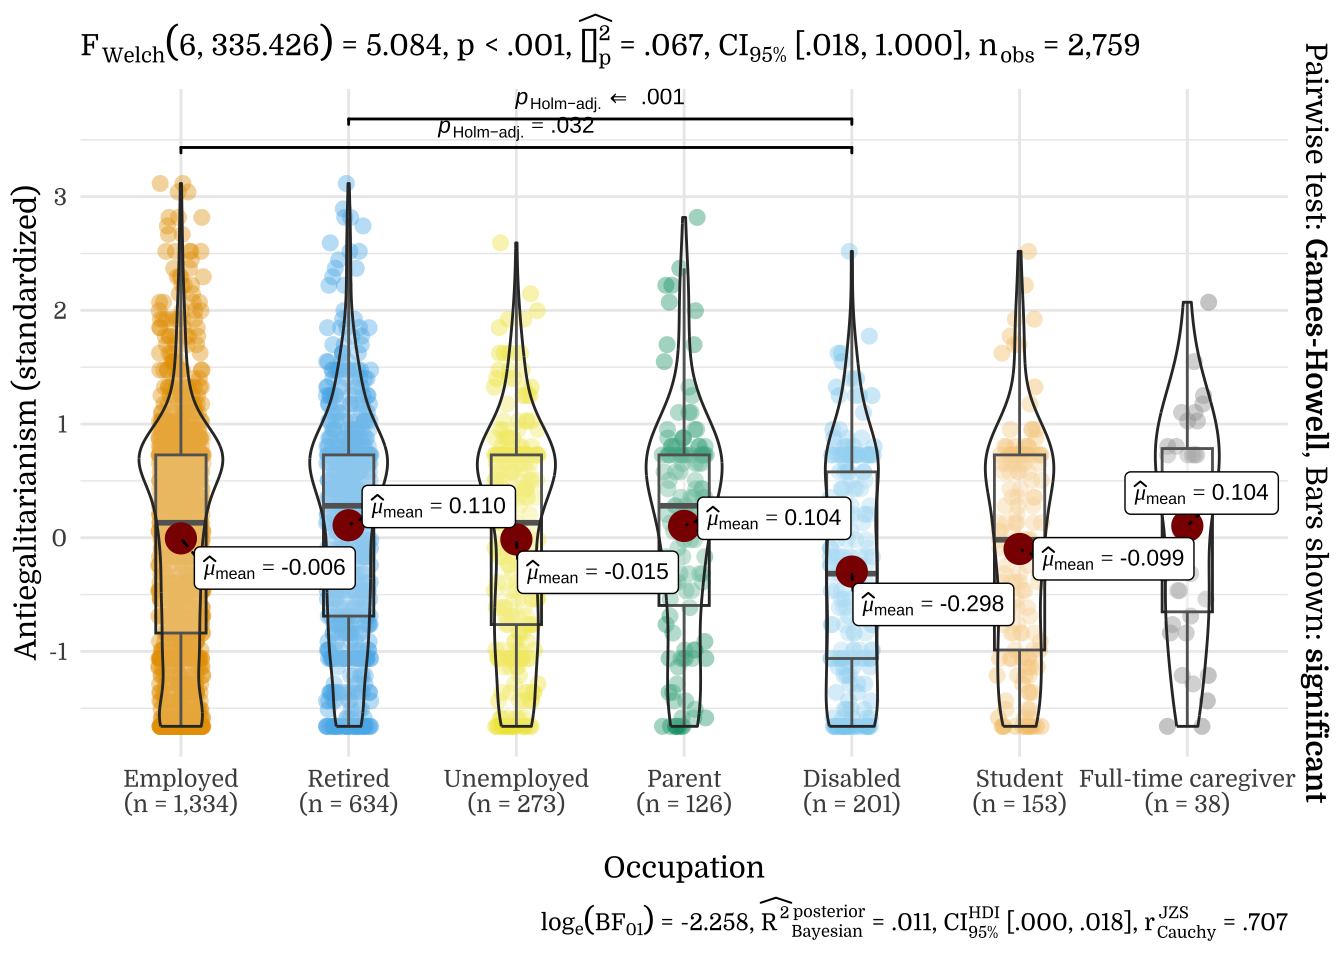
| Occupation | N | Mean | SD |
|---|---|---|---|
| Employed | 1334 | 0.03 | 1.02 |
| Retired | 634 | -0.01 | 0.98 |
| Unemployed | 273 | 0.00 | 0.98 |
| Parent | 126 | 0.07 | 0.96 |
| Disabled | 201 | -0.21 | 1.00 |
| Student | 153 | -0.02 | 0.93 |
| Full-time caregiver | 38 | 0.14 | 0.95 |
| Occupation | N | Mean | SD |
|---|---|---|---|
| Employed | 1334 | -0.01 | 1.02 |
| Retired | 634 | 0.11 | 0.98 |
| Unemployed | 273 | -0.02 | 0.96 |
| Parent | 126 | 0.10 | 1.01 |
| Disabled | 201 | -0.30 | 0.96 |
| Student | 153 | -0.10 | 0.97 |
| Full-time caregiver | 38 | 0.10 | 0.96 |
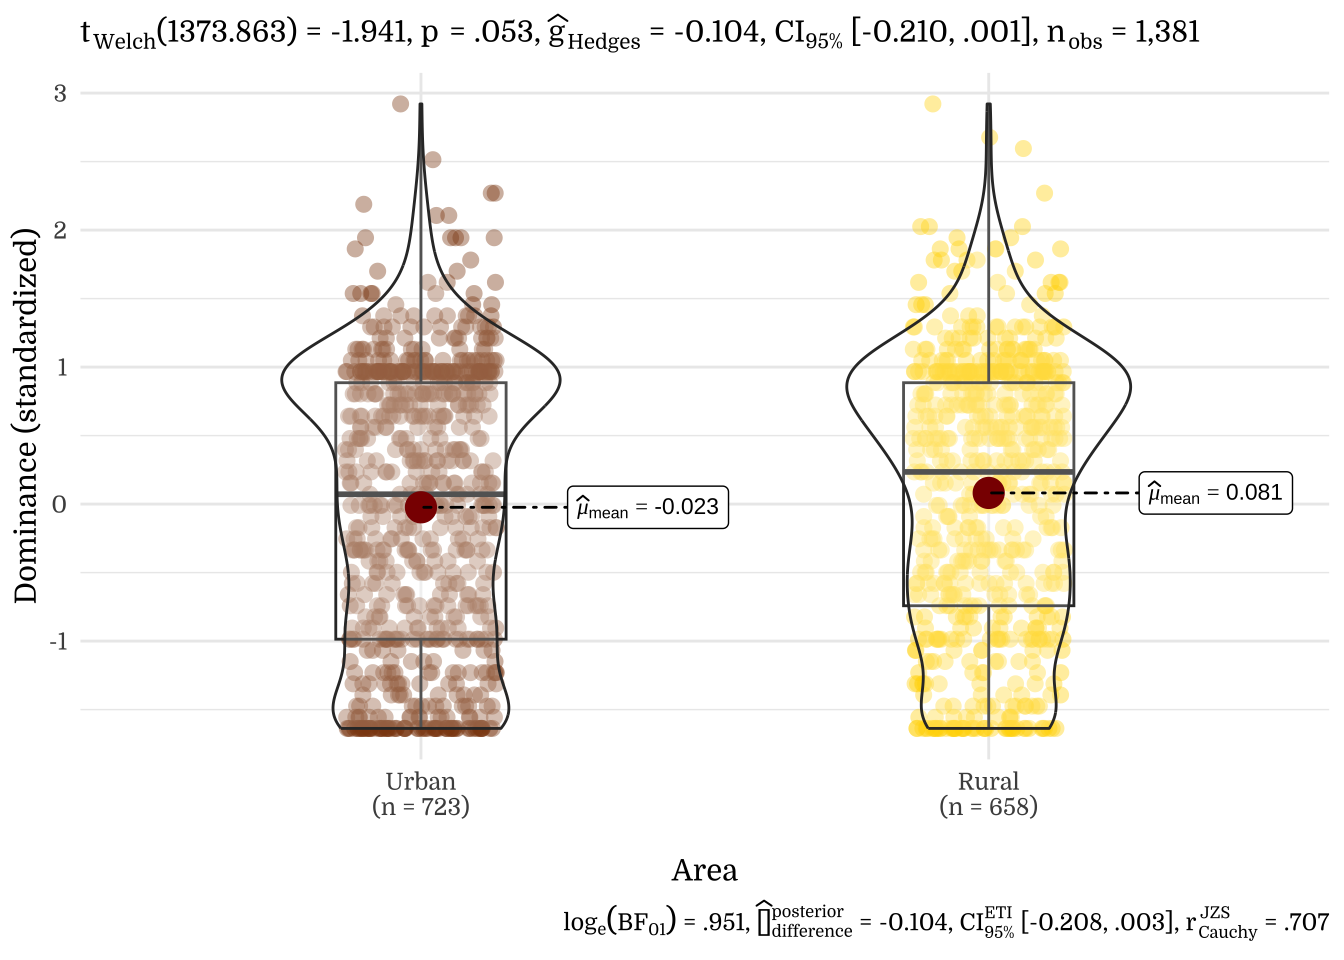
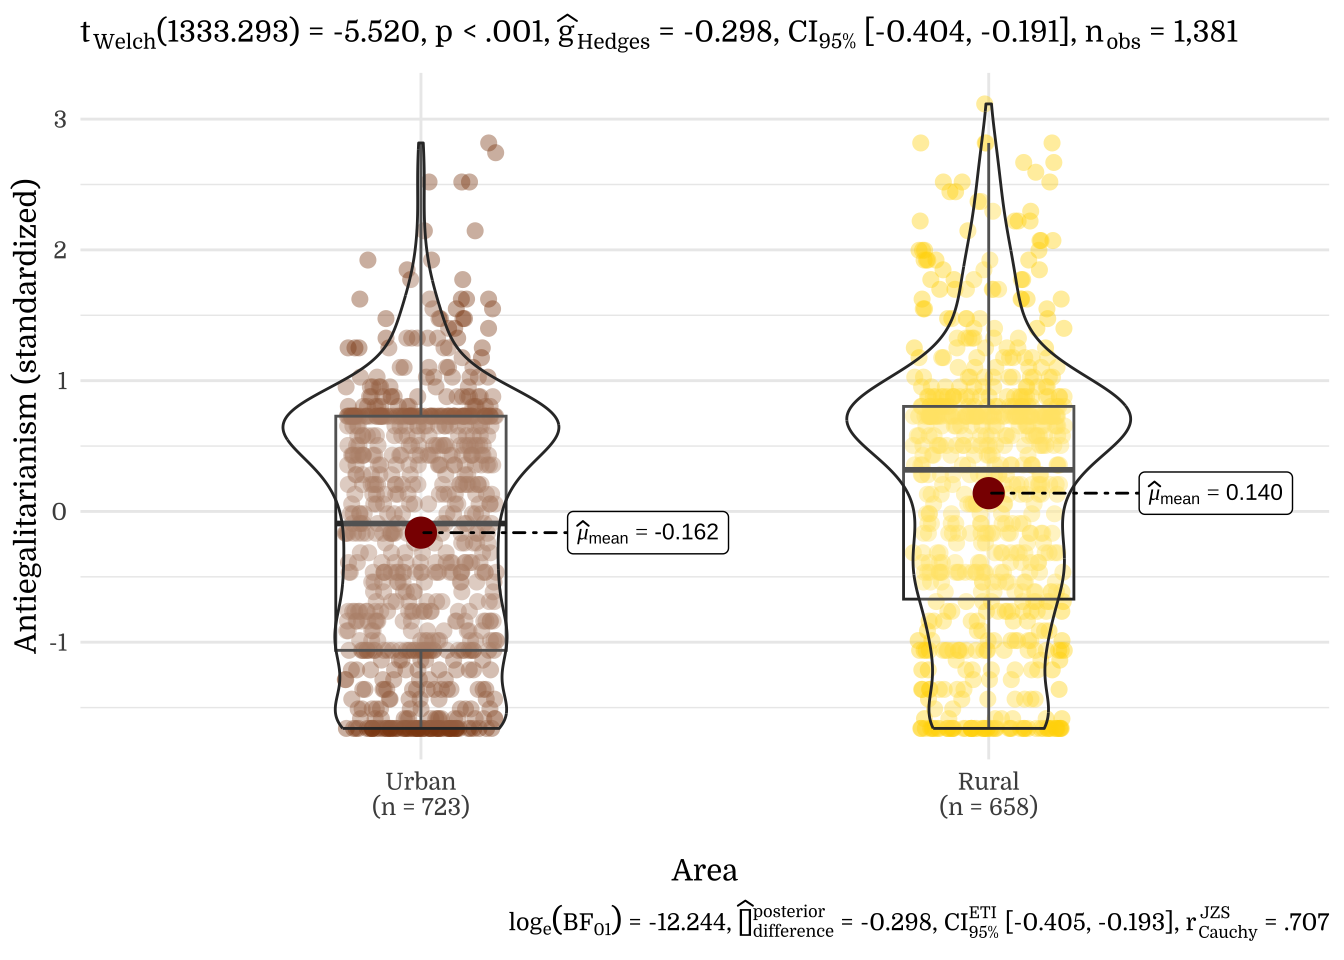
3.8 Area
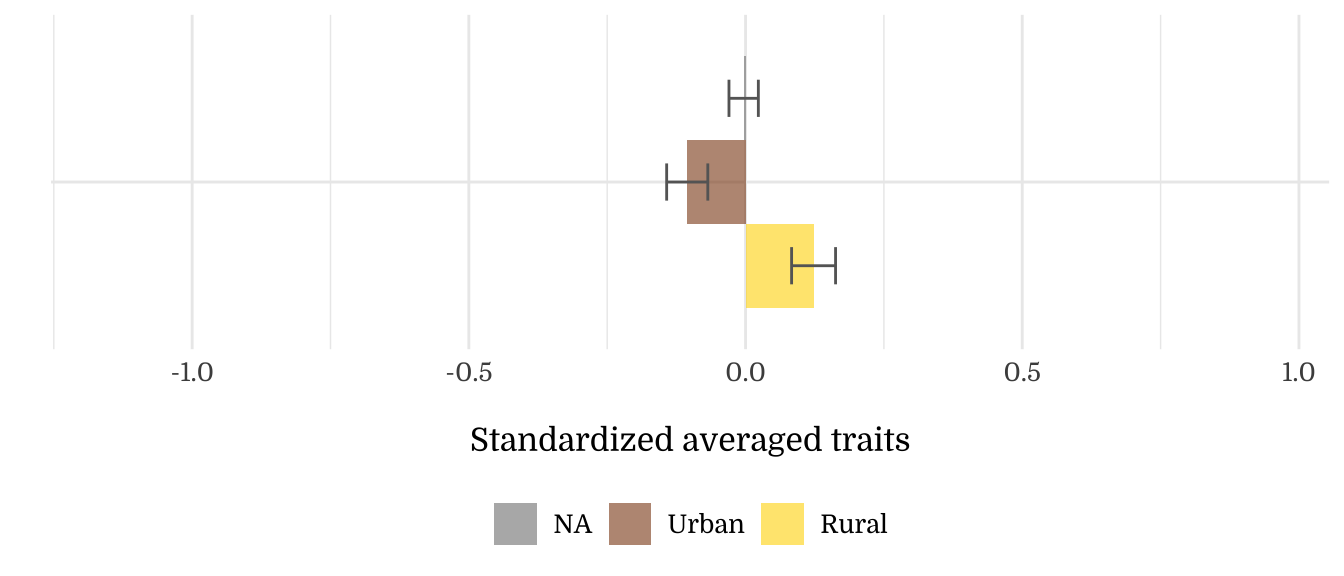
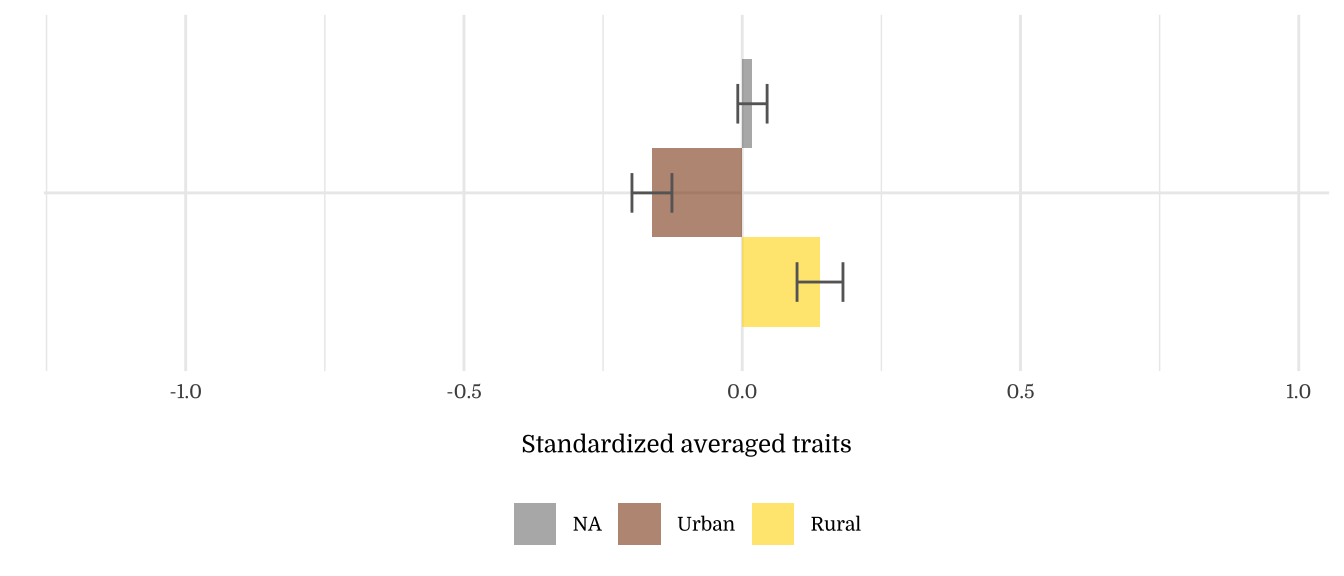
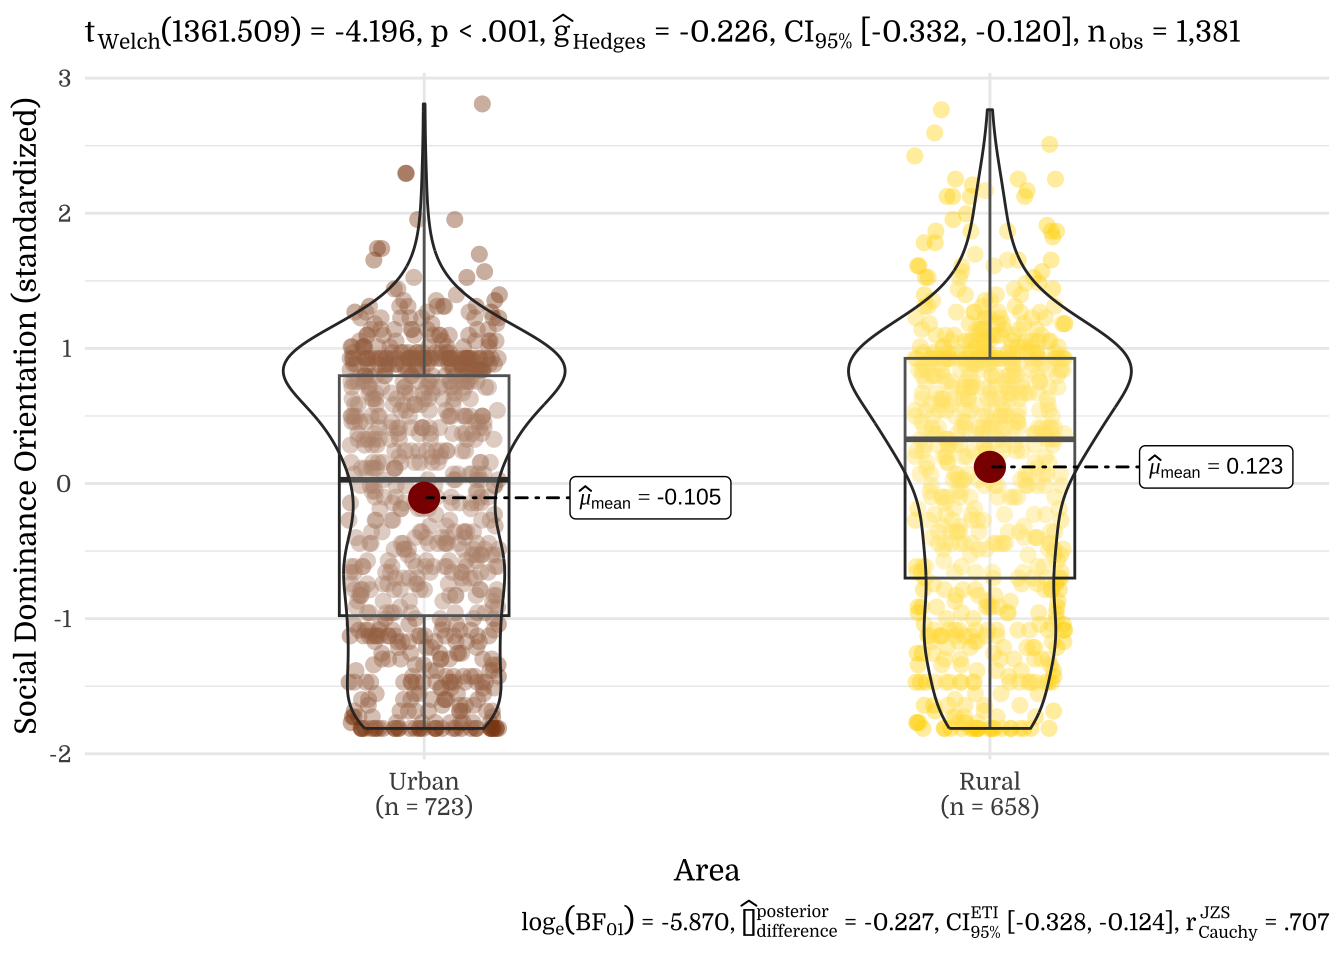
| Area | N | Mean | SD |
|---|---|---|---|
| Urban | 723 | -0.02 | 1.02 |
| Rural | 658 | 0.08 | 0.99 |
| NA | 1378 | -0.03 | 0.99 |
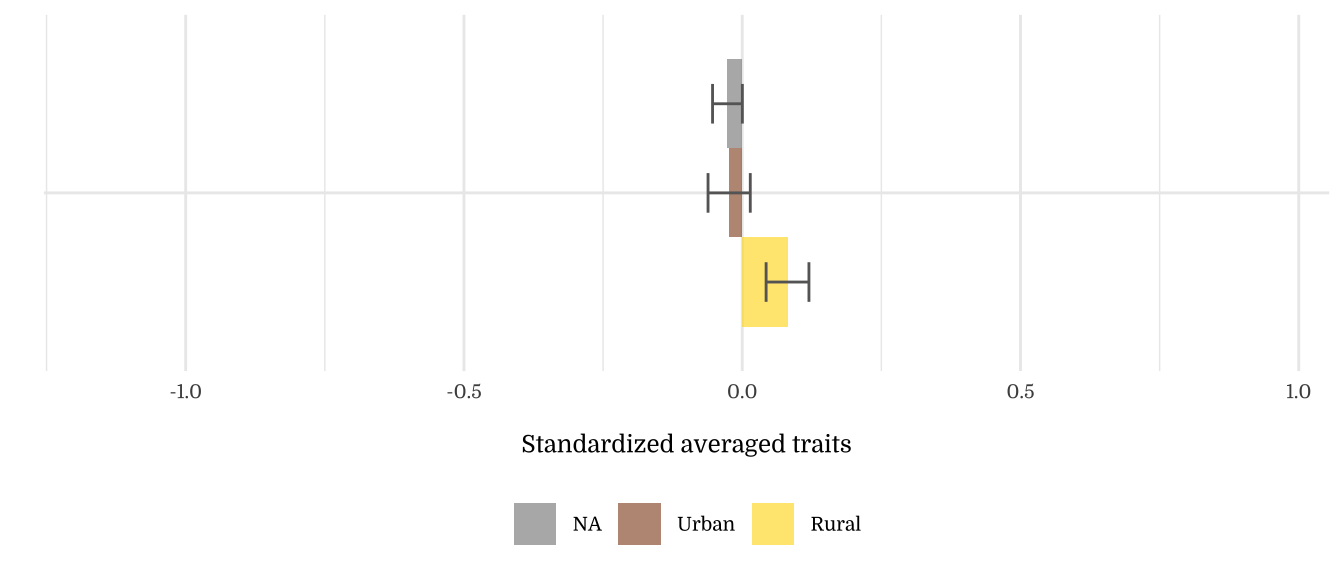
| Area | N | Mean | SD |
|---|---|---|---|
| Urban | 723 | -0.16 | 0.97 |
| Rural | 658 | 0.14 | 1.06 |
| NA | 1378 | 0.02 | 0.98 |
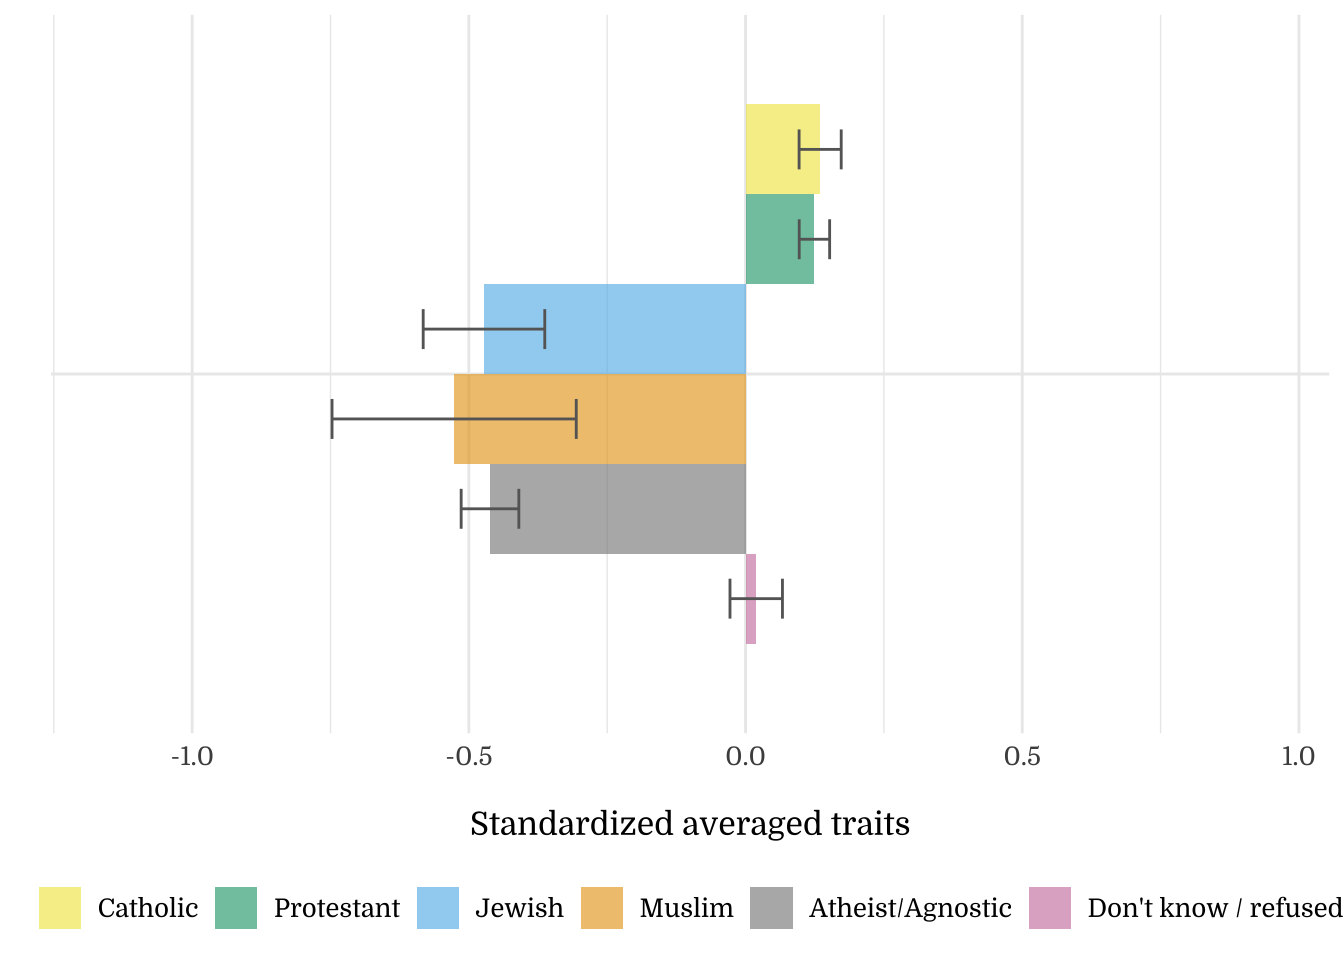
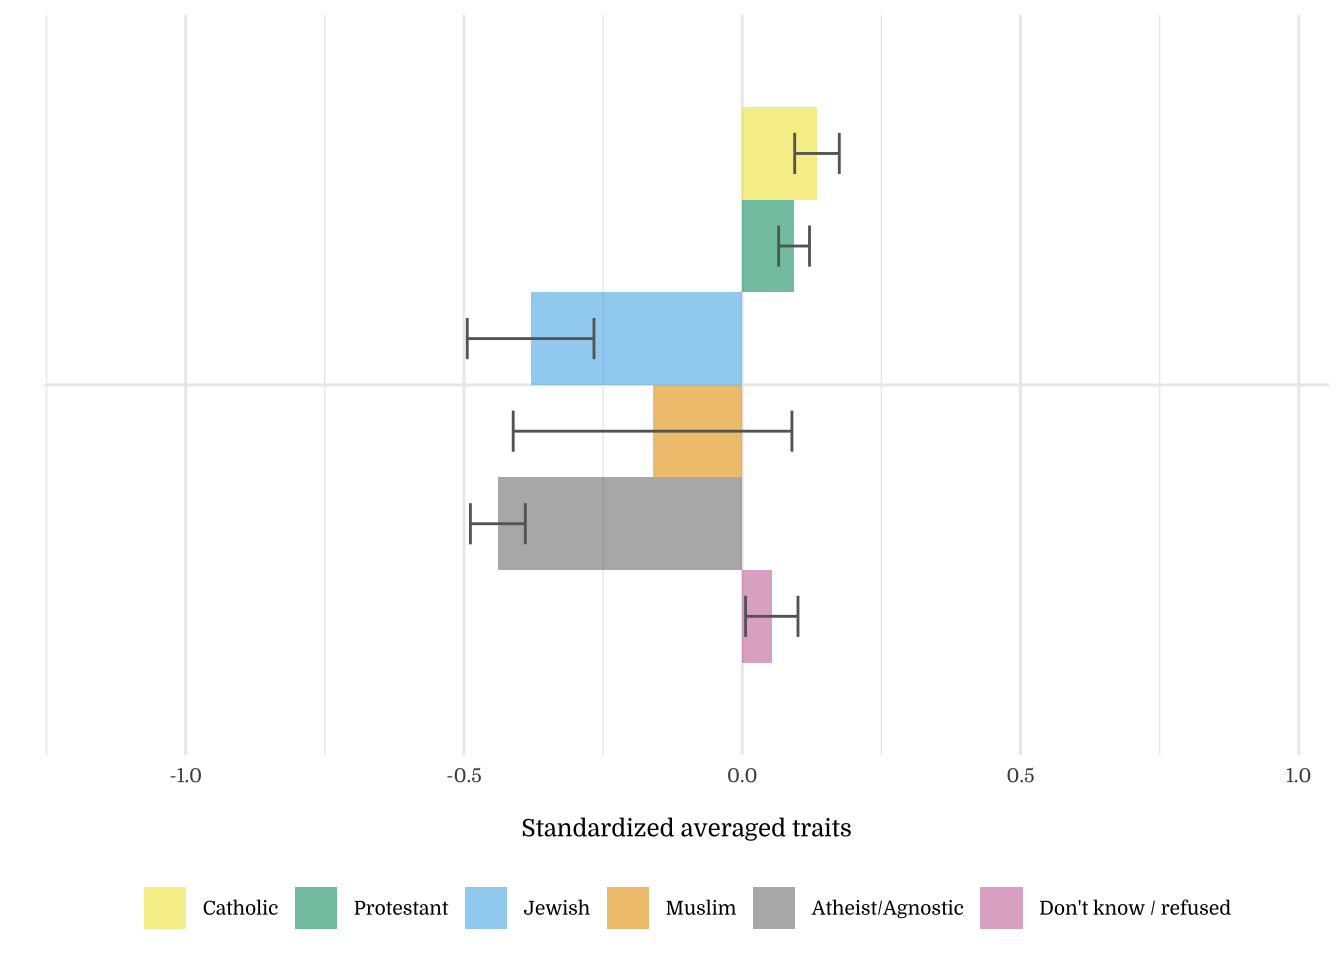
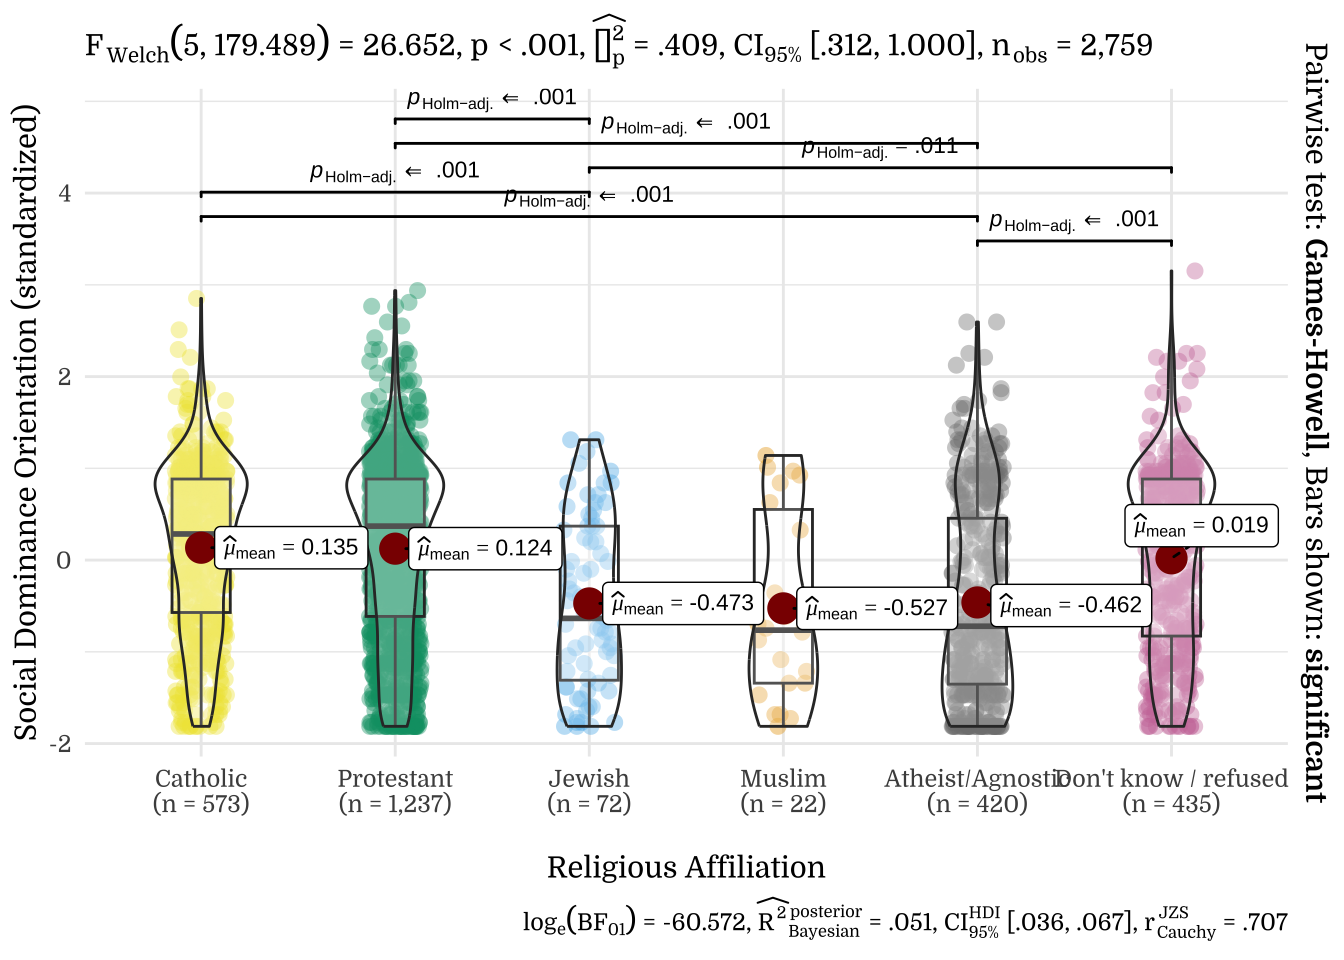
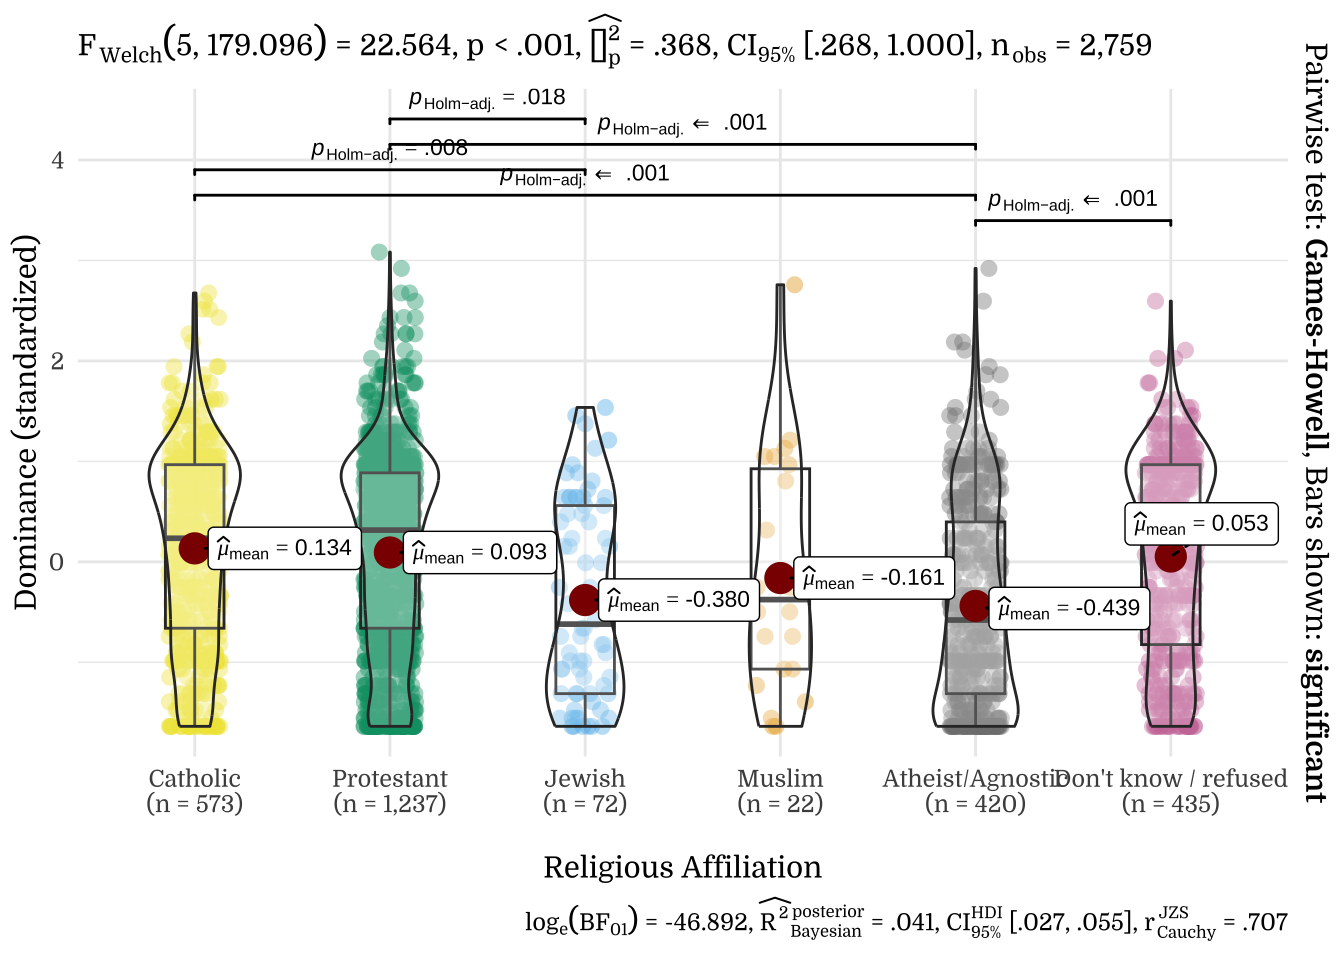
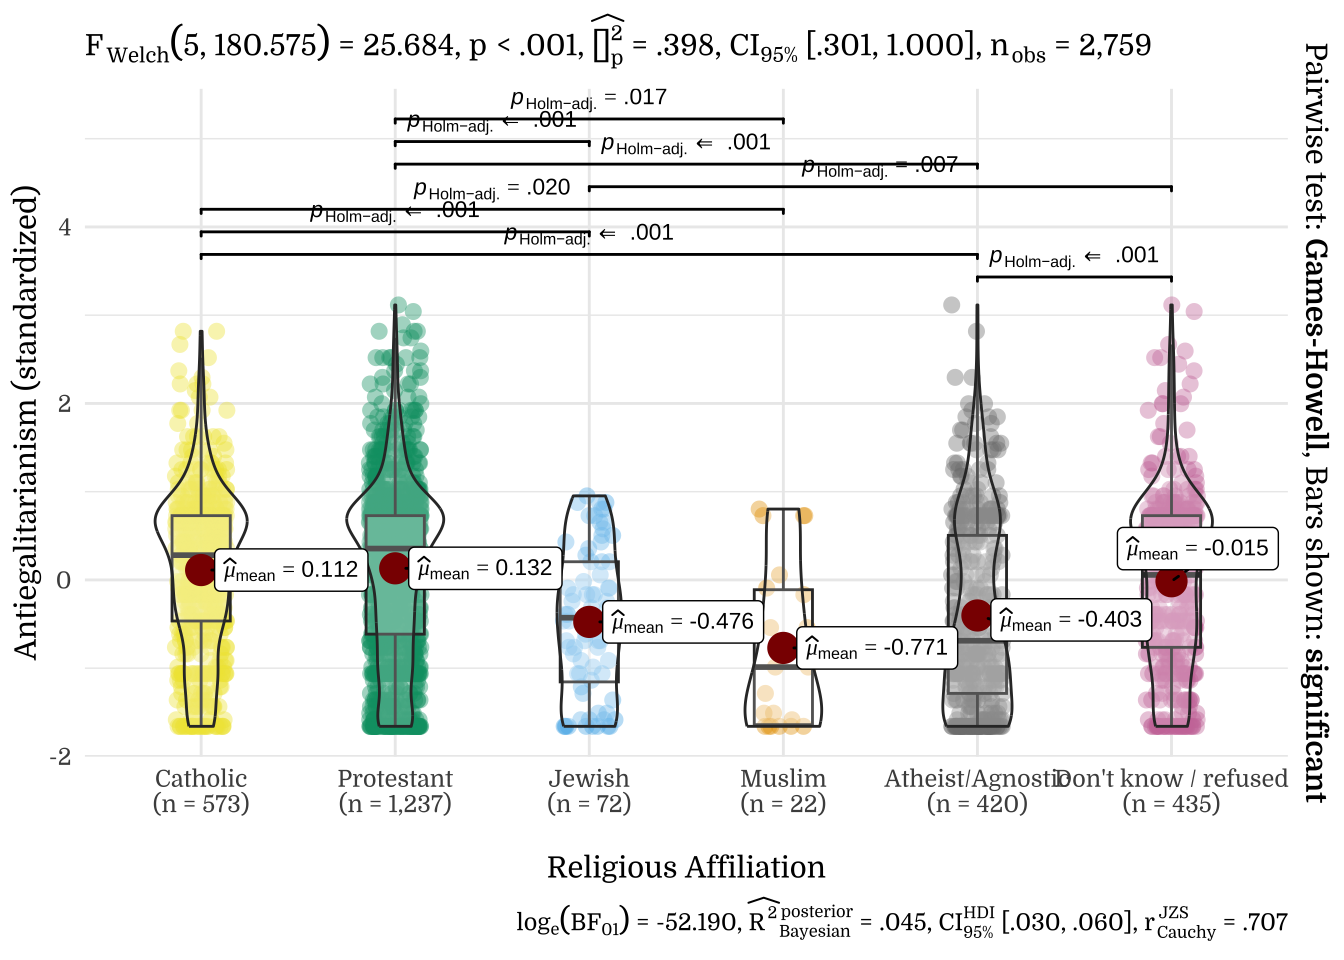
3.9 Religious Affiliation
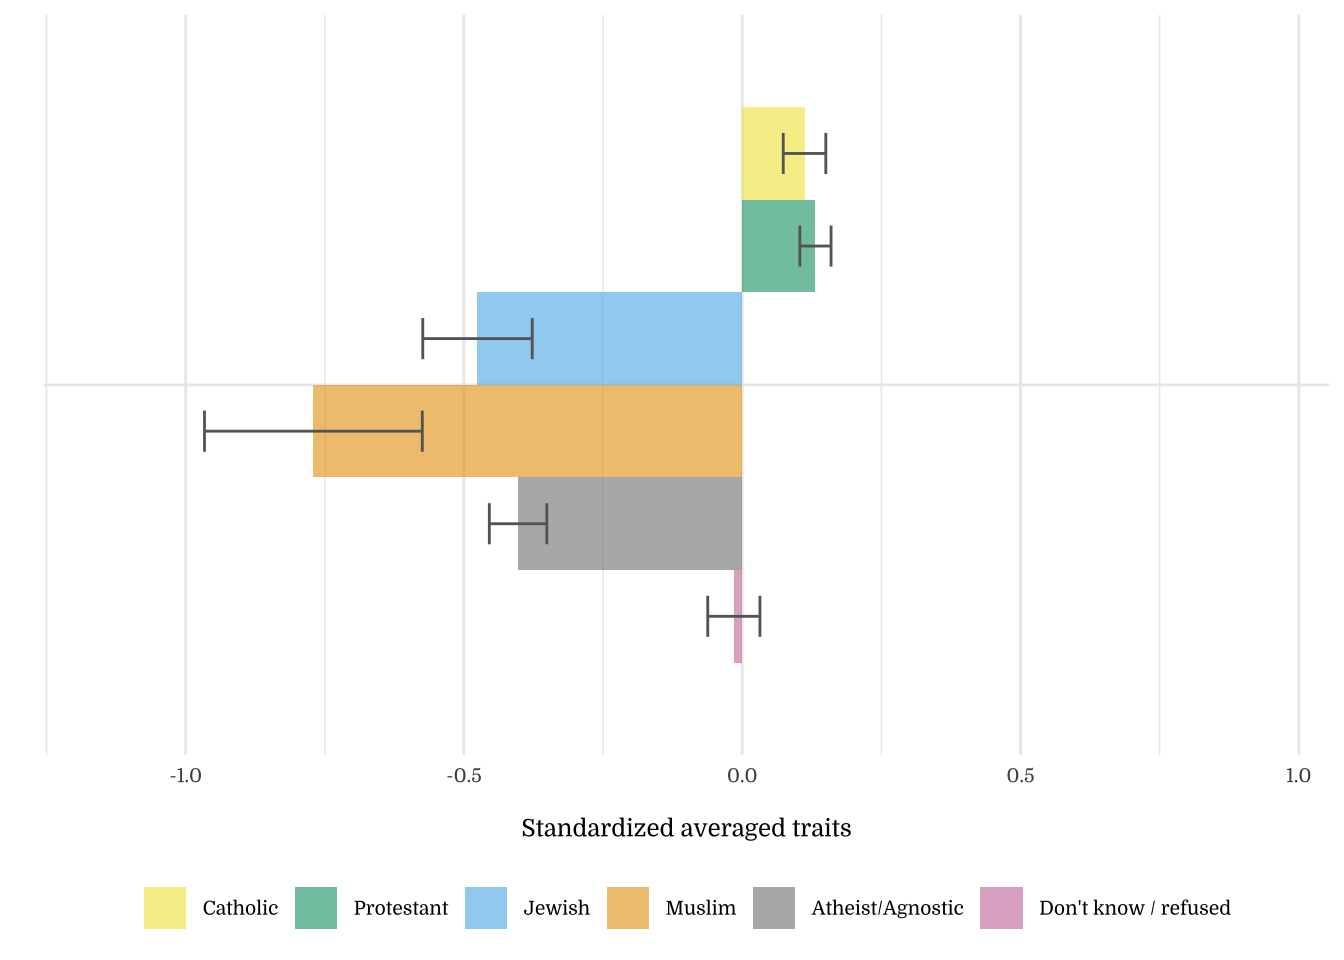
| Religious Affiliation | N | Mean | SD |
|---|---|---|---|
| Catholic | 573 | 0.13 | 0.96 |
| Protestant | 1237 | 0.09 | 0.98 |
| Jewish | 72 | -0.38 | 0.97 |
| Muslim | 22 | -0.16 | 1.17 |
| Atheist/Agnostic | 420 | -0.44 | 1.01 |
| Don't know / refused | 435 | 0.05 | 0.98 |
| Religious Affiliation | N | Mean | SD |
|---|---|---|---|
| Catholic | 573 | 0.11 | 0.92 |
| Protestant | 1237 | 0.13 | 0.99 |
| Jewish | 72 | -0.48 | 0.83 |
| Muslim | 22 | -0.77 | 0.92 |
| Atheist/Agnostic | 420 | -0.40 | 1.06 |
| Don't know / refused | 435 | -0.02 | 0.98 |
3.10 Section Summary
| Social Dominance Orientation | |||
|---|---|---|---|
| Predictors | Estimates | CI | p |
| (Intercept) | 3.27 | 3.02 – 3.53 | <.001 |
| Age | 0.06 | 0.02 – 0.09 | .001 |
| Income | 0.06 | 0.03 – 0.09 | <.001 |
| Education | -0.22 | -0.28 – -0.16 | <.001 |
| Gender (Male) | 0.33 | 0.22 – 0.44 | <.001 |
| Observations | 2759 | ||
| R2 / R2 adjusted | .038 / .037 | ||
4 Political Behavior
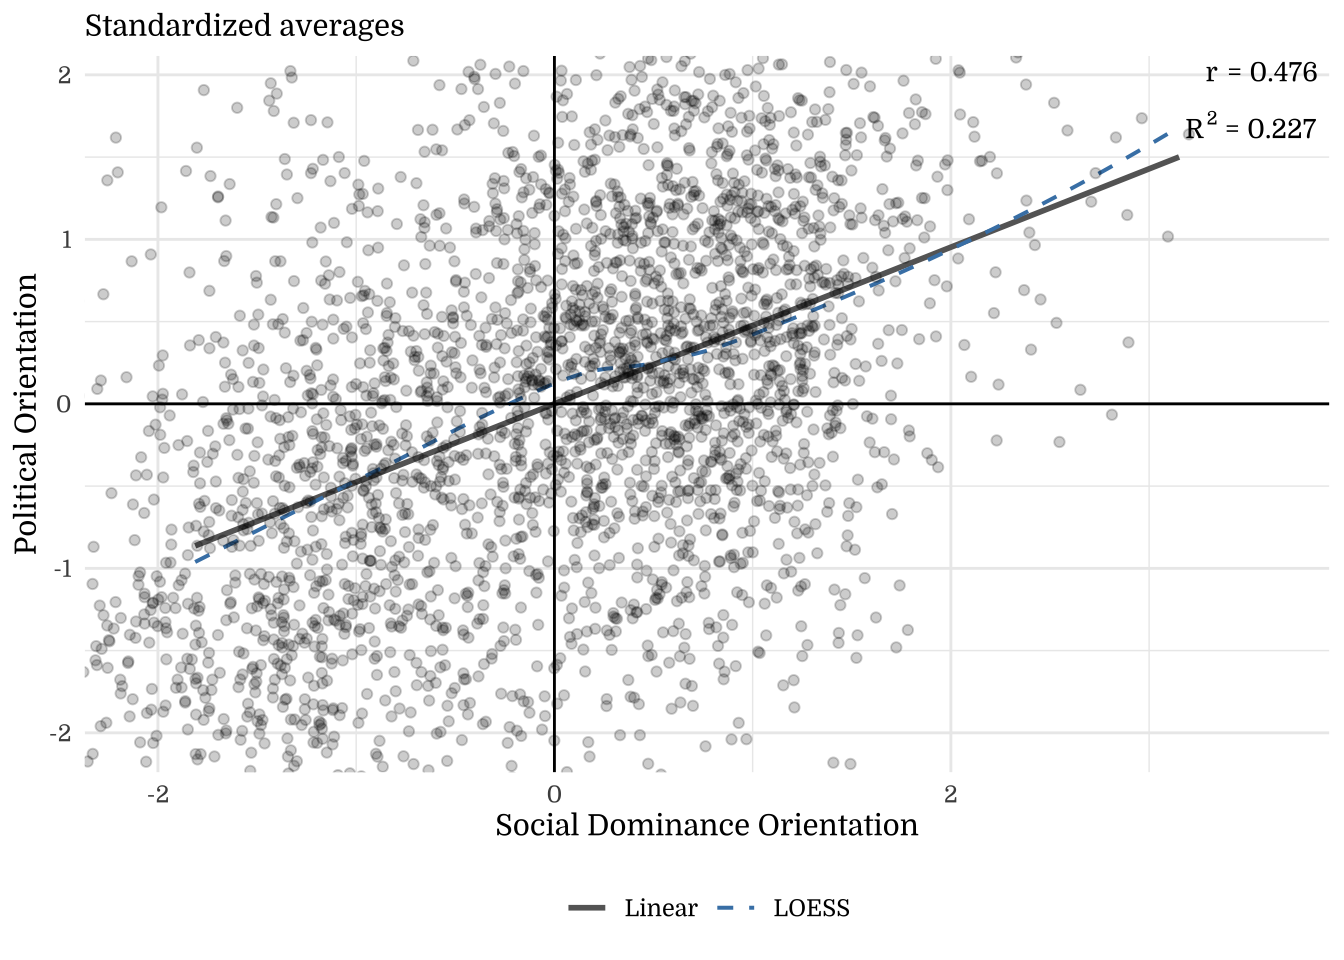
4.1 Political Orientation
Correlation with General Conservatism, Economic Conservatism, Social Conservatism
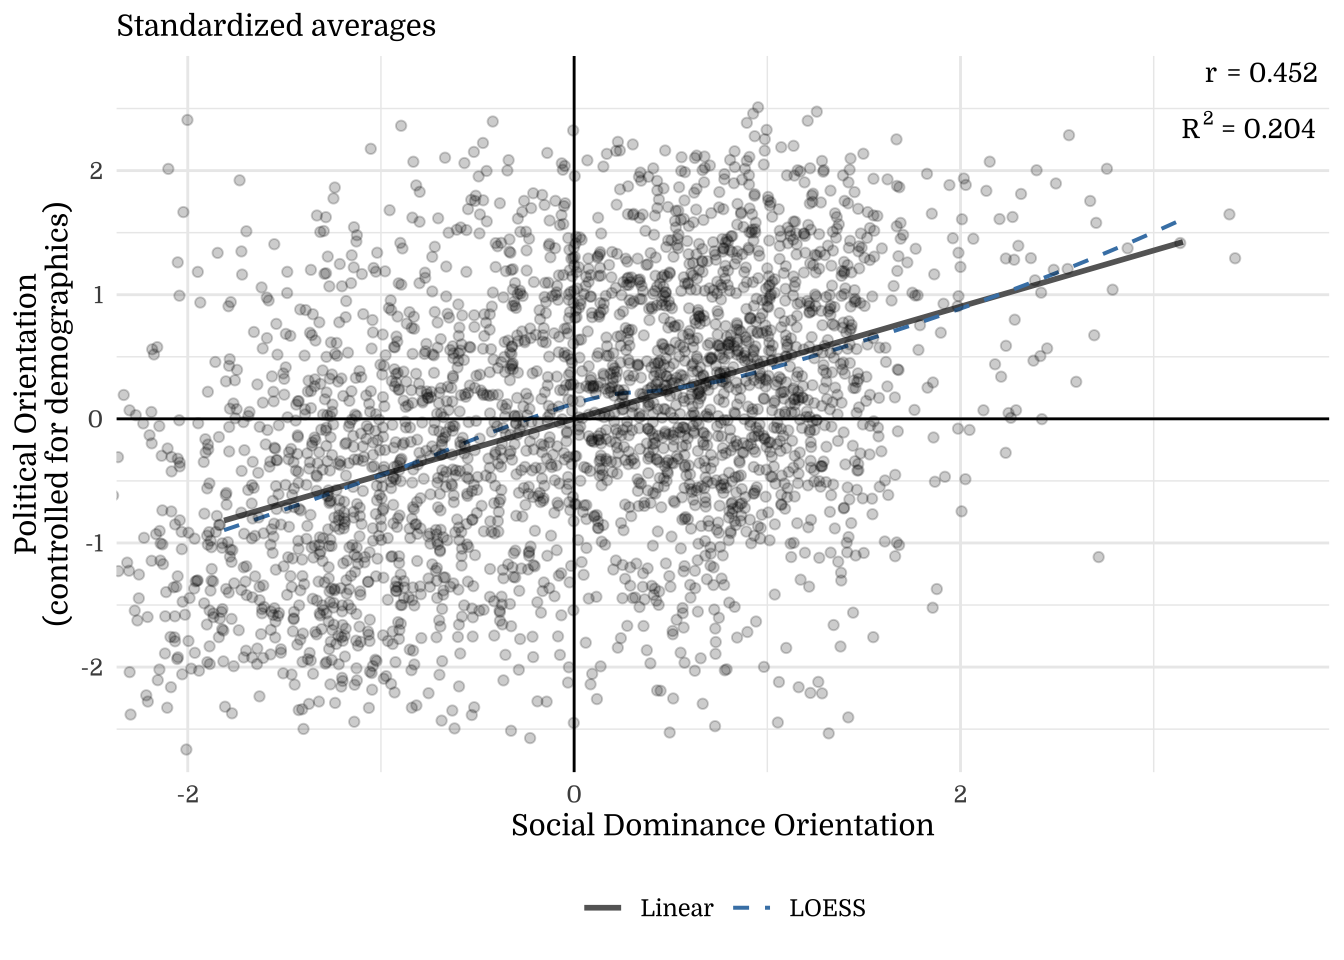
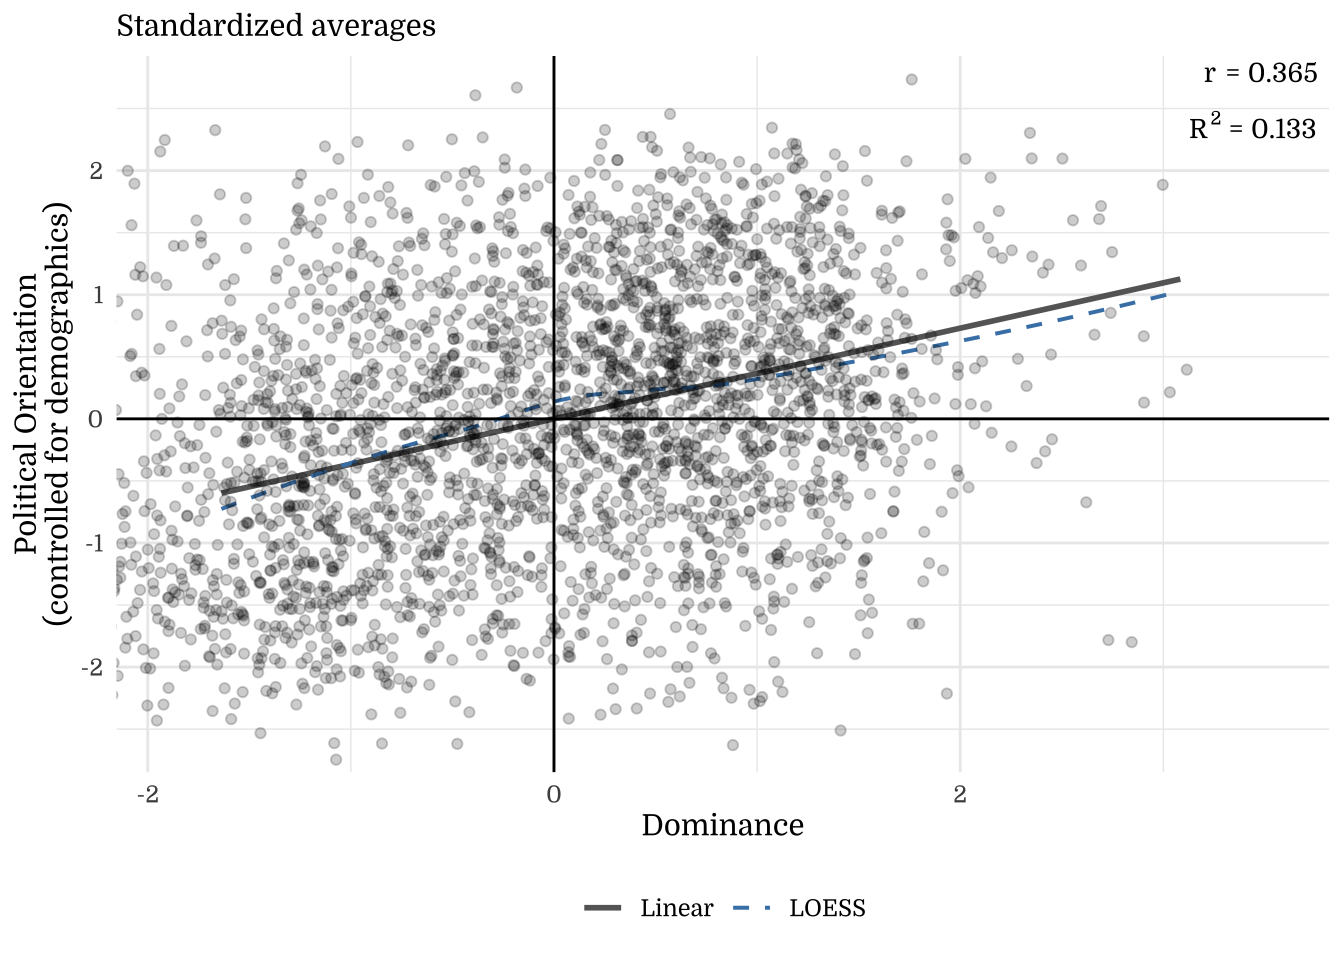
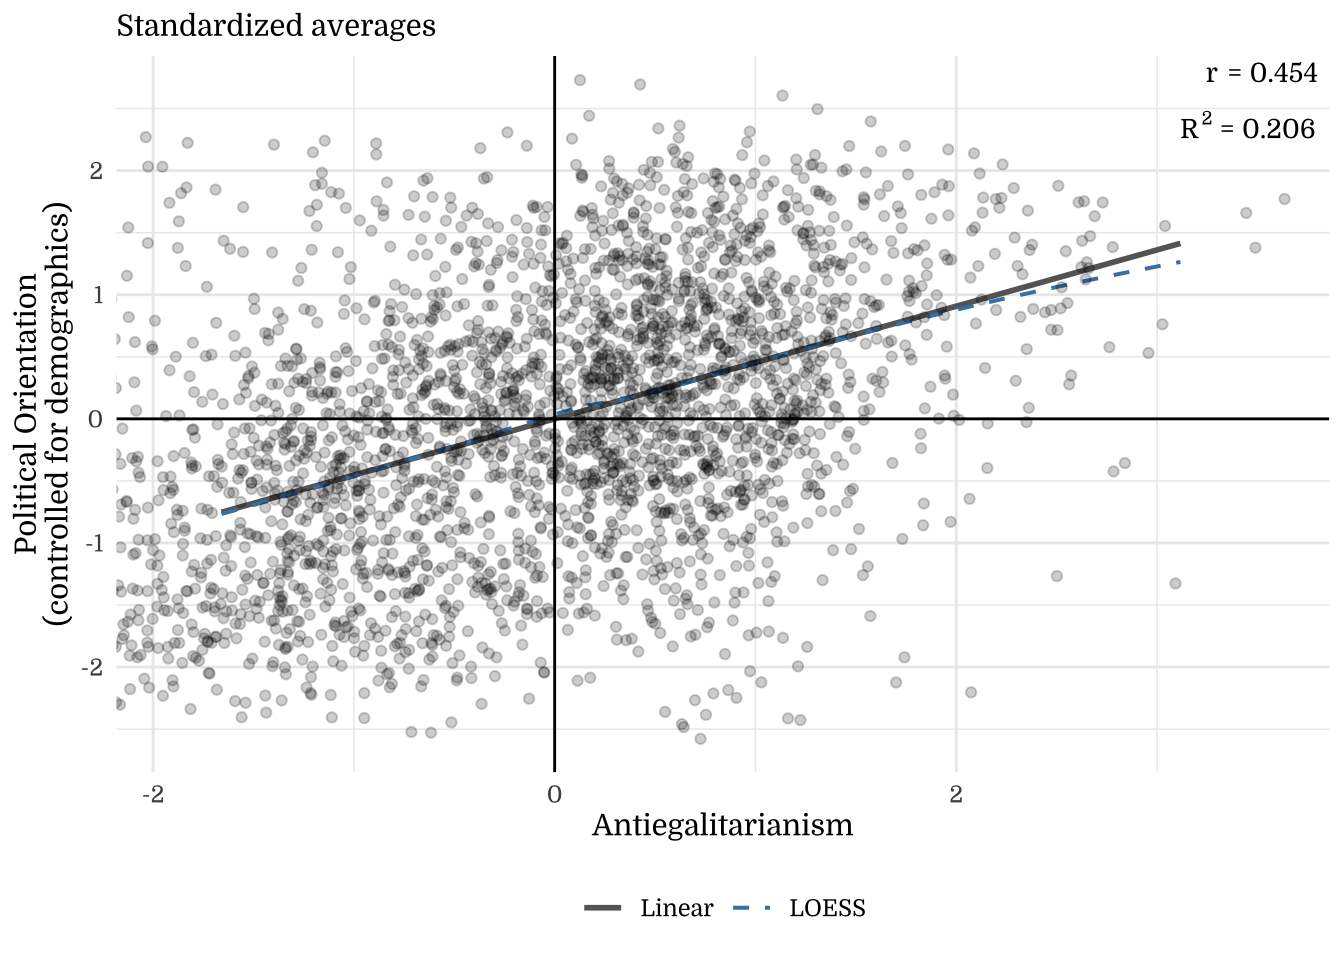
Note. The y-axis shows residuals after regressing the outcome on demographics (Age, Income, Education, Gender). This illustrates how much the focal construct explains beyond demographic factors.
| Political Orientation | Social Political Orientation | Economic Political Orientation | Composite Political Orientation | |||||||||
|---|---|---|---|---|---|---|---|---|---|---|---|---|
| Predictors | Estimates | CI | p | Estimates | CI | p | Estimates | CI | p | Estimates | CI | p |
| (Intercept) | 51.52 | 50.53 – 52.51 | <.001 | 49.15 | 48.07 – 50.22 | <.001 | 54.08 | 53.04 – 55.11 | <.001 | 51.58 | 50.63 – 52.53 | <.001 |
| Social Dominance Orientation | 13.60 | 12.61 – 14.59 | <.001 | 14.51 | 13.44 – 15.58 | <.001 | 13.39 | 12.35 – 14.42 | <.001 | 13.83 | 12.88 – 14.79 | <.001 |
| Observations | 2759 | 2759 | 2759 | 2759 | ||||||||
| R2 / R2 adjusted | .208 / .208 | .204 / .204 | .190 / .190 | .227 / .226 | ||||||||
| Political Orientation | Social Political Orientation | Economic Political Orientation | Composite Political Orientation | |||||||||
|---|---|---|---|---|---|---|---|---|---|---|---|---|
| Predictors | Estimates | CI | p | Estimates | CI | p | Estimates | CI | p | Estimates | CI | p |
| (Intercept) | 51.52 | 50.49 – 52.56 | <.001 | 49.15 | 48.03 – 50.26 | <.001 | 54.08 | 53.00 – 55.16 | <.001 | 51.58 | 50.58 – 52.58 | <.001 |
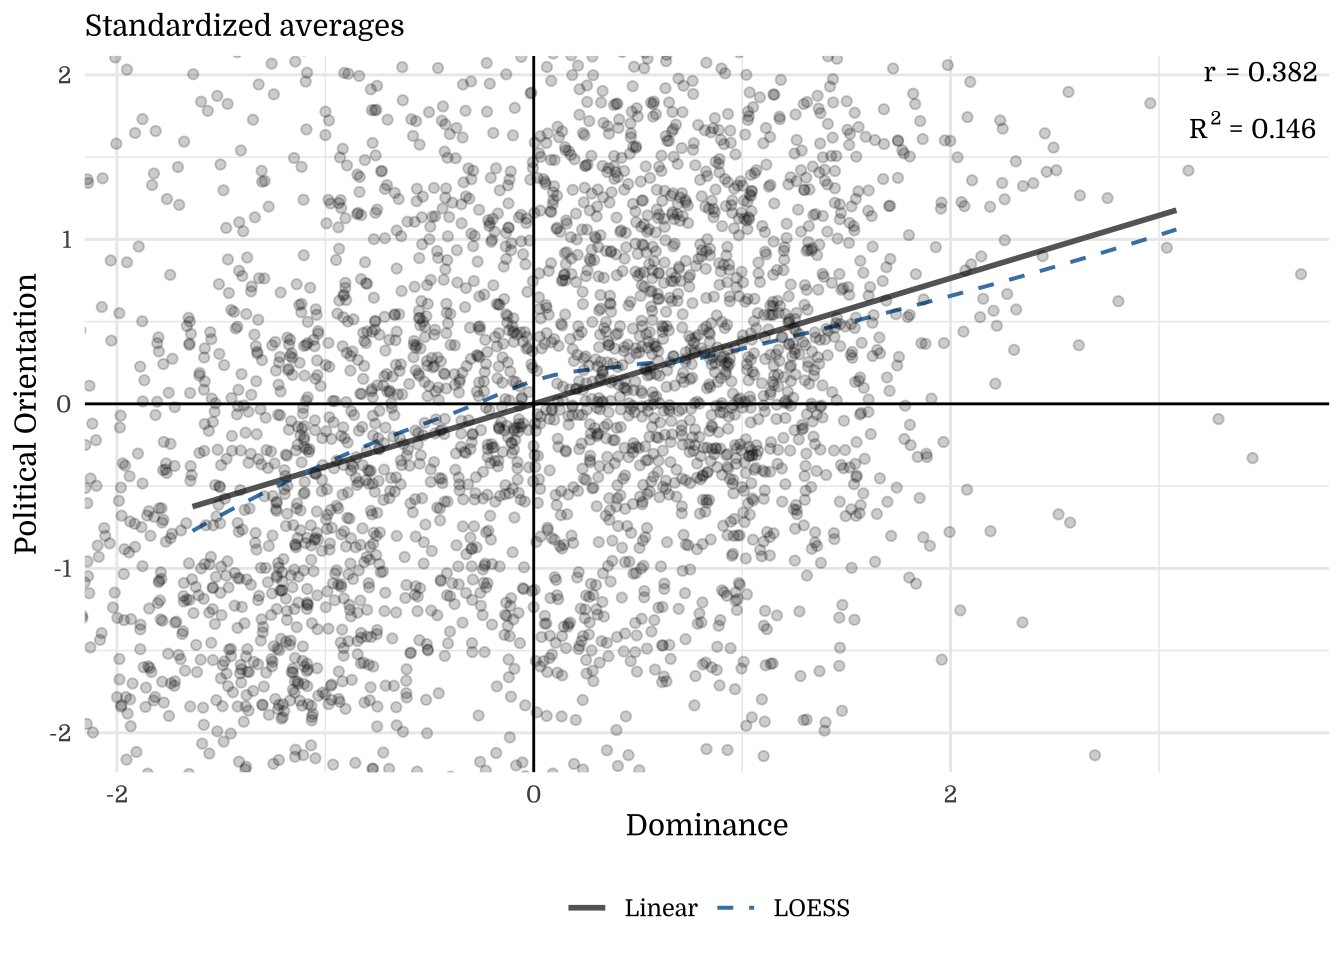
| Dominance | 11.00 | 9.97 – 12.04 | <.001 | 11.98 | 10.86 – 13.09 | <.001 | 10.29 | 9.21 – 11.37 | <.001 | 11.09 | 10.09 – 12.09 | <.001 |
| Observations | 2759 | 2759 | 2759 | 2759 | ||||||||
| R2 / R2 adjusted | .136 / .136 | .139 / .139 | .112 / .112 | .146 / .145 | ||||||||
| Political Orientation | Social Political Orientation | Economic Political Orientation | Composite Political Orientation | |||||||||
|---|---|---|---|---|---|---|---|---|---|---|---|---|
| Predictors | Estimates | CI | p | Estimates | CI | p | Estimates | CI | p | Estimates | CI | p |
| (Intercept) | 51.52 | 50.53 – 52.51 | <.001 | 49.15 | 48.07 – 50.22 | <.001 | 54.08 | 53.05 – 55.10 | <.001 | 51.58 | 50.63 – 52.53 | <.001 |
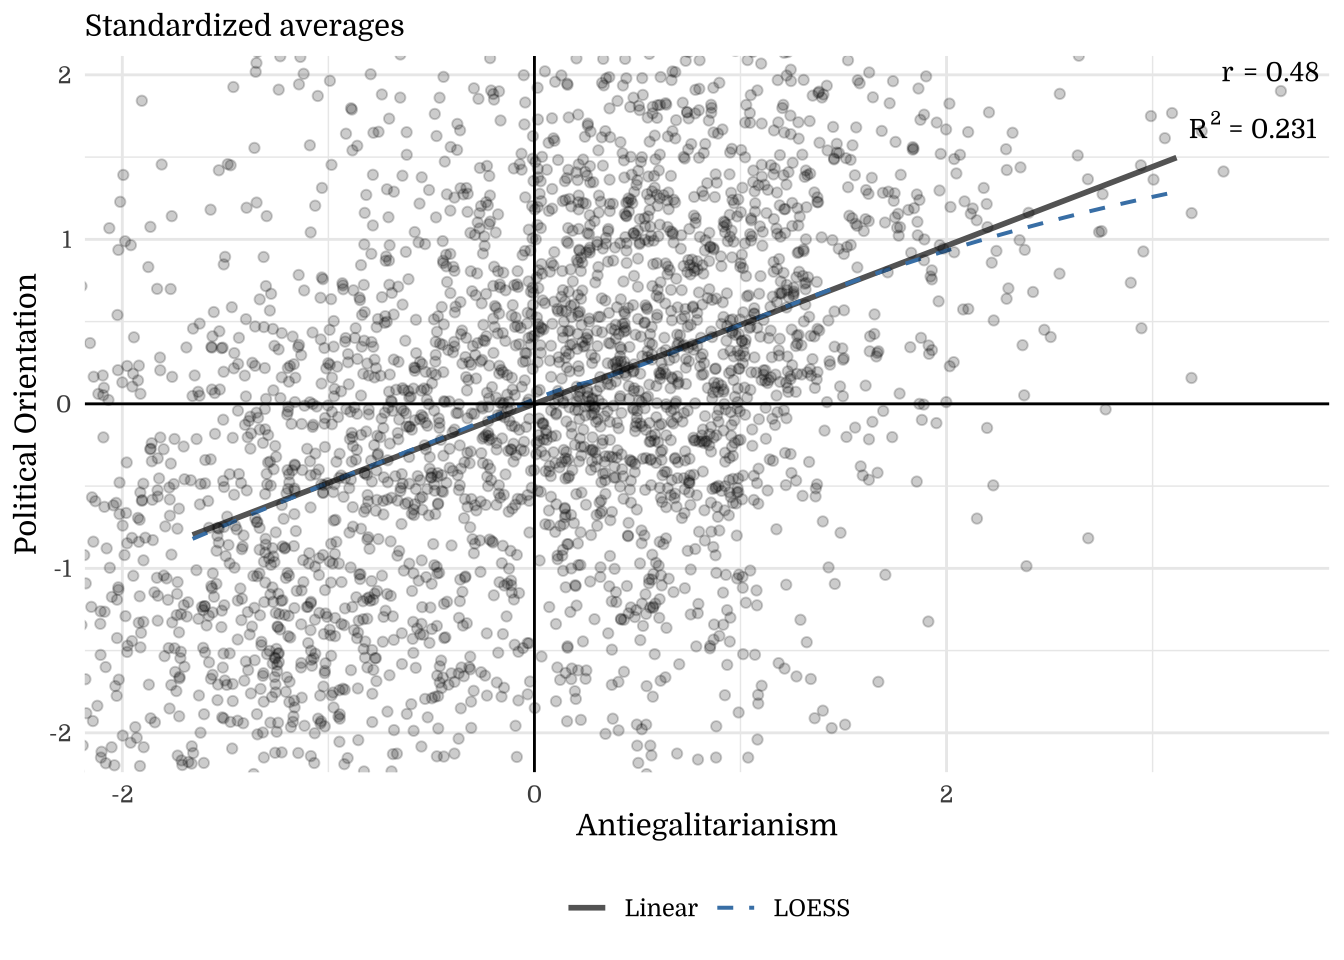
| Antiegalitarianism | 13.63 | 12.64 – 14.62 | <.001 | 14.32 | 13.25 – 15.40 | <.001 | 13.91 | 12.89 – 14.93 | <.001 | 13.95 | 13.00 – 14.90 | <.001 |
| Observations | 2759 | 2759 | 2759 | 2759 | ||||||||
| R2 / R2 adjusted | .209 / .209 | .199 / .198 | .205 / .205 | .231 / .231 | ||||||||
| Political Orientation | Social Political Orientation | Economic Political Orientation | |||||||
|---|---|---|---|---|---|---|---|---|---|
| Predictors | Estimates | CI | p | Estimates | CI | p | Estimates | CI | p |
| (Intercept) | 9.31 | 4.14 – 14.48 | <.001 | 8.87 | 3.30 – 14.45 | .002 | 6.21 | 0.84 – 11.58 | .023 |
| SDO | 8.98 | 8.29 – 9.66 | <.001 | 9.52 | 8.78 – 10.25 | <.001 | 8.84 | 8.13 – 9.55 | <.001 |
| Age | 2.25 | 1.65 – 2.84 | <.001 | 2.80 | 2.16 – 3.44 | <.001 | 2.23 | 1.61 – 2.85 | <.001 |
| Income | 1.07 | 0.59 – 1.55 | <.001 | 0.61 | 0.09 – 1.13 | .021 | 1.46 | 0.96 – 1.96 | <.001 |
| Education | -1.66 | -2.73 – -0.58 | .003 | -2.84 | -4.00 – -1.68 | <.001 | -0.67 | -1.78 – 0.45 | .241 |
| Gender (Male) | 0.45 | -1.52 – 2.43 | .654 | 0.12 | -2.01 – 2.25 | .909 | 1.51 | -0.54 – 3.56 | .150 |
| Observations | 2759 | 2759 | 2759 | ||||||
| R2 / R2 adjusted | .229 / .227 | .228 / .227 | .216 / .215 | ||||||
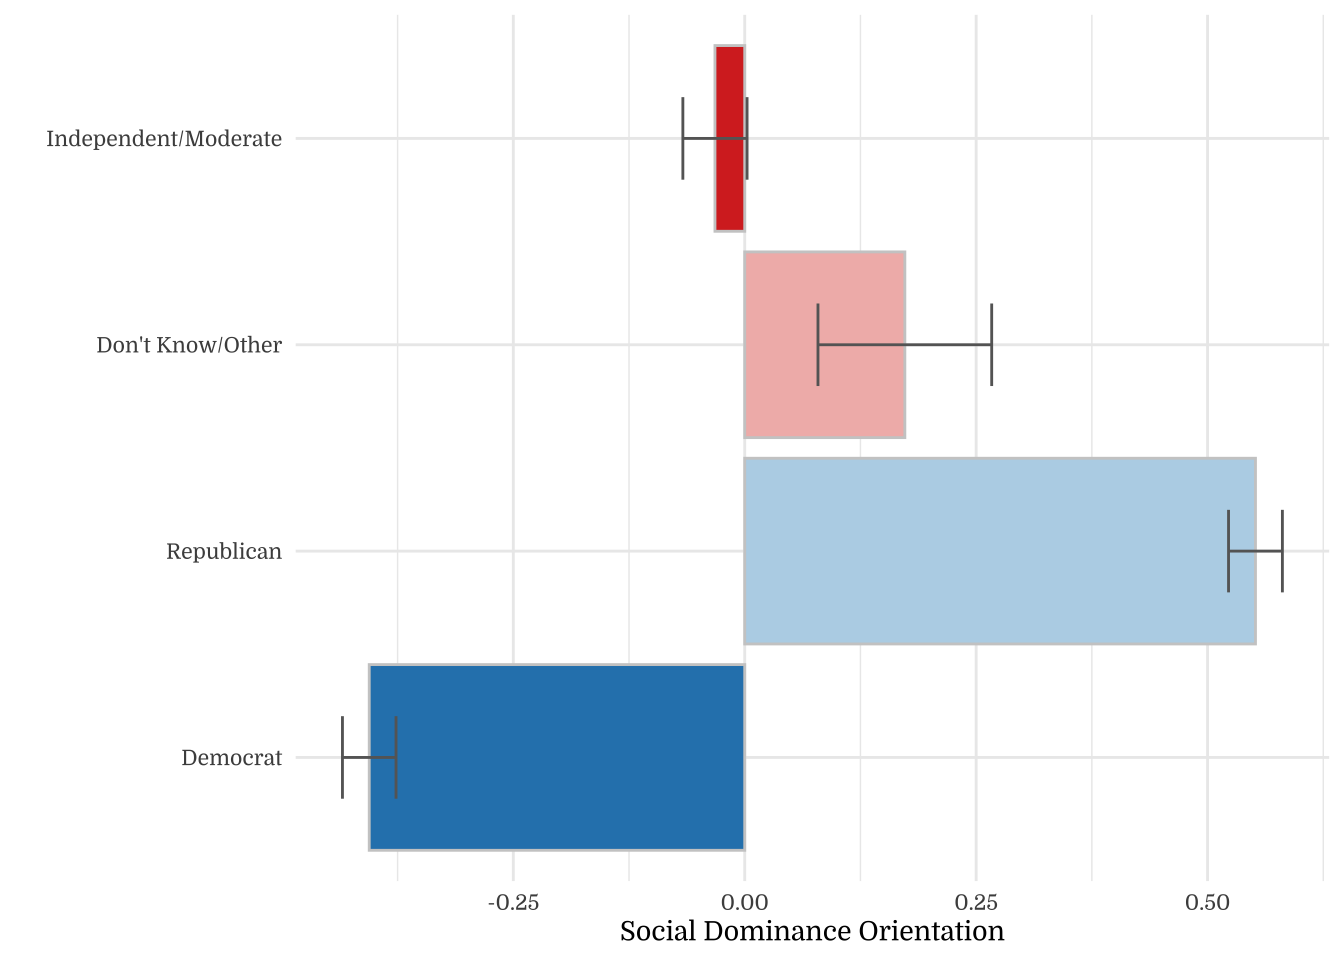
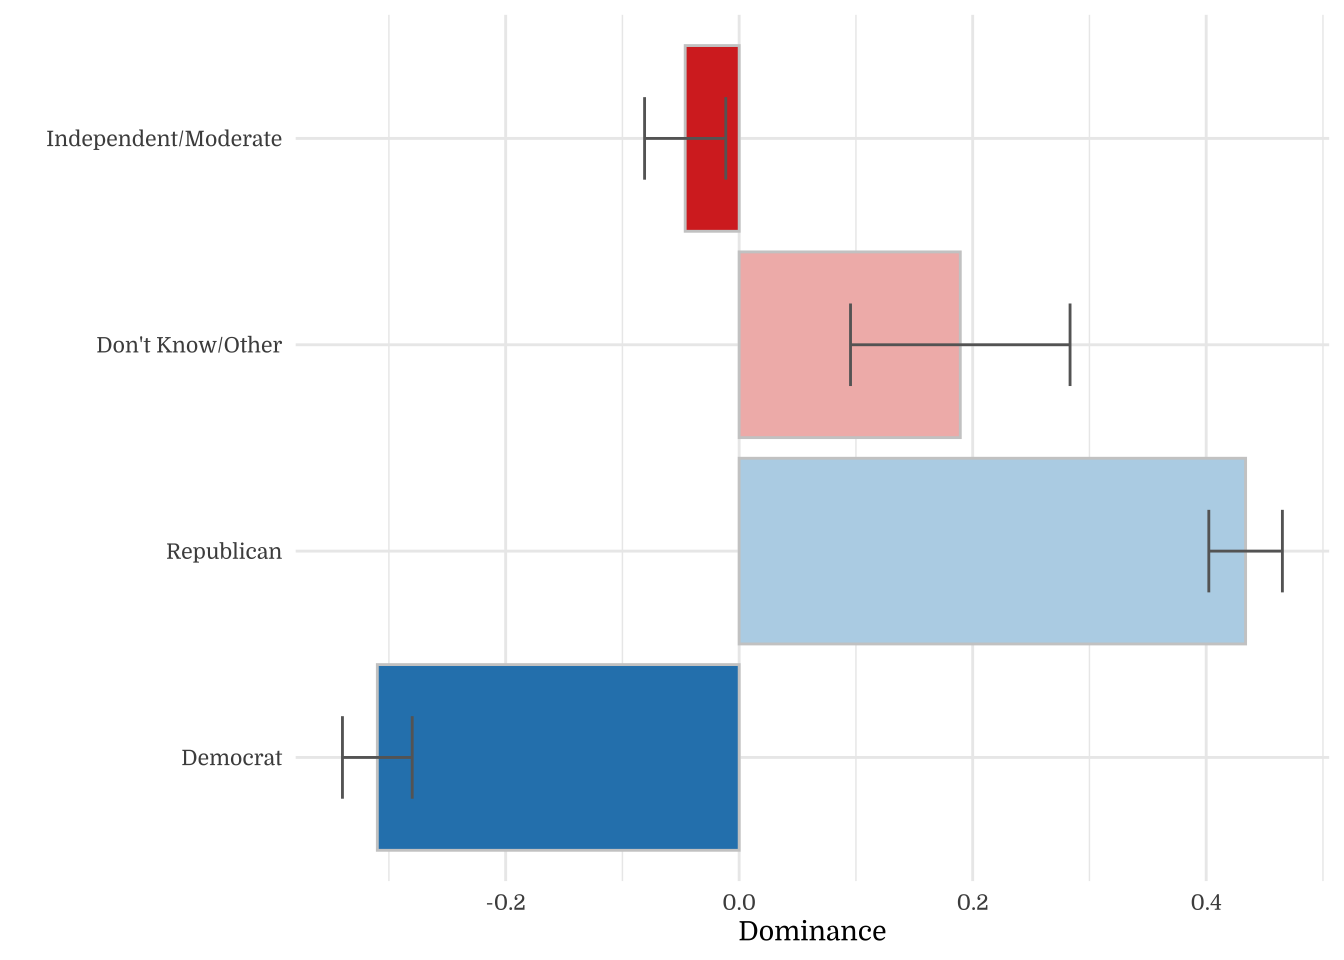
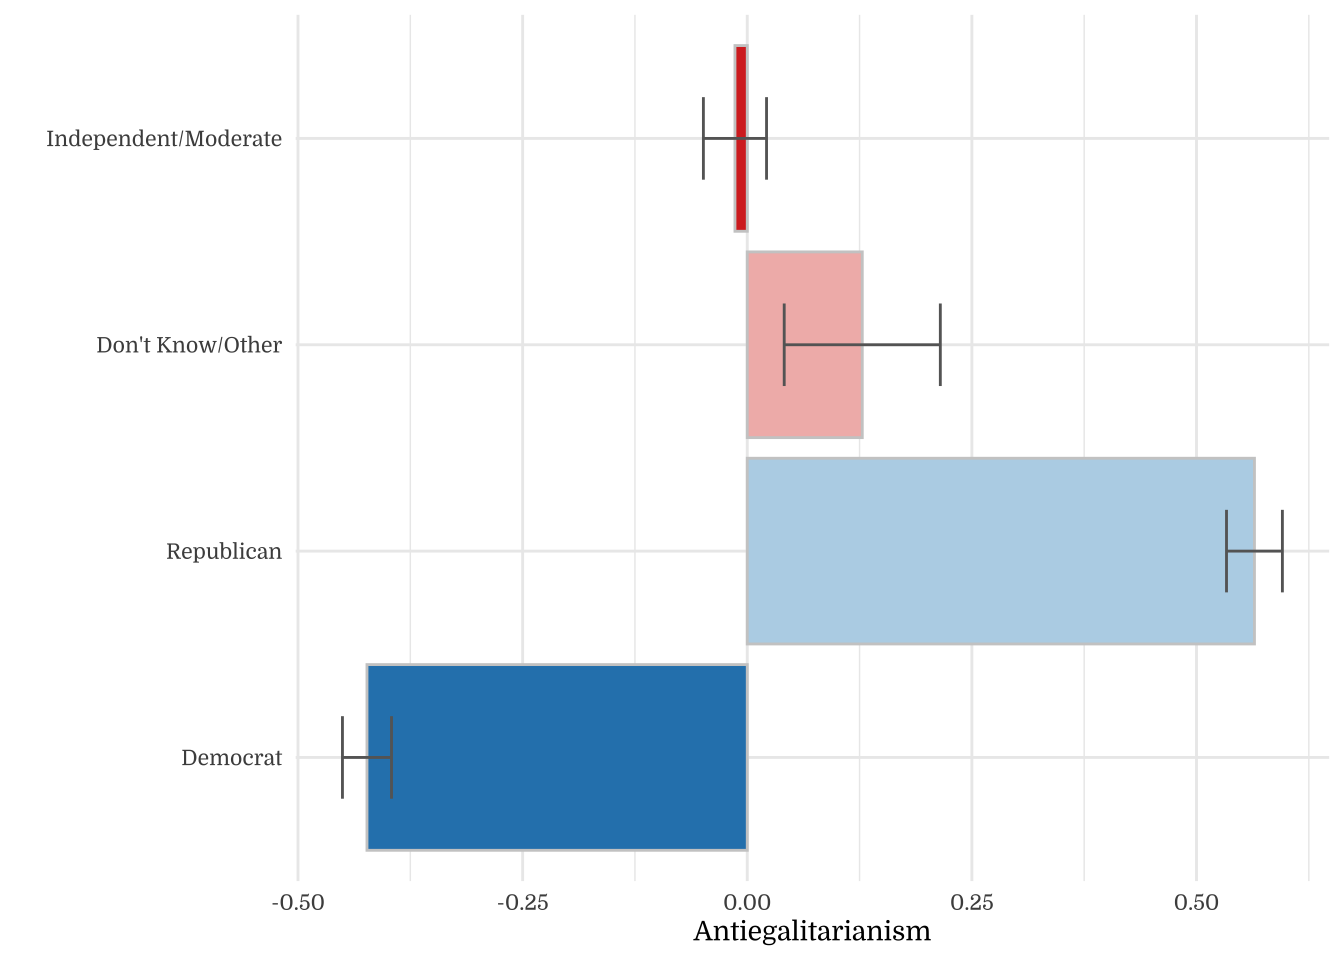
4.2 Partisanship
| Party Identity | N | Mean | SD |
|---|---|---|---|
| Democrat | 1100 | 3.04 | 1.52 |
| Republican | 819 | 4.18 | 1.38 |
| Don't Know/Other | 104 | 3.81 | 1.47 |
| Independent/Moderate | 736 | 3.44 | 1.45 |
| Party Identity | N | Mean | SD |
|---|---|---|---|
| Democrat | 1100 | 3.07 | 1.52 |
| Republican | 819 | 4.73 | 1.49 |
| Don't Know/Other | 104 | 3.99 | 1.48 |
| Independent/Moderate | 736 | 3.76 | 1.60 |
| Social Dominance Orientation | |||
|---|---|---|---|
| Predictors | Estimates | CI | p |
| (Intercept) | 2.36 | 2.23 – 2.48 | <.001 |
| Party Identity (7-point) | 0.35 | 0.32 – 0.38 | <.001 |
| Observations | 1919 | ||
| R2 / R2 adjusted | .214 / .214 | ||
| Dominance | |||
|---|---|---|---|
| Predictors | Estimates | CI | p |
| (Intercept) | 2.47 | 2.33 – 2.61 | <.001 |
| Party Identity (7-point) | 0.29 | 0.25 – 0.32 | <.001 |
| Observations | 1919 | ||
| R2 / R2 adjusted | .130 / .129 | ||
| Antiegalitarianism | |||
|---|---|---|---|
| Predictors | Estimates | CI | p |
| (Intercept) | 2.24 | 2.10 – 2.39 | <.001 |
| Party Identity (7-point) | 0.41 | 0.38 – 0.45 | <.001 |
| Observations | 1919 | ||
| R2 / R2 adjusted | .228 / .228 | ||
| Social Dominance Orientation | |||
|---|---|---|---|
| Predictors | Estimates | CI | p |
| (Intercept) | 2.53 | 2.23 – 2.83 | <.001 |
| Party Identity (7-point) | 0.34 | 0.31 – 0.37 | <.001 |
| Age | -0.01 | -0.05 – 0.02 | .485 |
| Income | 0.02 | -0.01 – 0.05 | .129 |
| Education | -0.18 | -0.24 – -0.11 | <.001 |
| Gender (Male) | 0.20 | 0.08 – 0.31 | .001 |
| Observations | 1919 | ||
| R2 / R2 adjusted | .232 / .230 | ||
| Dominance | |||
|---|---|---|---|
| Predictors | Estimates | CI | p |
| (Intercept) | 2.71 | 2.39 – 3.04 | <.001 |
| Party Identity (7-point) | 0.28 | 0.25 – 0.32 | <.001 |
| Age | -0.05 | -0.09 – -0.01 | .012 |
| Income | 0.01 | -0.02 – 0.04 | .555 |
| Education | -0.19 | -0.26 – -0.12 | <.001 |
| Gender (Male) | 0.31 | 0.18 – 0.44 | <.001 |
| Observations | 1919 | ||
| R2 / R2 adjusted | .159 / .157 | ||
| Antiegalitarianism | |||
|---|---|---|---|
| Predictors | Estimates | CI | p |
| (Intercept) | 2.35 | 2.01 – 2.69 | <.001 |
| Party Identity (7-point) | 0.40 | 0.37 – 0.44 | <.001 |
| Age | 0.02 | -0.02 – 0.07 | .236 |
| Income | 0.04 | 0.00 – 0.07 | .037 |
| Education | -0.16 | -0.23 – -0.09 | <.001 |
| Gender (Male) | 0.08 | -0.05 – 0.22 | .225 |
| Observations | 1919 | ||
| R2 / R2 adjusted | .237 / .235 | ||
4.3 Religiosity
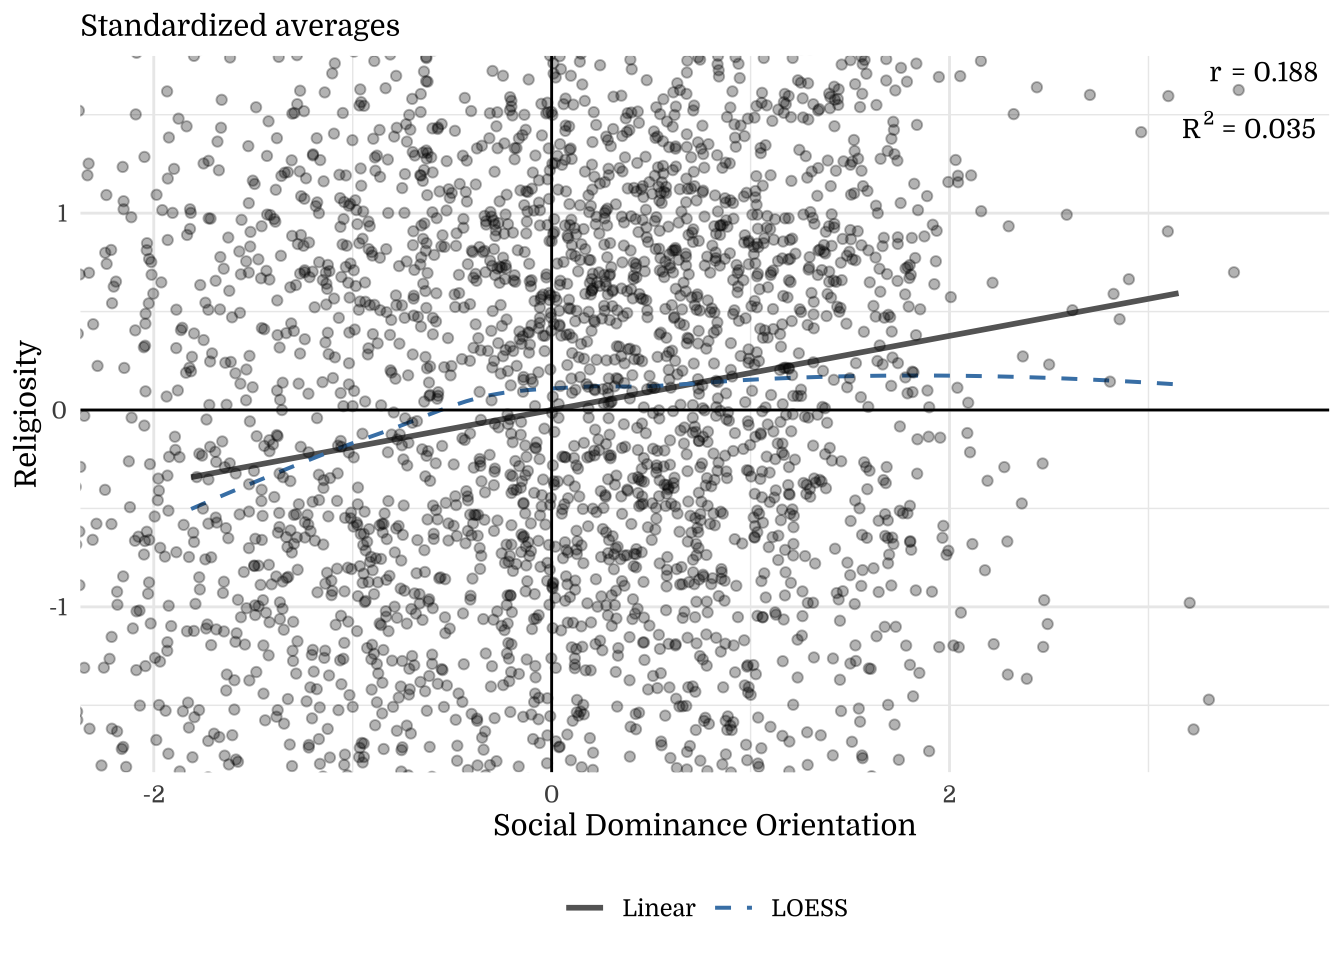
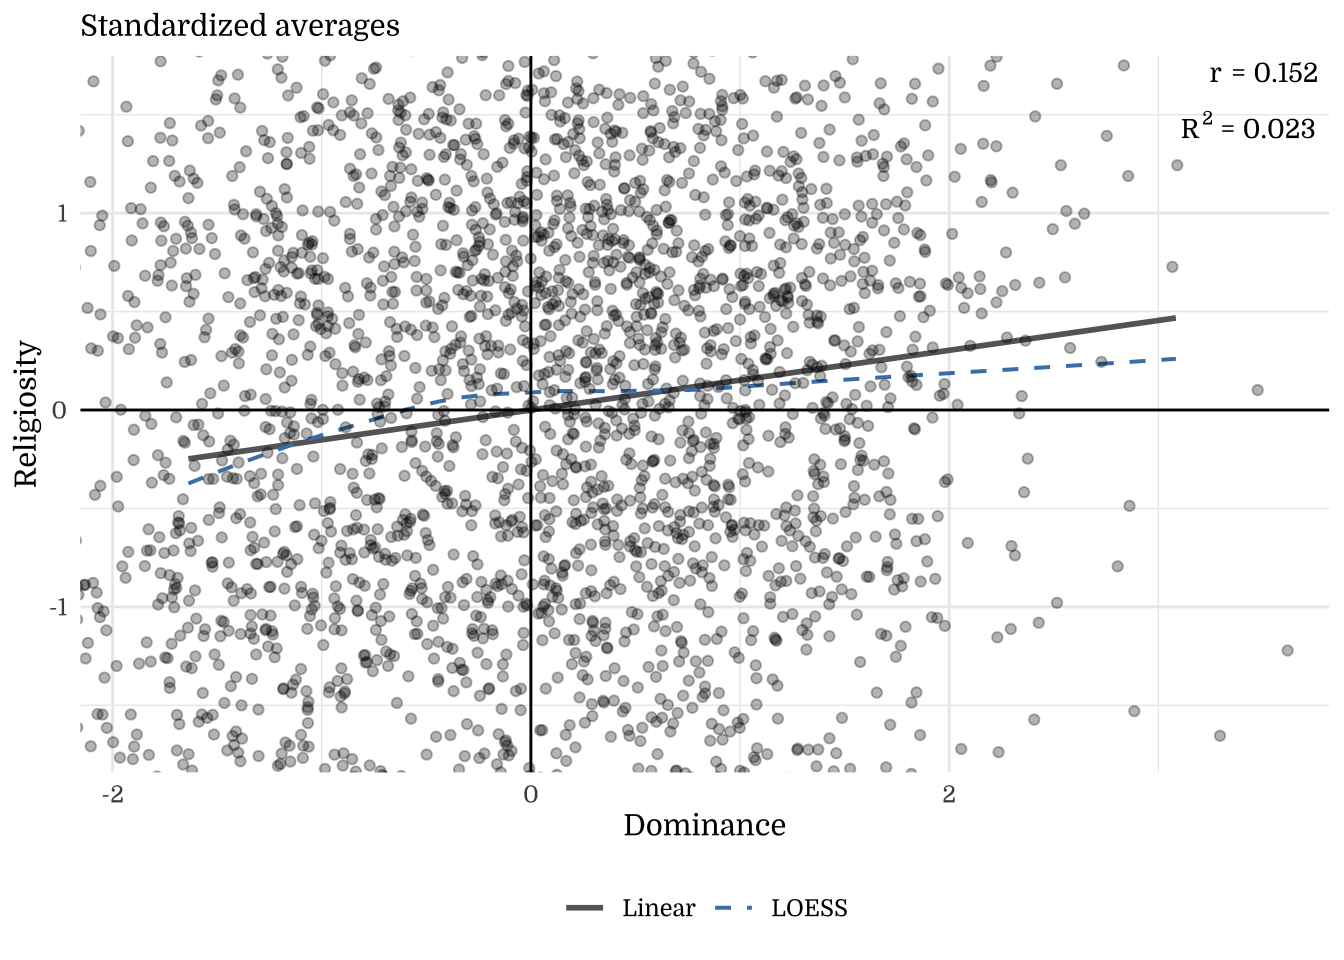
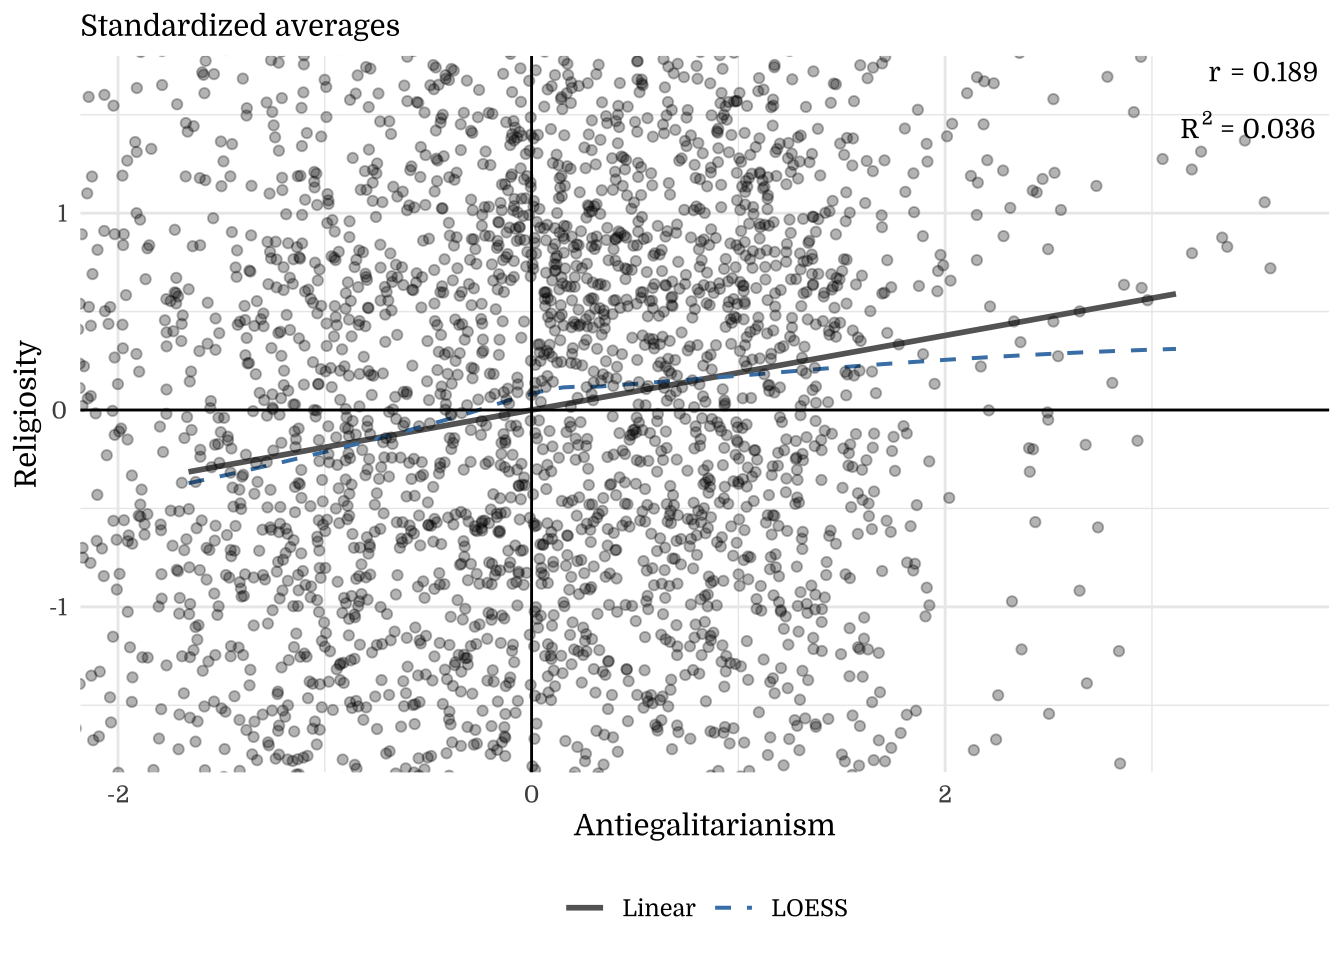
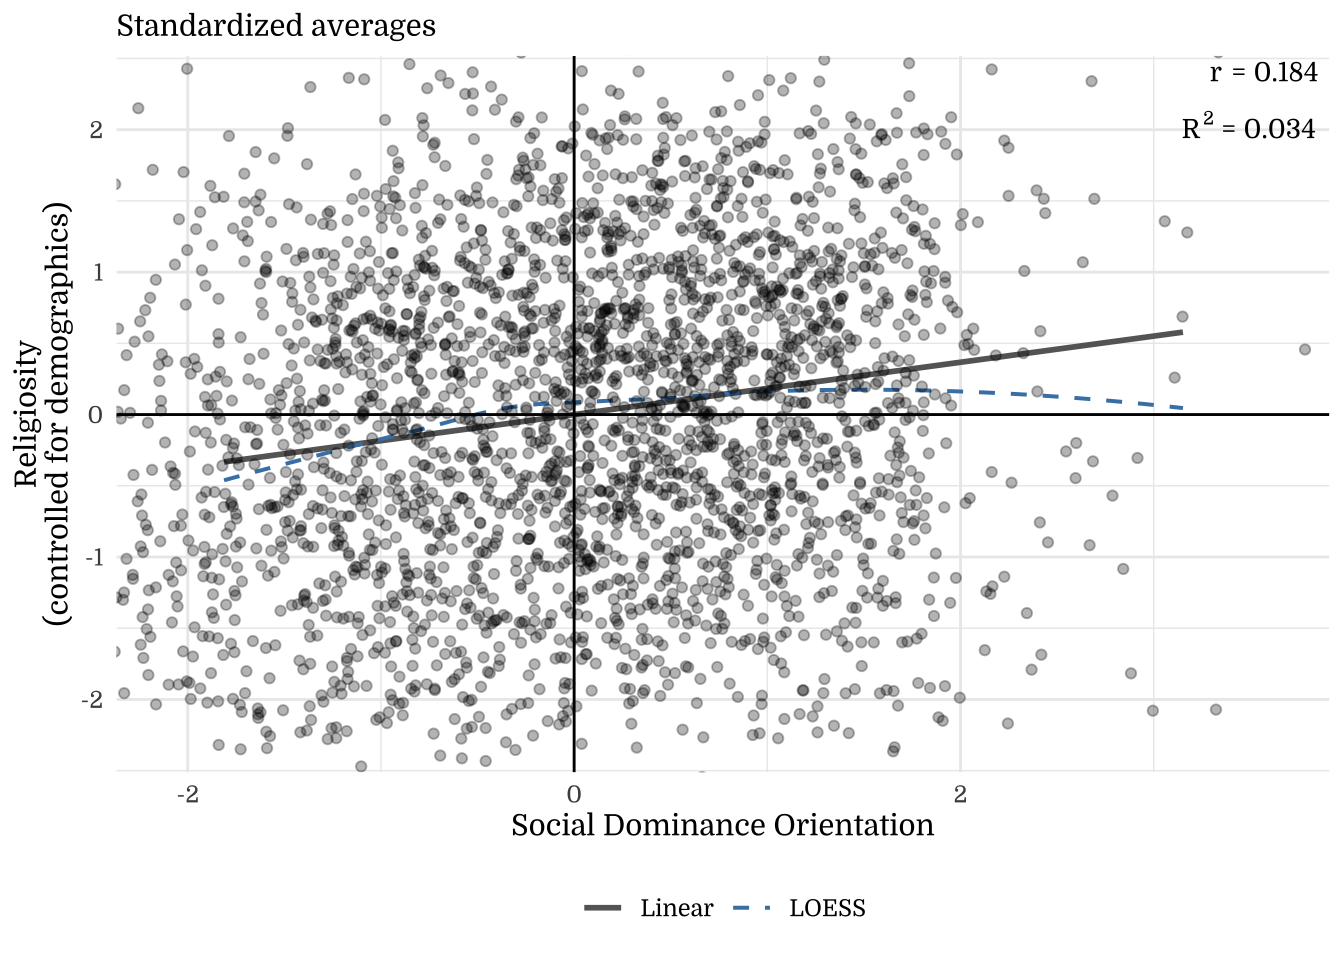
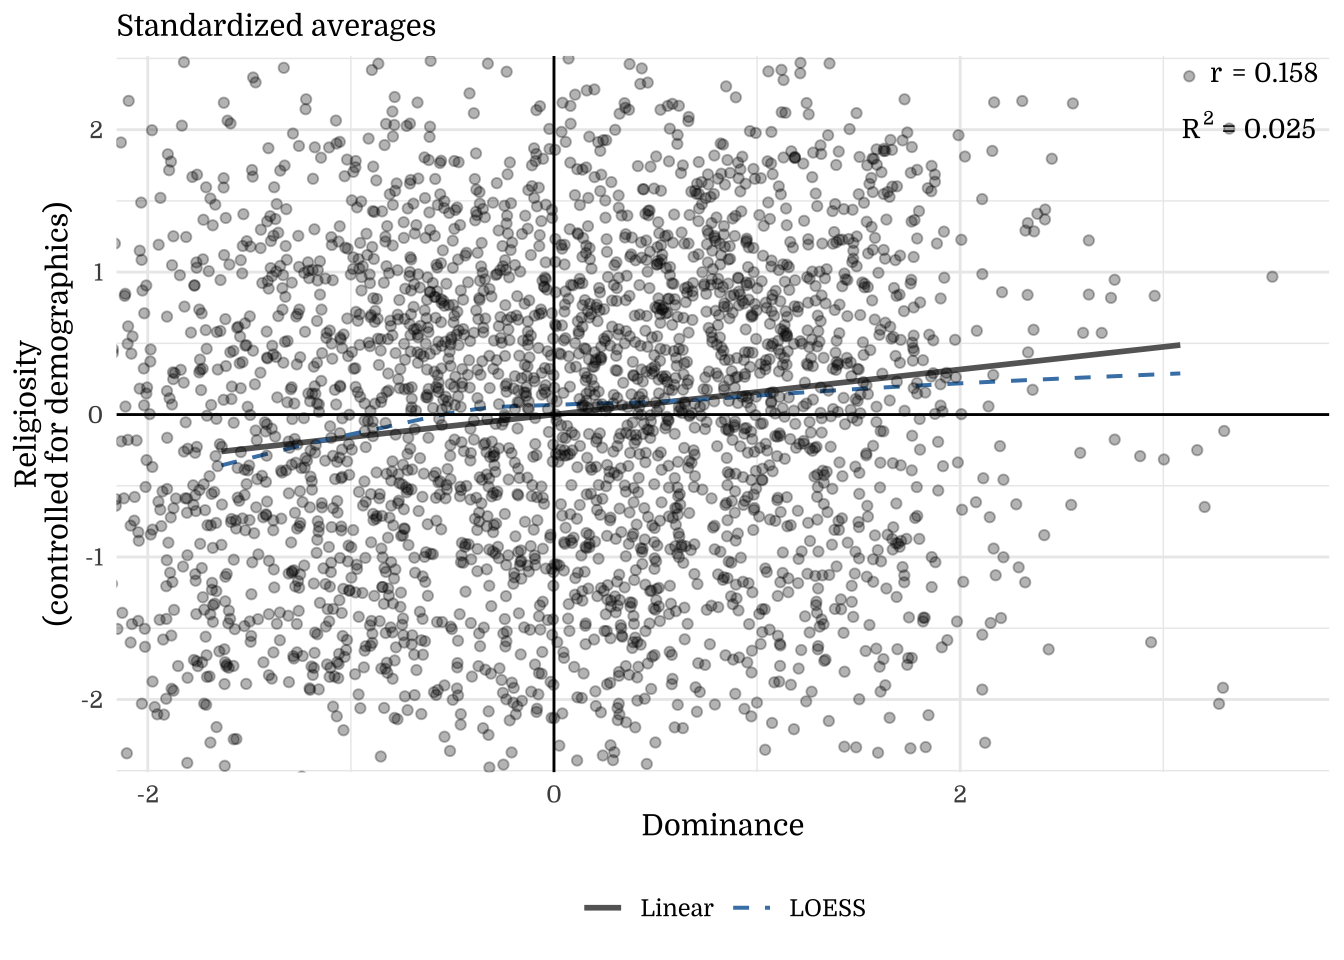
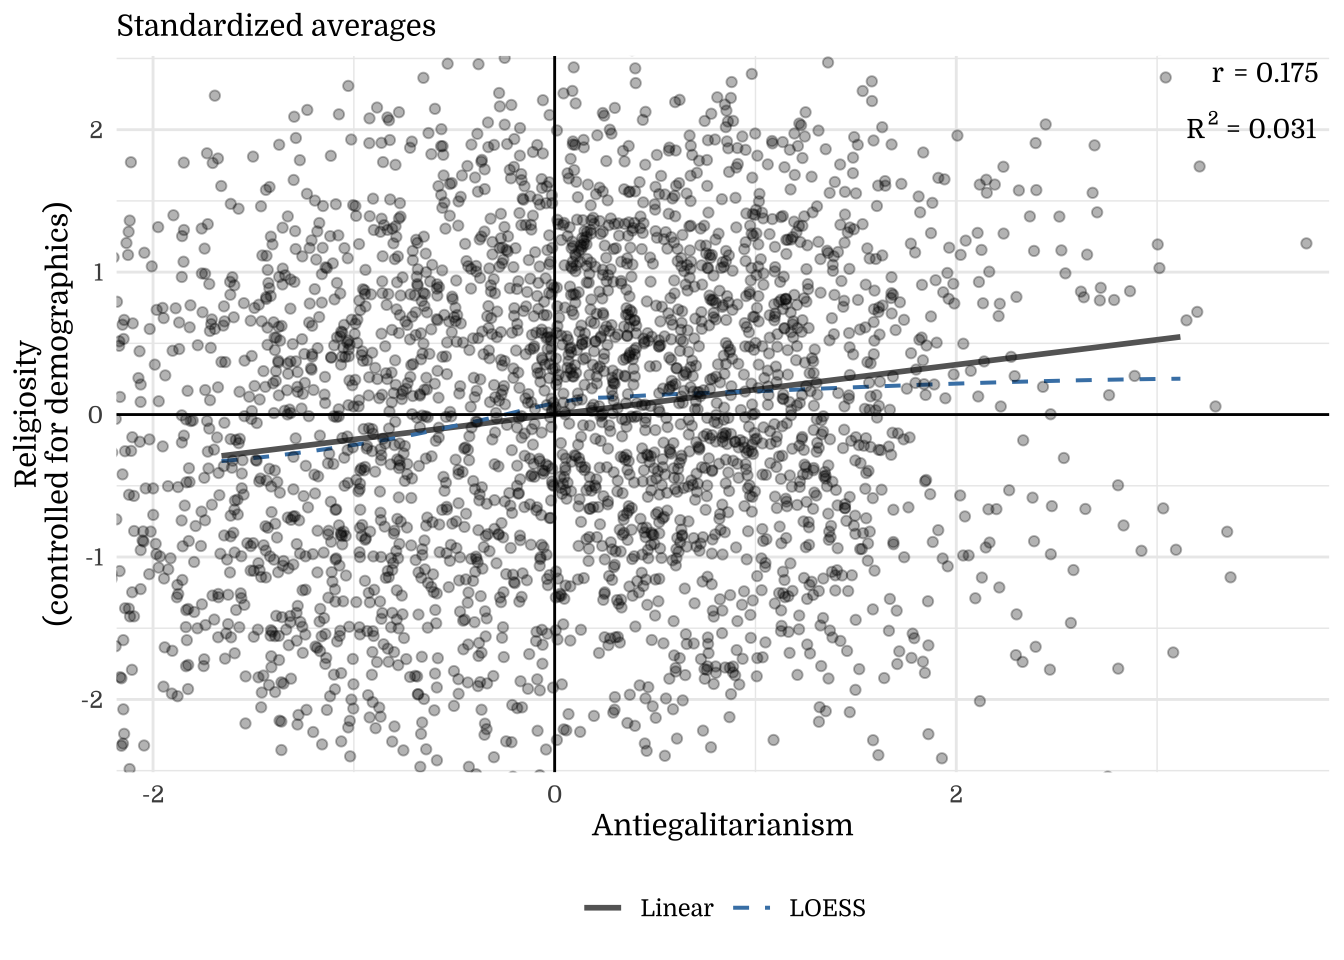
Note. The y-axis shows residuals after regressing the outcome on demographics (Age, Income, Education, Gender). This illustrates how much the focal construct explains beyond demographic factors.

4.4 Candidate Preferences
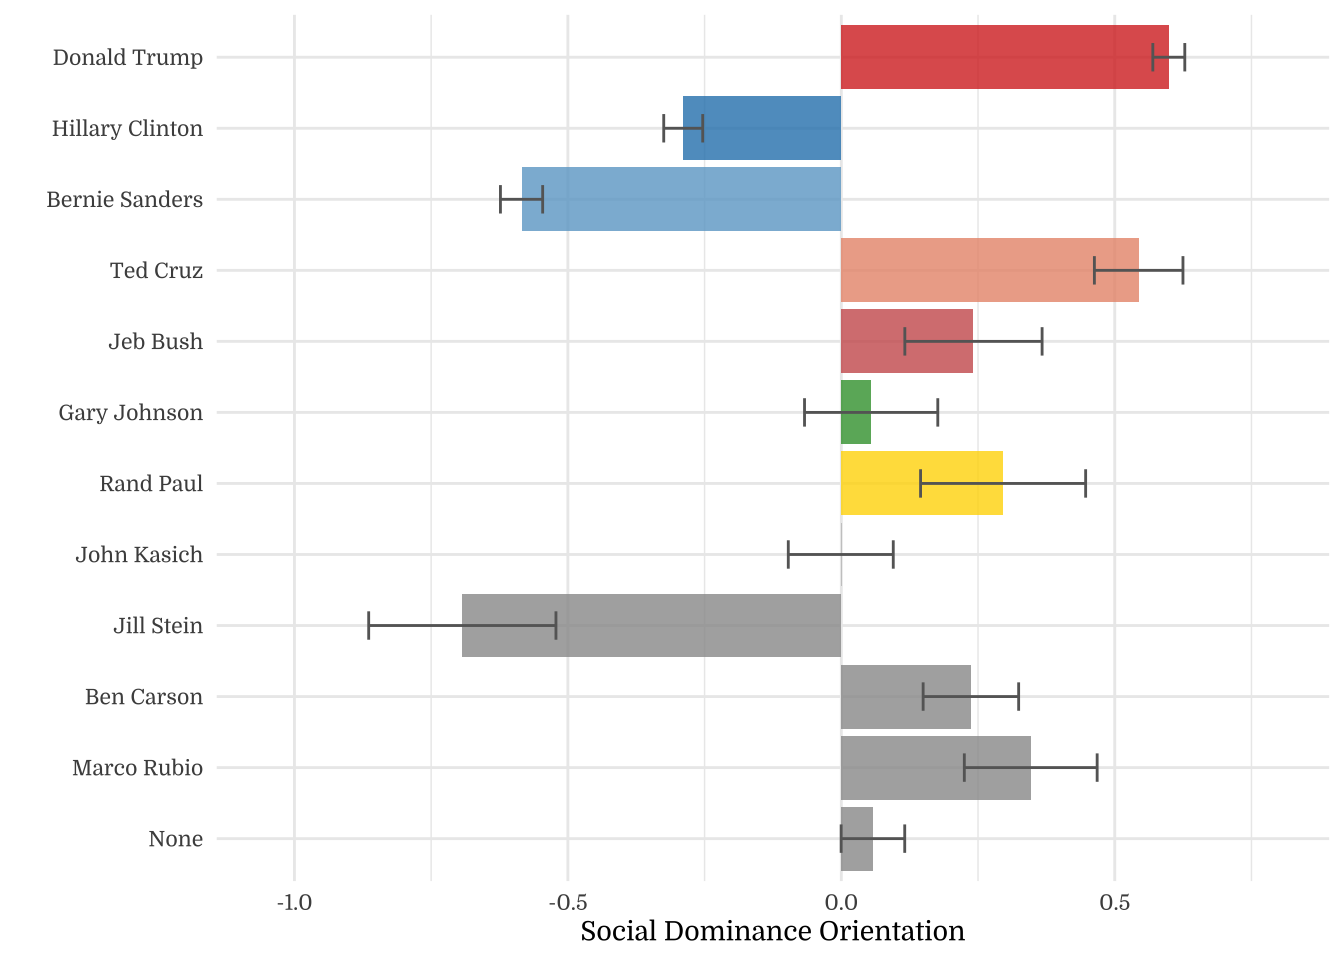
| Candidate Preference | N | Mean | SD |
|---|---|---|---|
| Donald Trump | 770 | 0.55 | 0.87 |
| Hillary Clinton | 714 | -0.19 | 1.00 |
| Bernie Sanders | 592 | -0.51 | 0.93 |
| Ted Cruz | 83 | 0.24 | 0.85 |
| Jeb Bush | 44 | 0.13 | 0.83 |
| Gary Johnson | 43 | -0.16 | 0.96 |
| Rand Paul | 30 | 0.11 | 0.77 |
| John Kasich | 88 | -0.13 | 0.87 |
| Jill Stein | 32 | -0.59 | 1.03 |
| Ben Carson | 82 | -0.02 | 0.81 |
| Marco Rubio | 38 | 0.15 | 0.75 |
| None | 243 | 0.09 | 0.91 |
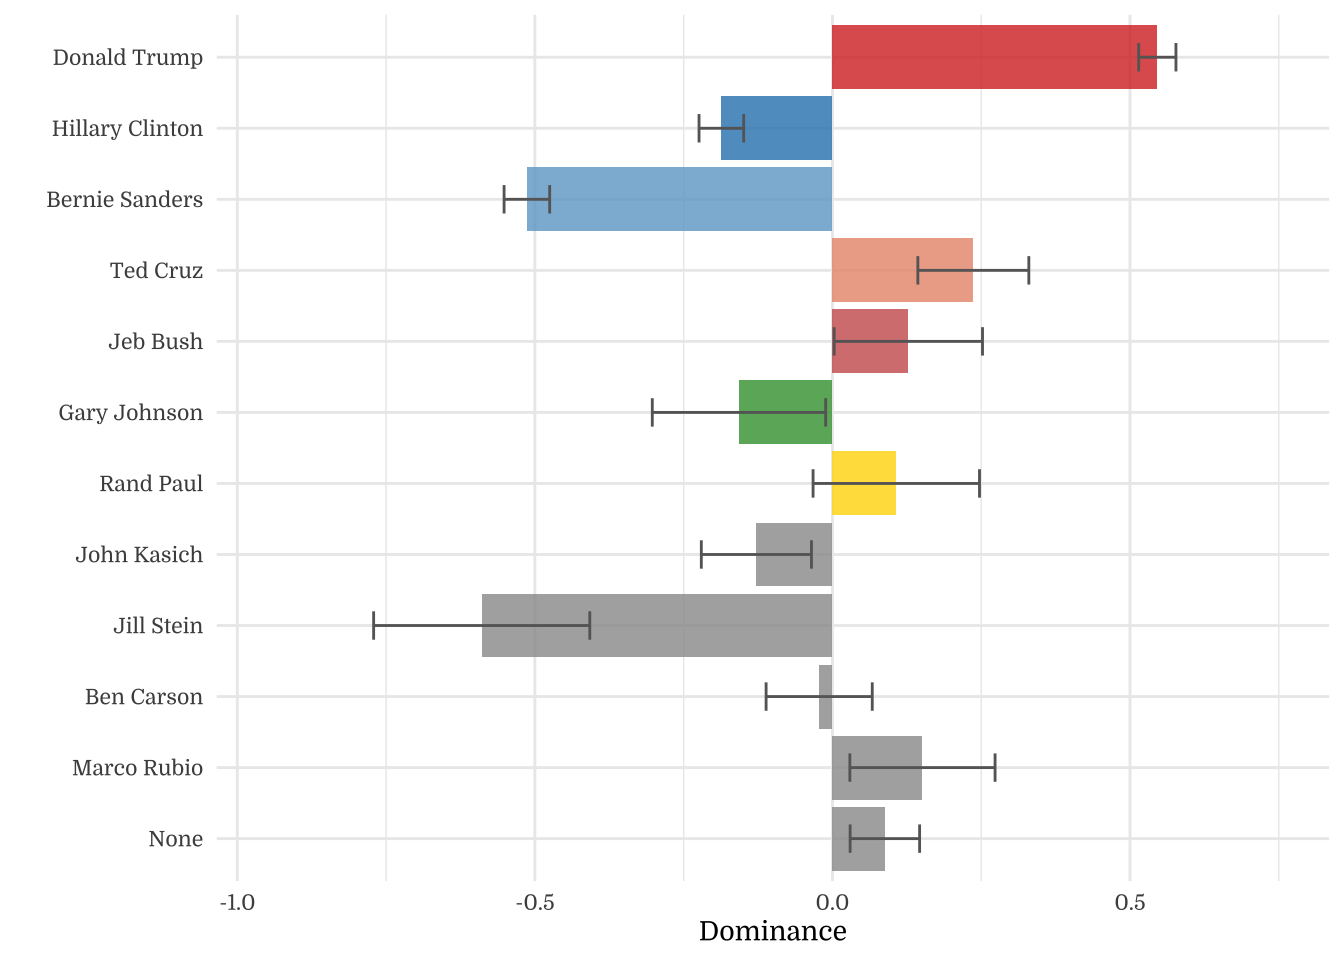
| Candidate Preference | N | Mean | SD |
|---|---|---|---|
| Donald Trump | 770 | 0.54 | 0.86 |
| Hillary Clinton | 714 | -0.33 | 0.91 |
| Bernie Sanders | 592 | -0.55 | 0.89 |
| Ted Cruz | 83 | 0.73 | 0.86 |
| Jeb Bush | 44 | 0.30 | 1.01 |
| Gary Johnson | 43 | 0.24 | 0.82 |
| Rand Paul | 30 | 0.42 | 0.99 |
| John Kasich | 88 | 0.12 | 0.93 |
| Jill Stein | 32 | -0.67 | 0.87 |
| Ben Carson | 82 | 0.43 | 0.85 |
| Marco Rubio | 38 | 0.47 | 0.85 |
| None | 243 | 0.02 | 0.91 |
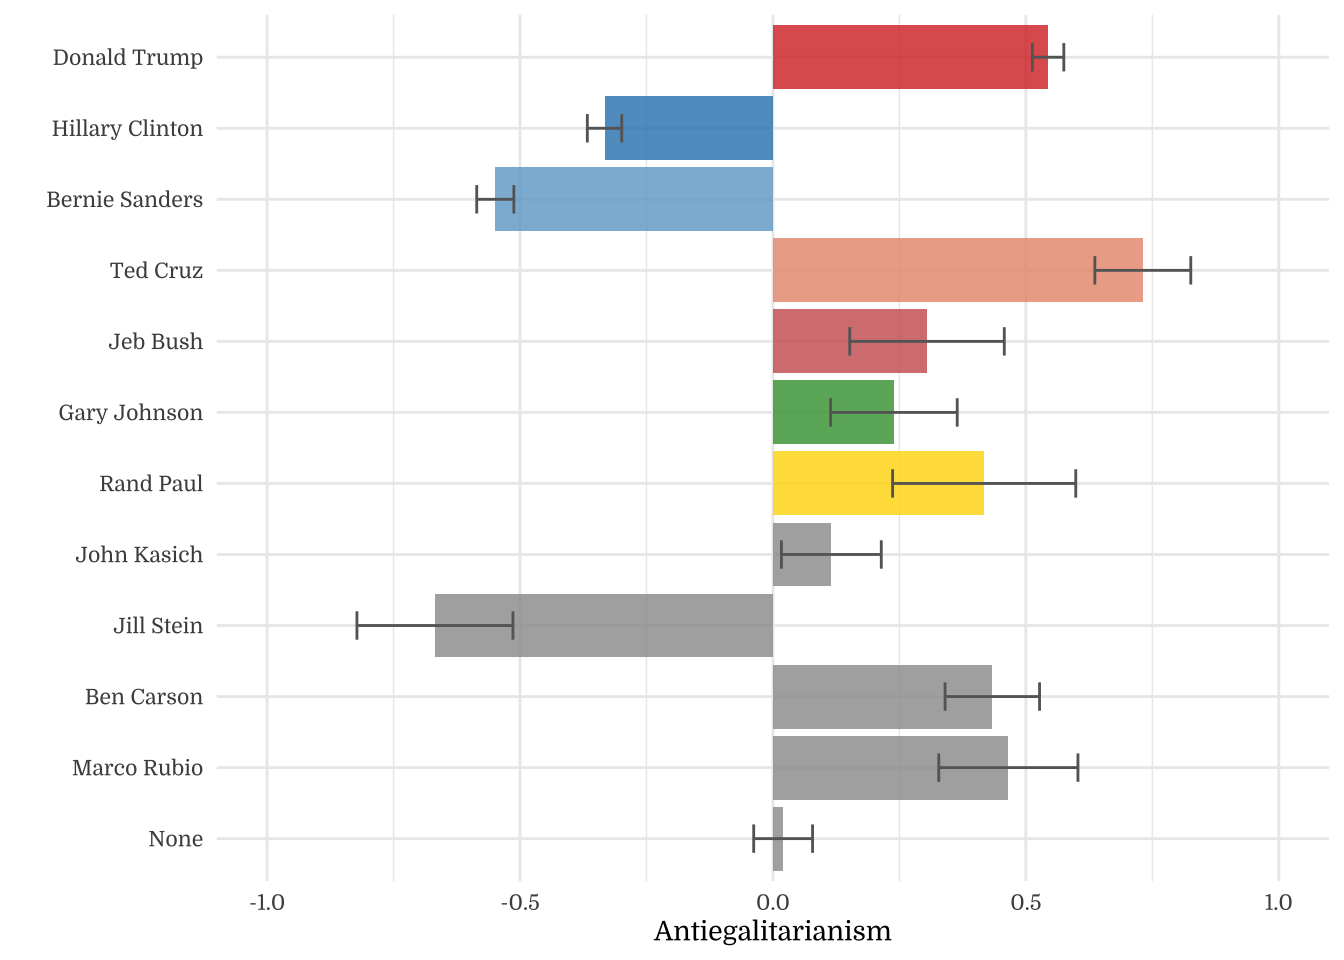
| Candidate Preference | N | Mean | SD |
|---|---|---|---|
| Donald Trump | 770 | 4.35 | 1.33 |
| Hillary Clinton | 714 | 3.23 | 1.54 |
| Bernie Sanders | 592 | 2.73 | 1.43 |
| Ted Cruz | 83 | 3.88 | 1.30 |
| Jeb Bush | 44 | 3.71 | 1.27 |
| Gary Johnson | 43 | 3.27 | 1.47 |
| Rand Paul | 30 | 3.68 | 1.18 |
| John Kasich | 88 | 3.32 | 1.33 |
| Jill Stein | 32 | 2.61 | 1.58 |
| Ben Carson | 82 | 3.48 | 1.24 |
| Marco Rubio | 38 | 3.75 | 1.16 |
| None | 243 | 3.65 | 1.40 |
| Candidate Preference | N | Mean | SD |
|---|---|---|---|
| Donald Trump | 770 | 4.69 | 1.45 |
| Hillary Clinton | 714 | 3.22 | 1.52 |
| Bernie Sanders | 592 | 2.86 | 1.50 |
| Ted Cruz | 83 | 5.00 | 1.45 |
| Jeb Bush | 44 | 4.29 | 1.70 |
| Gary Johnson | 43 | 4.18 | 1.37 |
| Rand Paul | 30 | 4.48 | 1.66 |
| John Kasich | 88 | 3.97 | 1.55 |
| Jill Stein | 32 | 2.66 | 1.46 |
| Ben Carson | 82 | 4.51 | 1.42 |
| Marco Rubio | 38 | 4.56 | 1.42 |
| None | 243 | 3.81 | 1.52 |
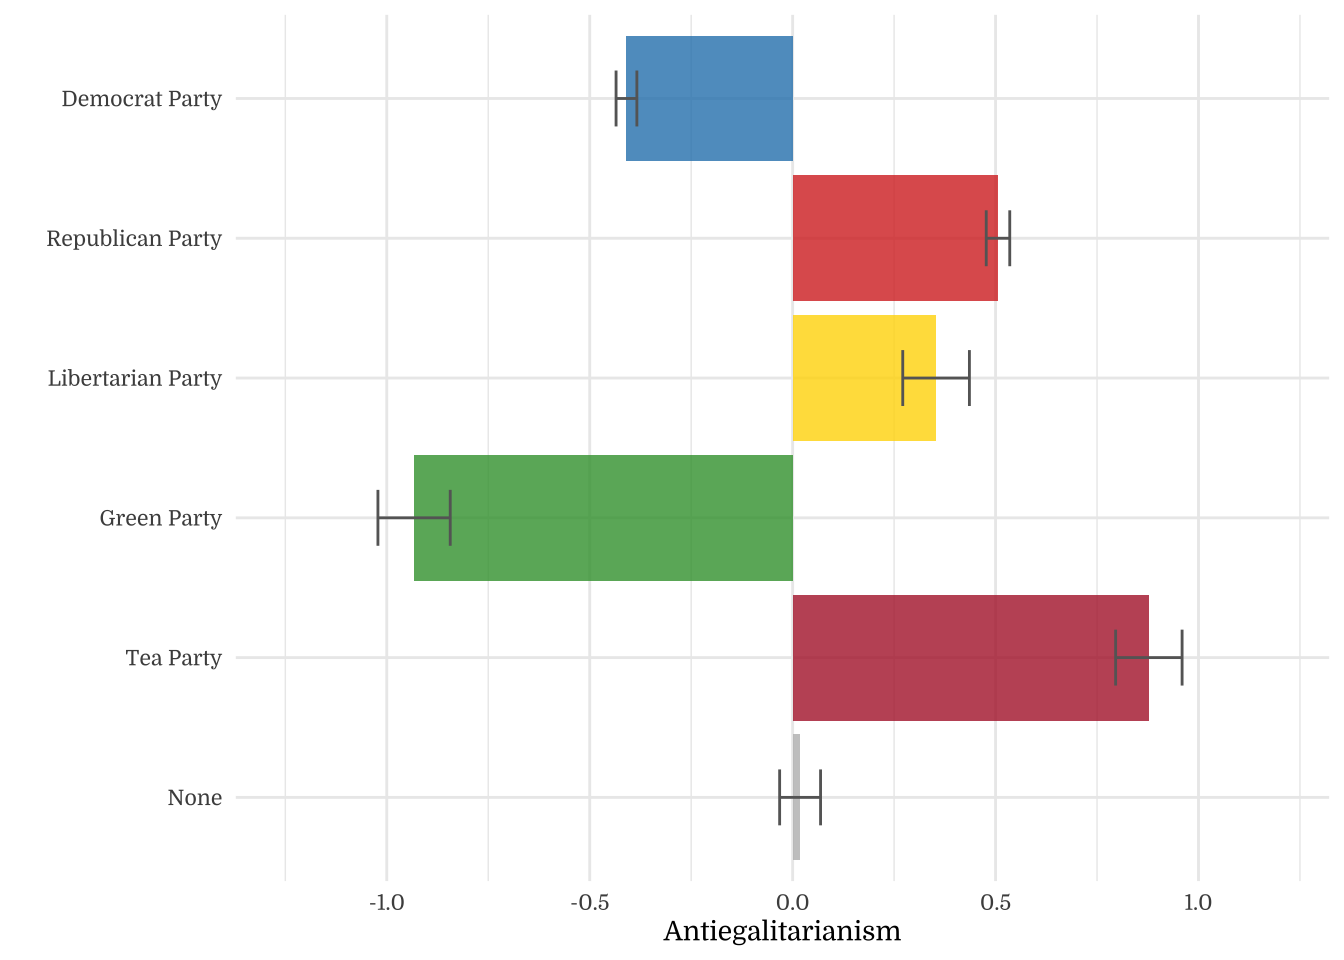
4.5 Party Preferences
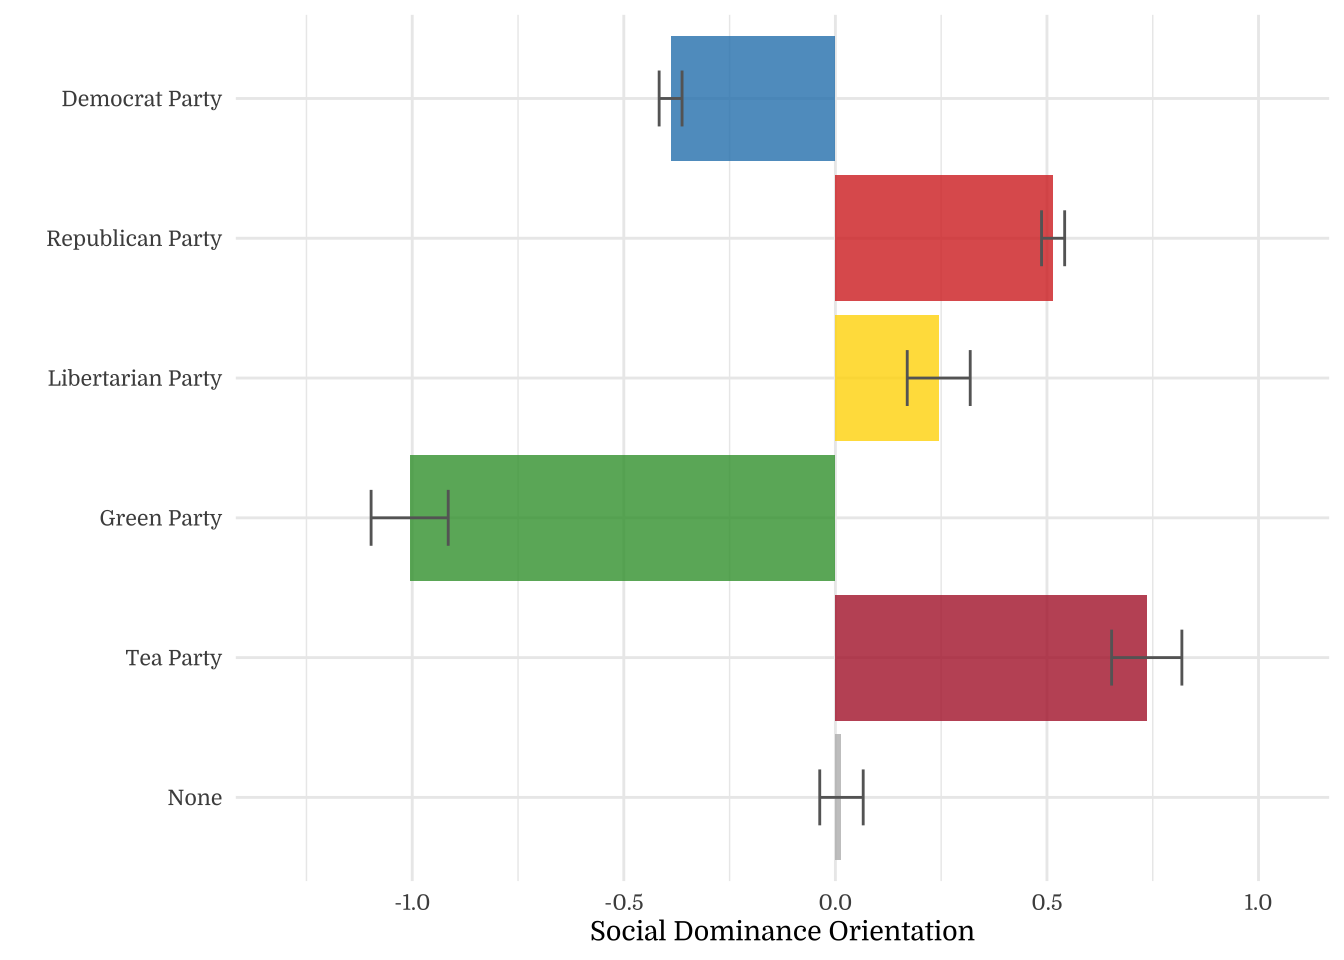
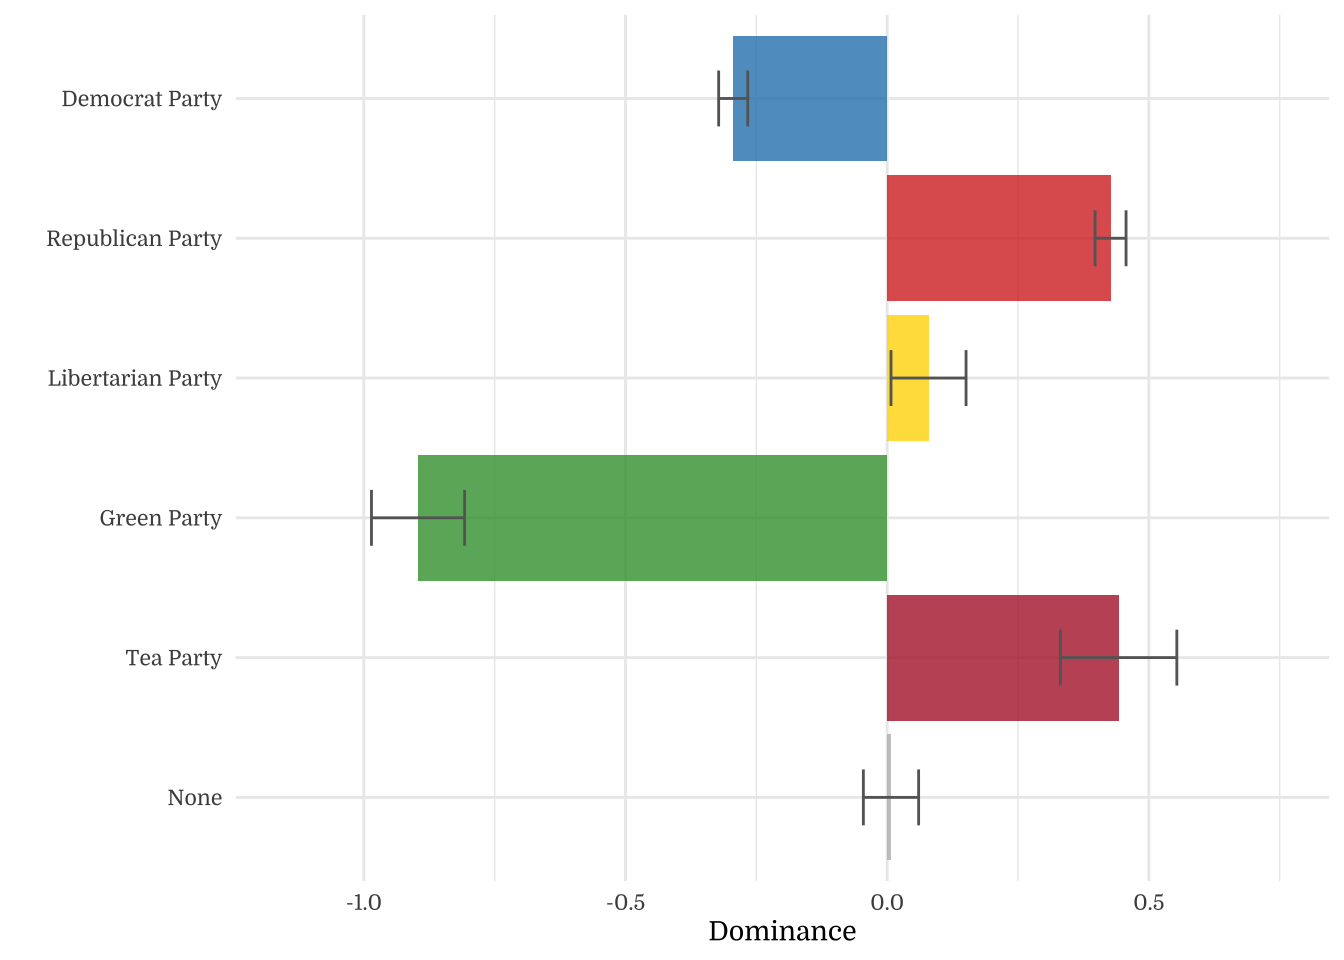
| Party Preference | N | Mean | SD |
|---|---|---|---|
| Democrat Party | 1251 | -0.29 | 0.98 |
| Republican Party | 898 | 0.43 | 0.89 |
| Libertarian Party | 150 | 0.08 | 0.88 |
| Green Party | 68 | -0.90 | 0.73 |
| Tea Party | 71 | 0.44 | 0.94 |
| None | 321 | 0.01 | 0.95 |
| Party Preference | N | Mean | SD |
|---|---|---|---|
| Democrat Party | 1251 | -0.41 | 0.91 |
| Republican Party | 898 | 0.51 | 0.87 |
| Libertarian Party | 150 | 0.35 | 1.01 |
| Green Party | 68 | -0.93 | 0.73 |
| Tea Party | 71 | 0.88 | 0.69 |
| None | 321 | 0.02 | 0.90 |
| Party Preference | N | Mean | SD |
|---|---|---|---|
| Democrat Party | 1251 | 3.06 | 1.51 |
| Republican Party | 898 | 4.17 | 1.36 |
| Libertarian Party | 150 | 3.64 | 1.35 |
| Green Party | 68 | 2.14 | 1.13 |
| Tea Party | 71 | 4.19 | 1.44 |
| None | 321 | 3.53 | 1.45 |
| Party Preference | N | Mean | SD |
|---|---|---|---|
| Democrat Party | 1251 | 3.09 | 1.52 |
| Republican Party | 898 | 4.63 | 1.46 |
| Libertarian Party | 150 | 4.37 | 1.69 |
| Green Party | 68 | 2.22 | 1.23 |
| Tea Party | 71 | 5.25 | 1.16 |
| None | 321 | 3.81 | 1.51 |
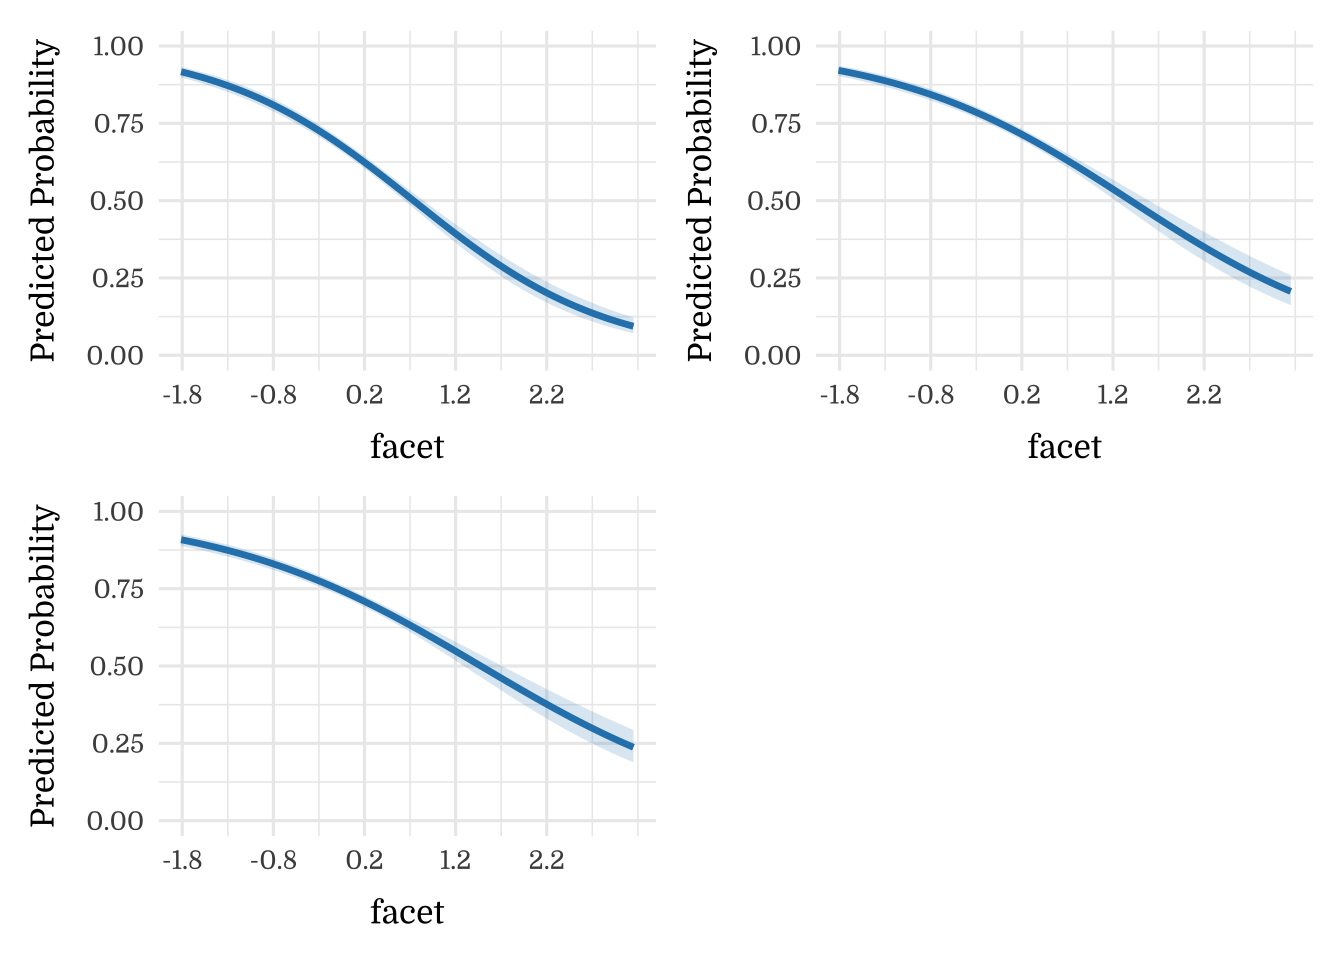
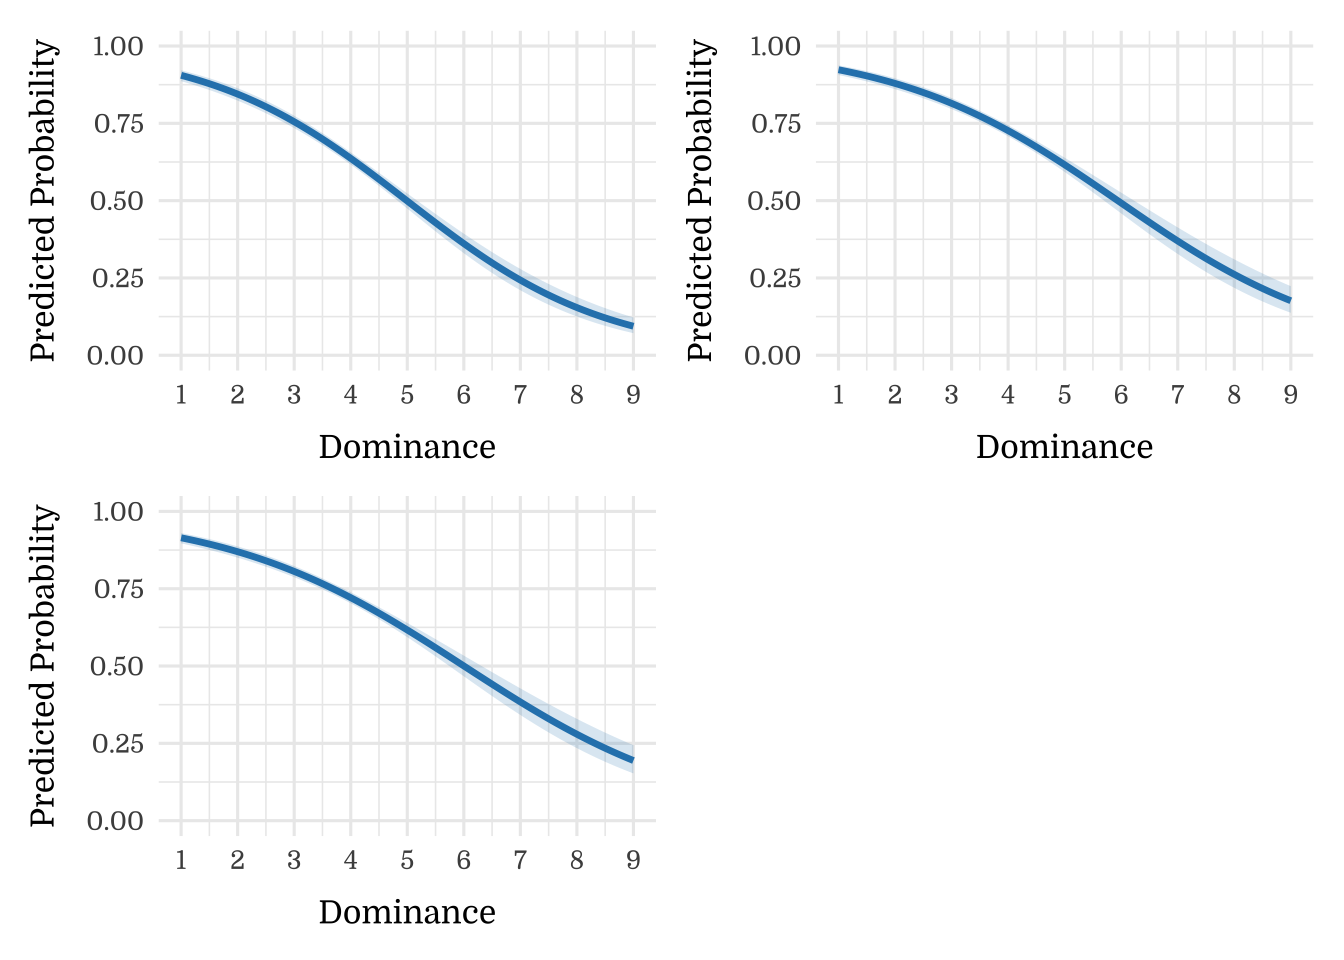
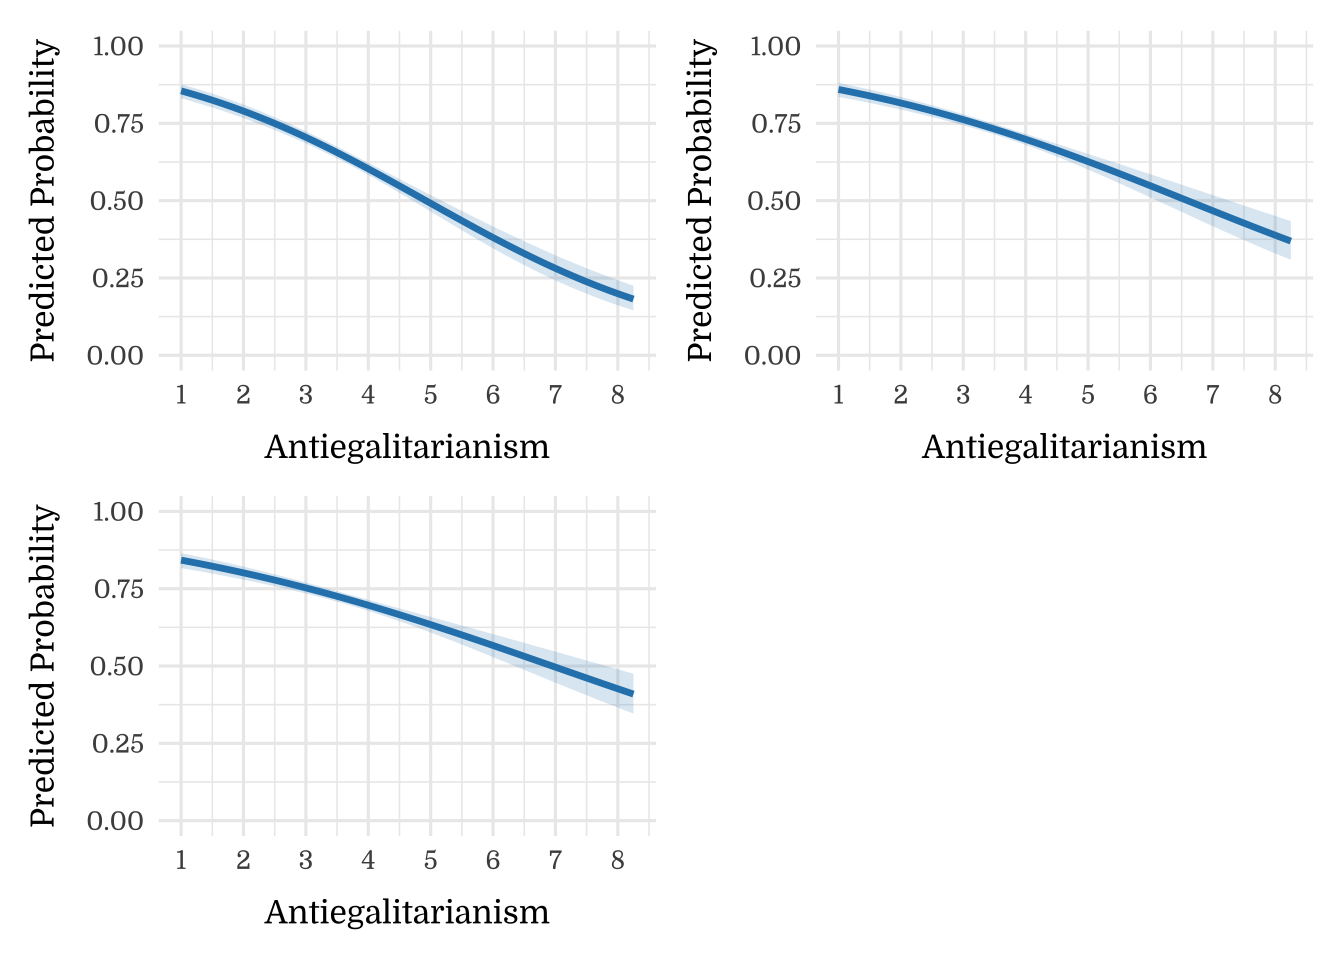
4.6 Voting
| 2016 [Trump vs. Clinton] | 2012 [Romney vs. Obama] | 2008 [McCain vs. Obama] | |||||||
|---|---|---|---|---|---|---|---|---|---|
| Predictors | Log-Odds | CI | p | Log-Odds | CI | p | Log-Odds | CI | p |
| (Intercept) | .694 | -Inf – Inf | <.001 | 1.068 | -Inf – Inf | <.001 | 1.030 | -Inf – Inf | <.001 |
| Social Dominance Orientation | -0.940 | -Inf – Inf | <.001 | -0.767 | -Inf – Inf | <.001 | -0.698 | -Inf – Inf | <.001 |
| Observations | 2759 | 2759 | 2759 | ||||||
| R2 Tjur | .106 | .042 | .055 | ||||||
4.7 Voting & Party Identity
4.8 Likeability
5 Politico-Psychological correlates of Social Dominance Orientation
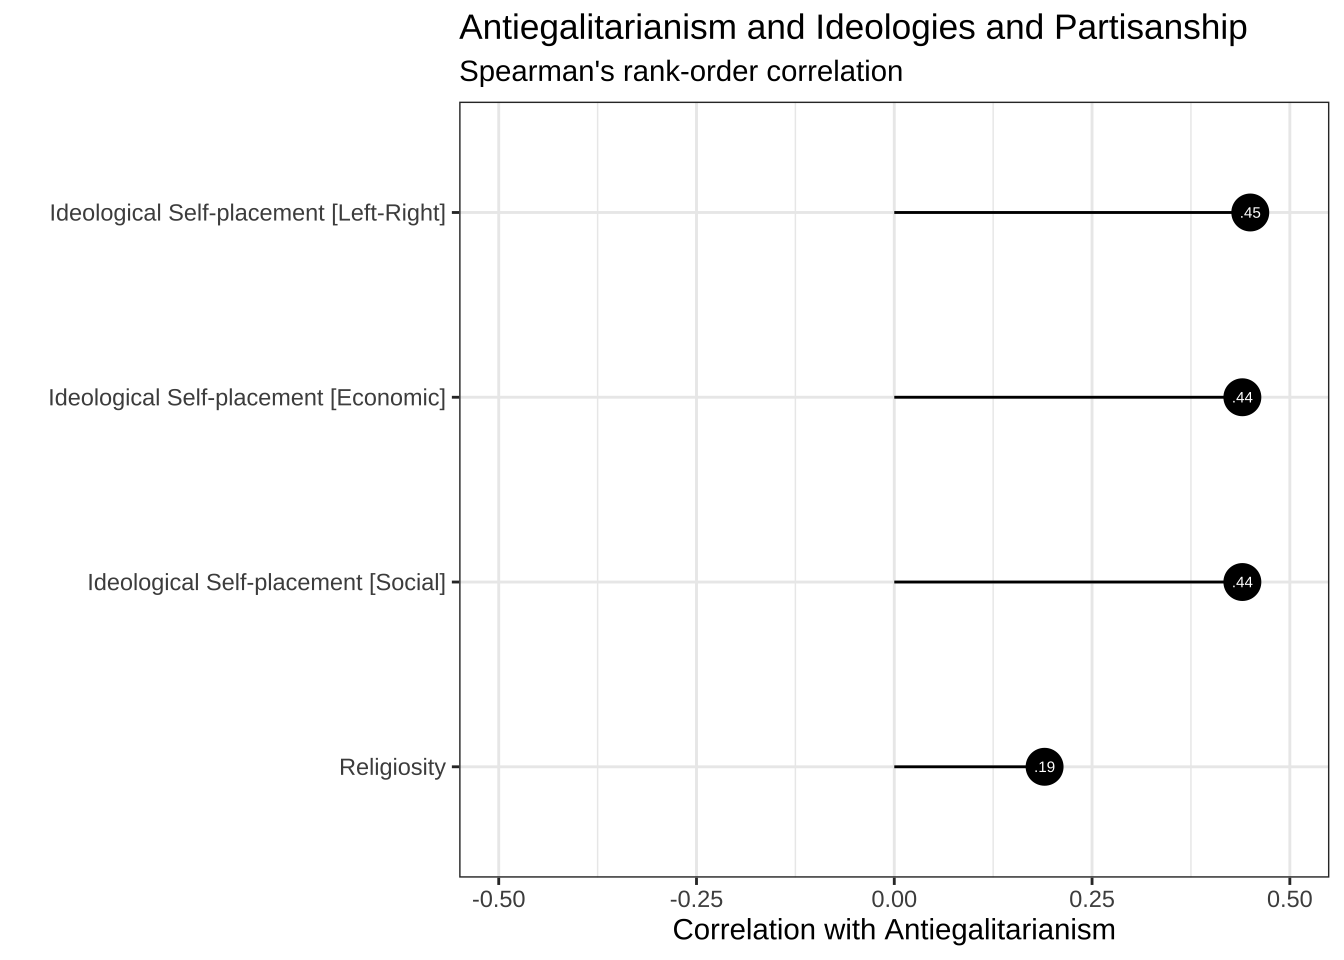
5.1 Ideologies and Partisanship


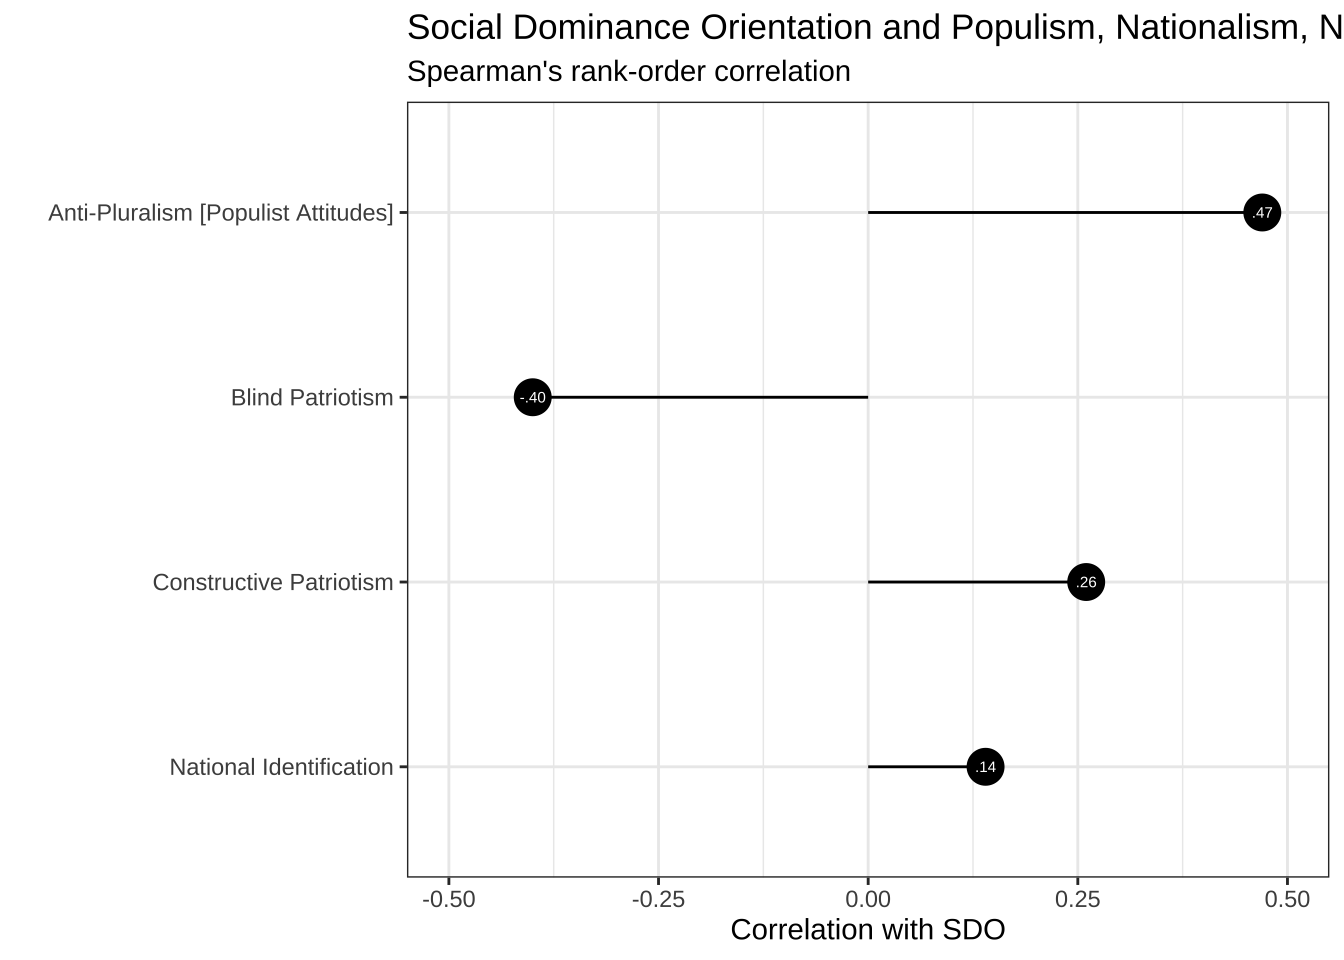
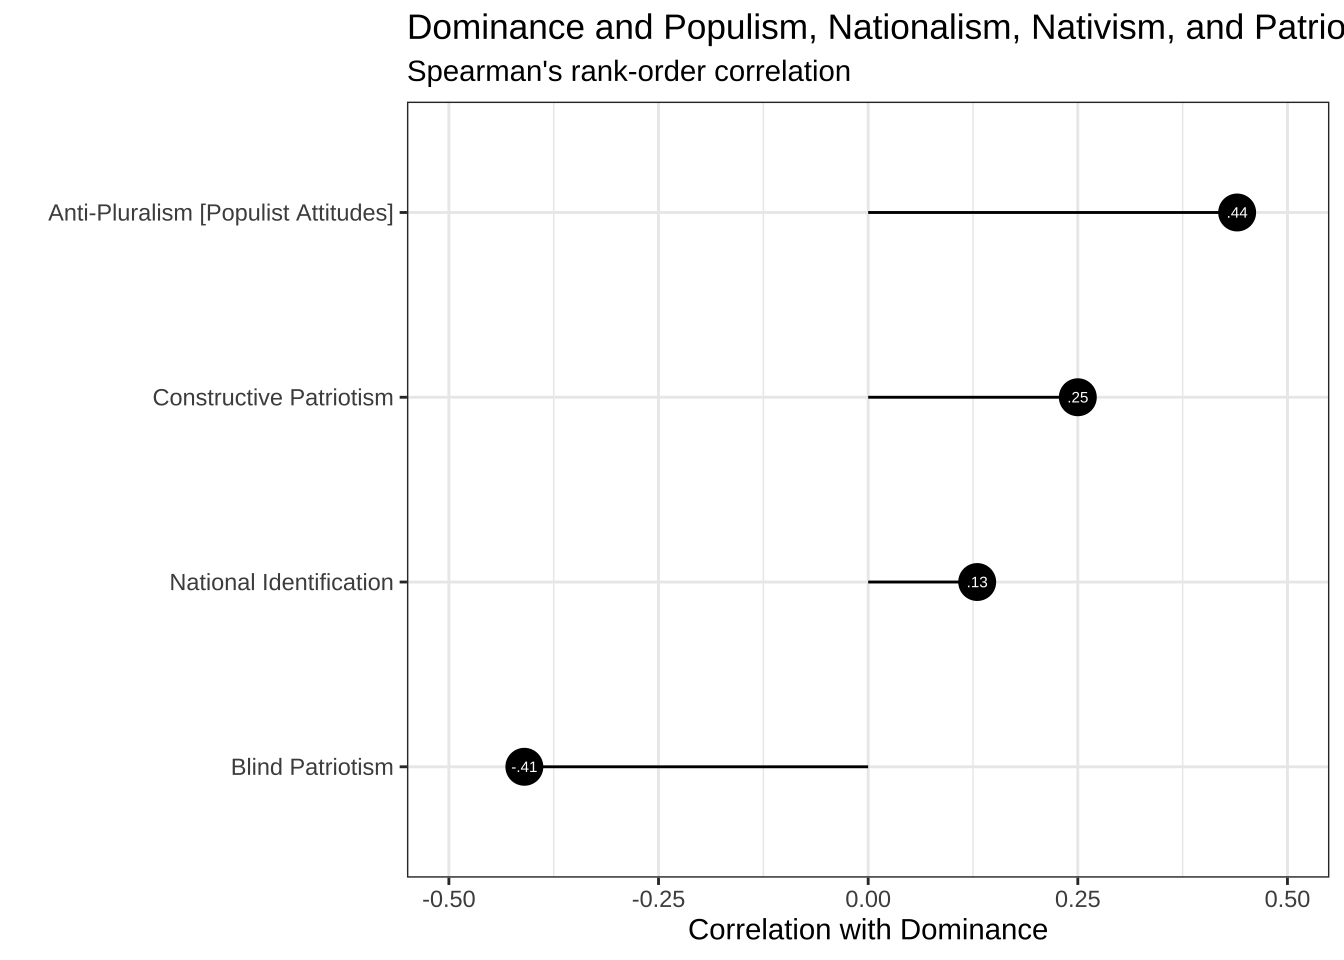
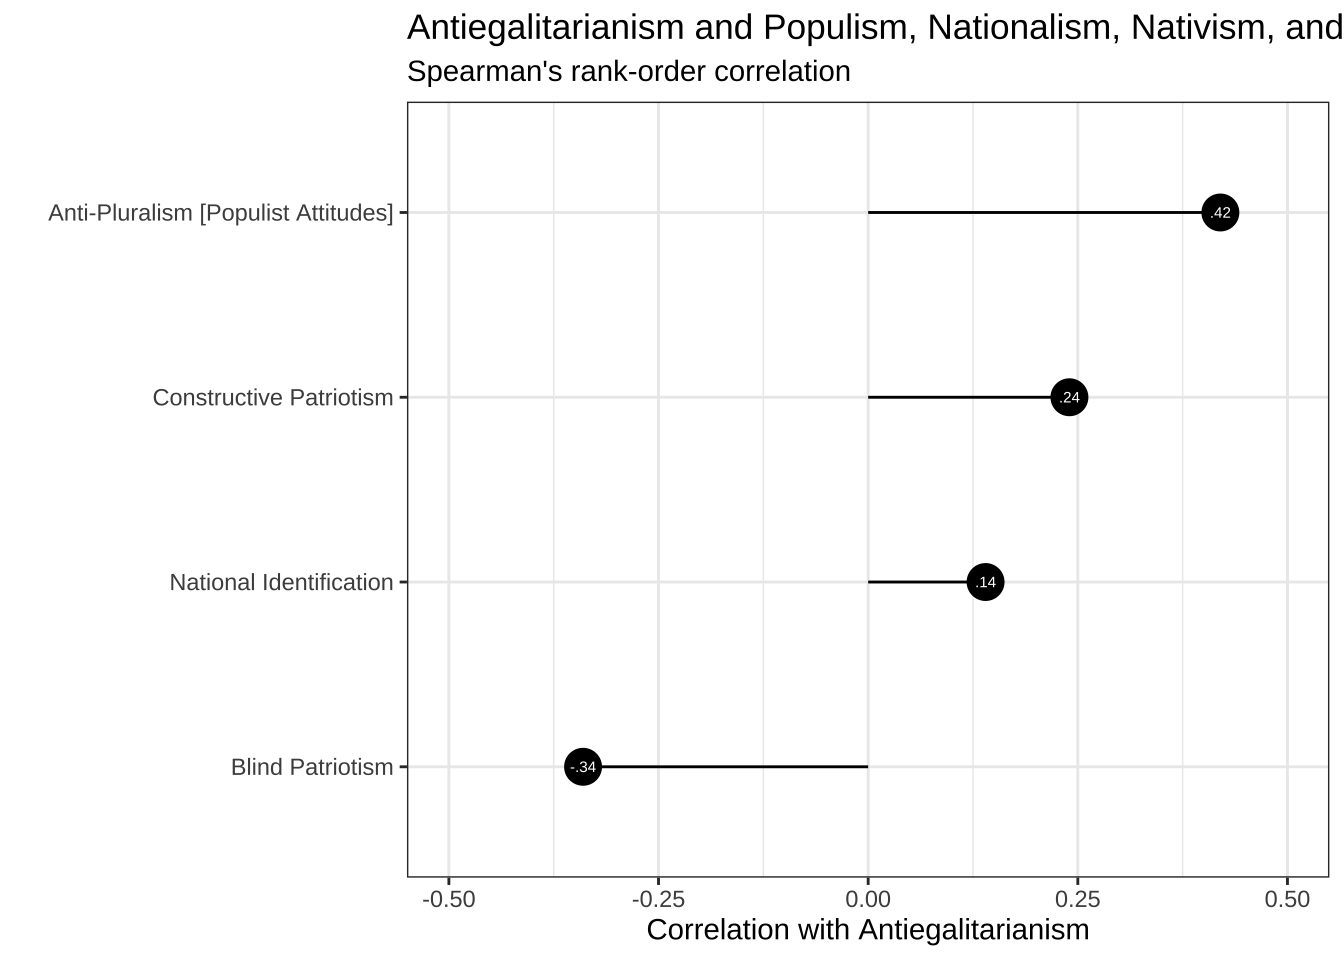
5.2 Populism, Nationalism, Nativism, and Patriotism


5.3 Political Psychology
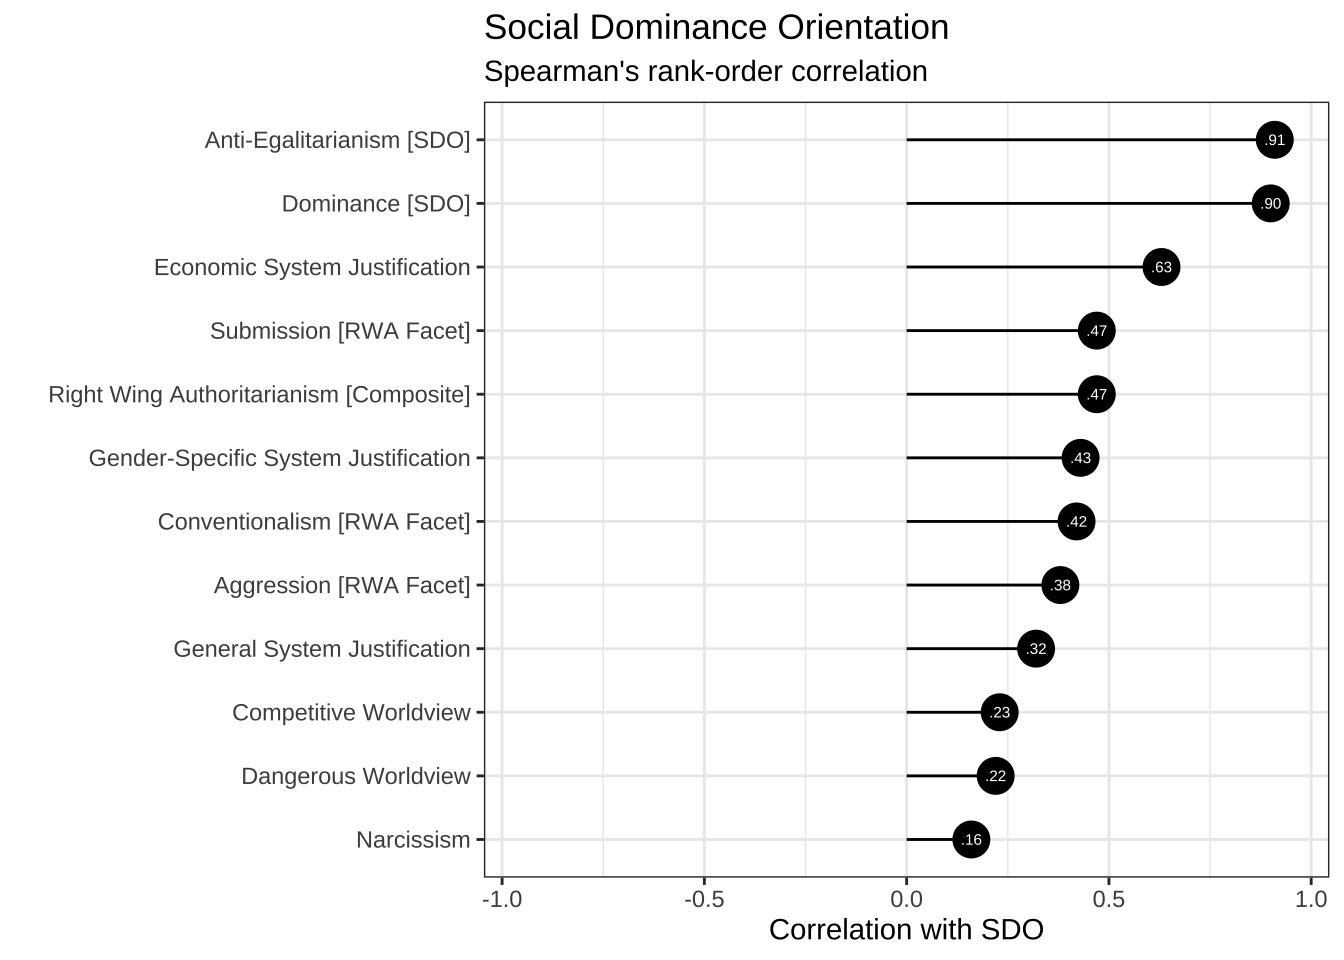

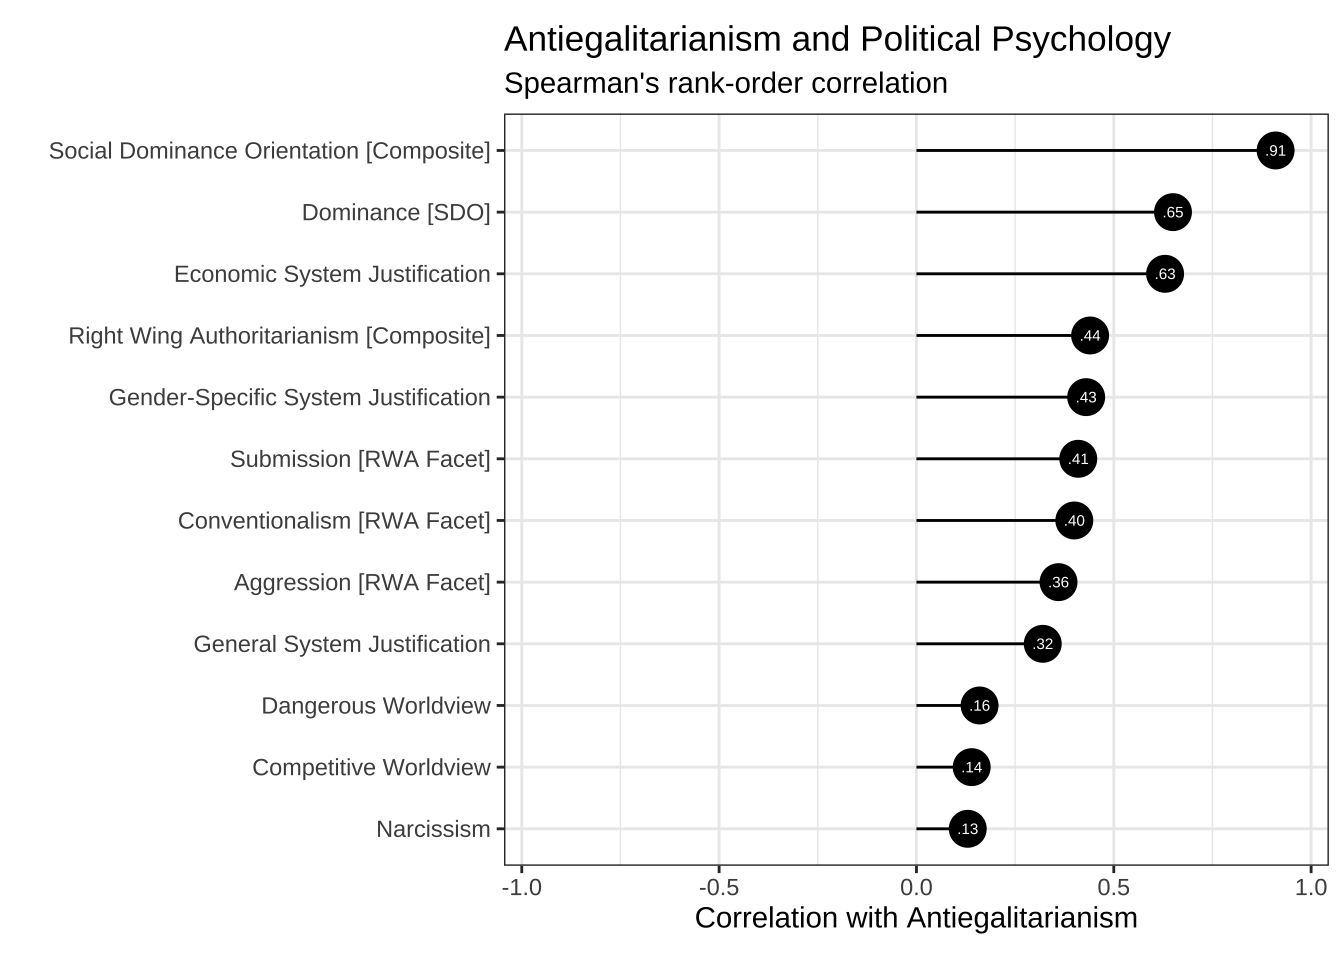
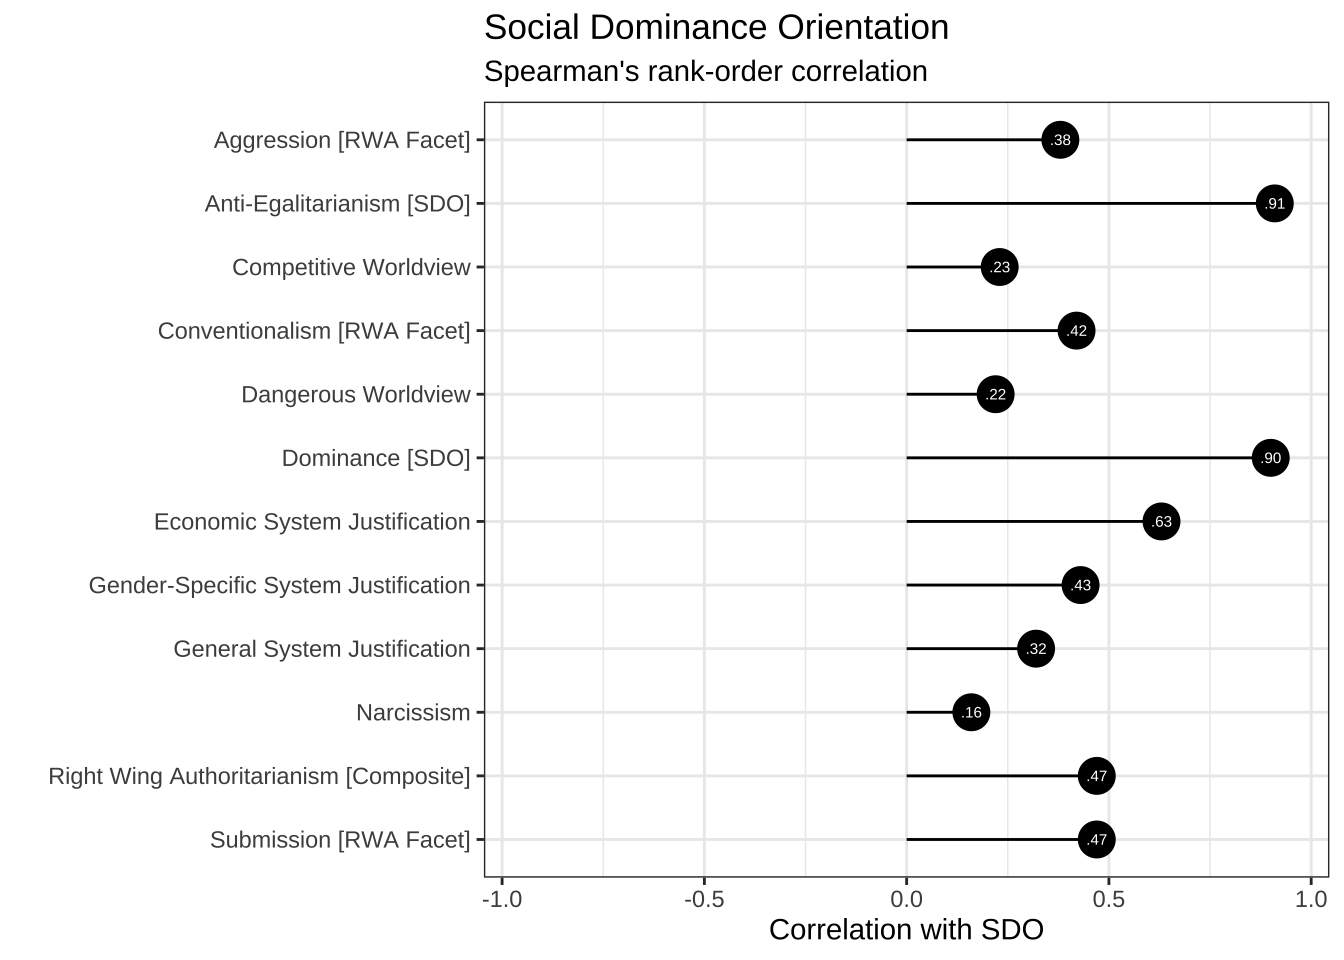
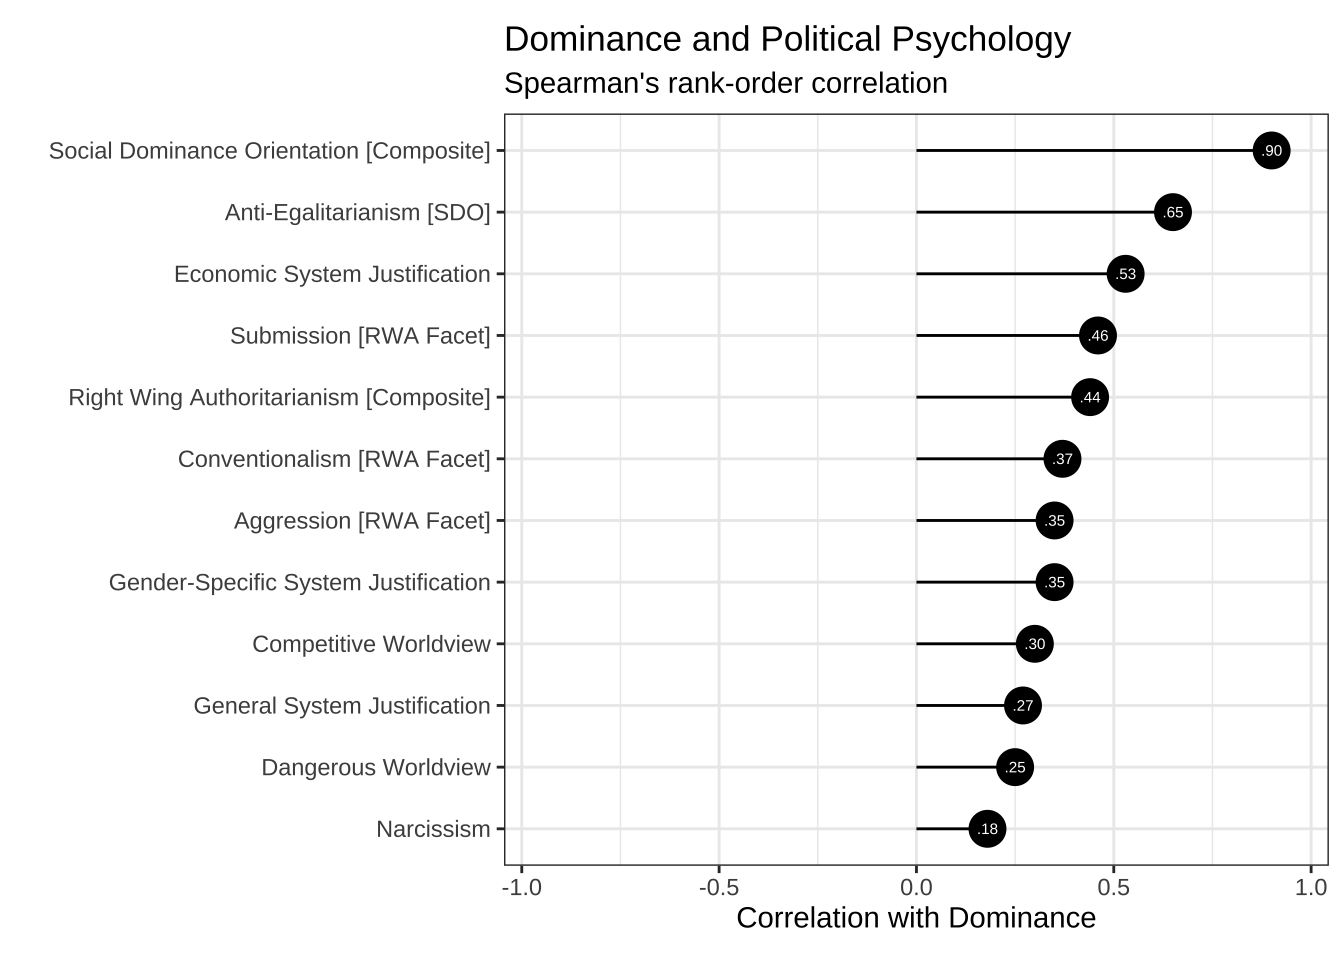

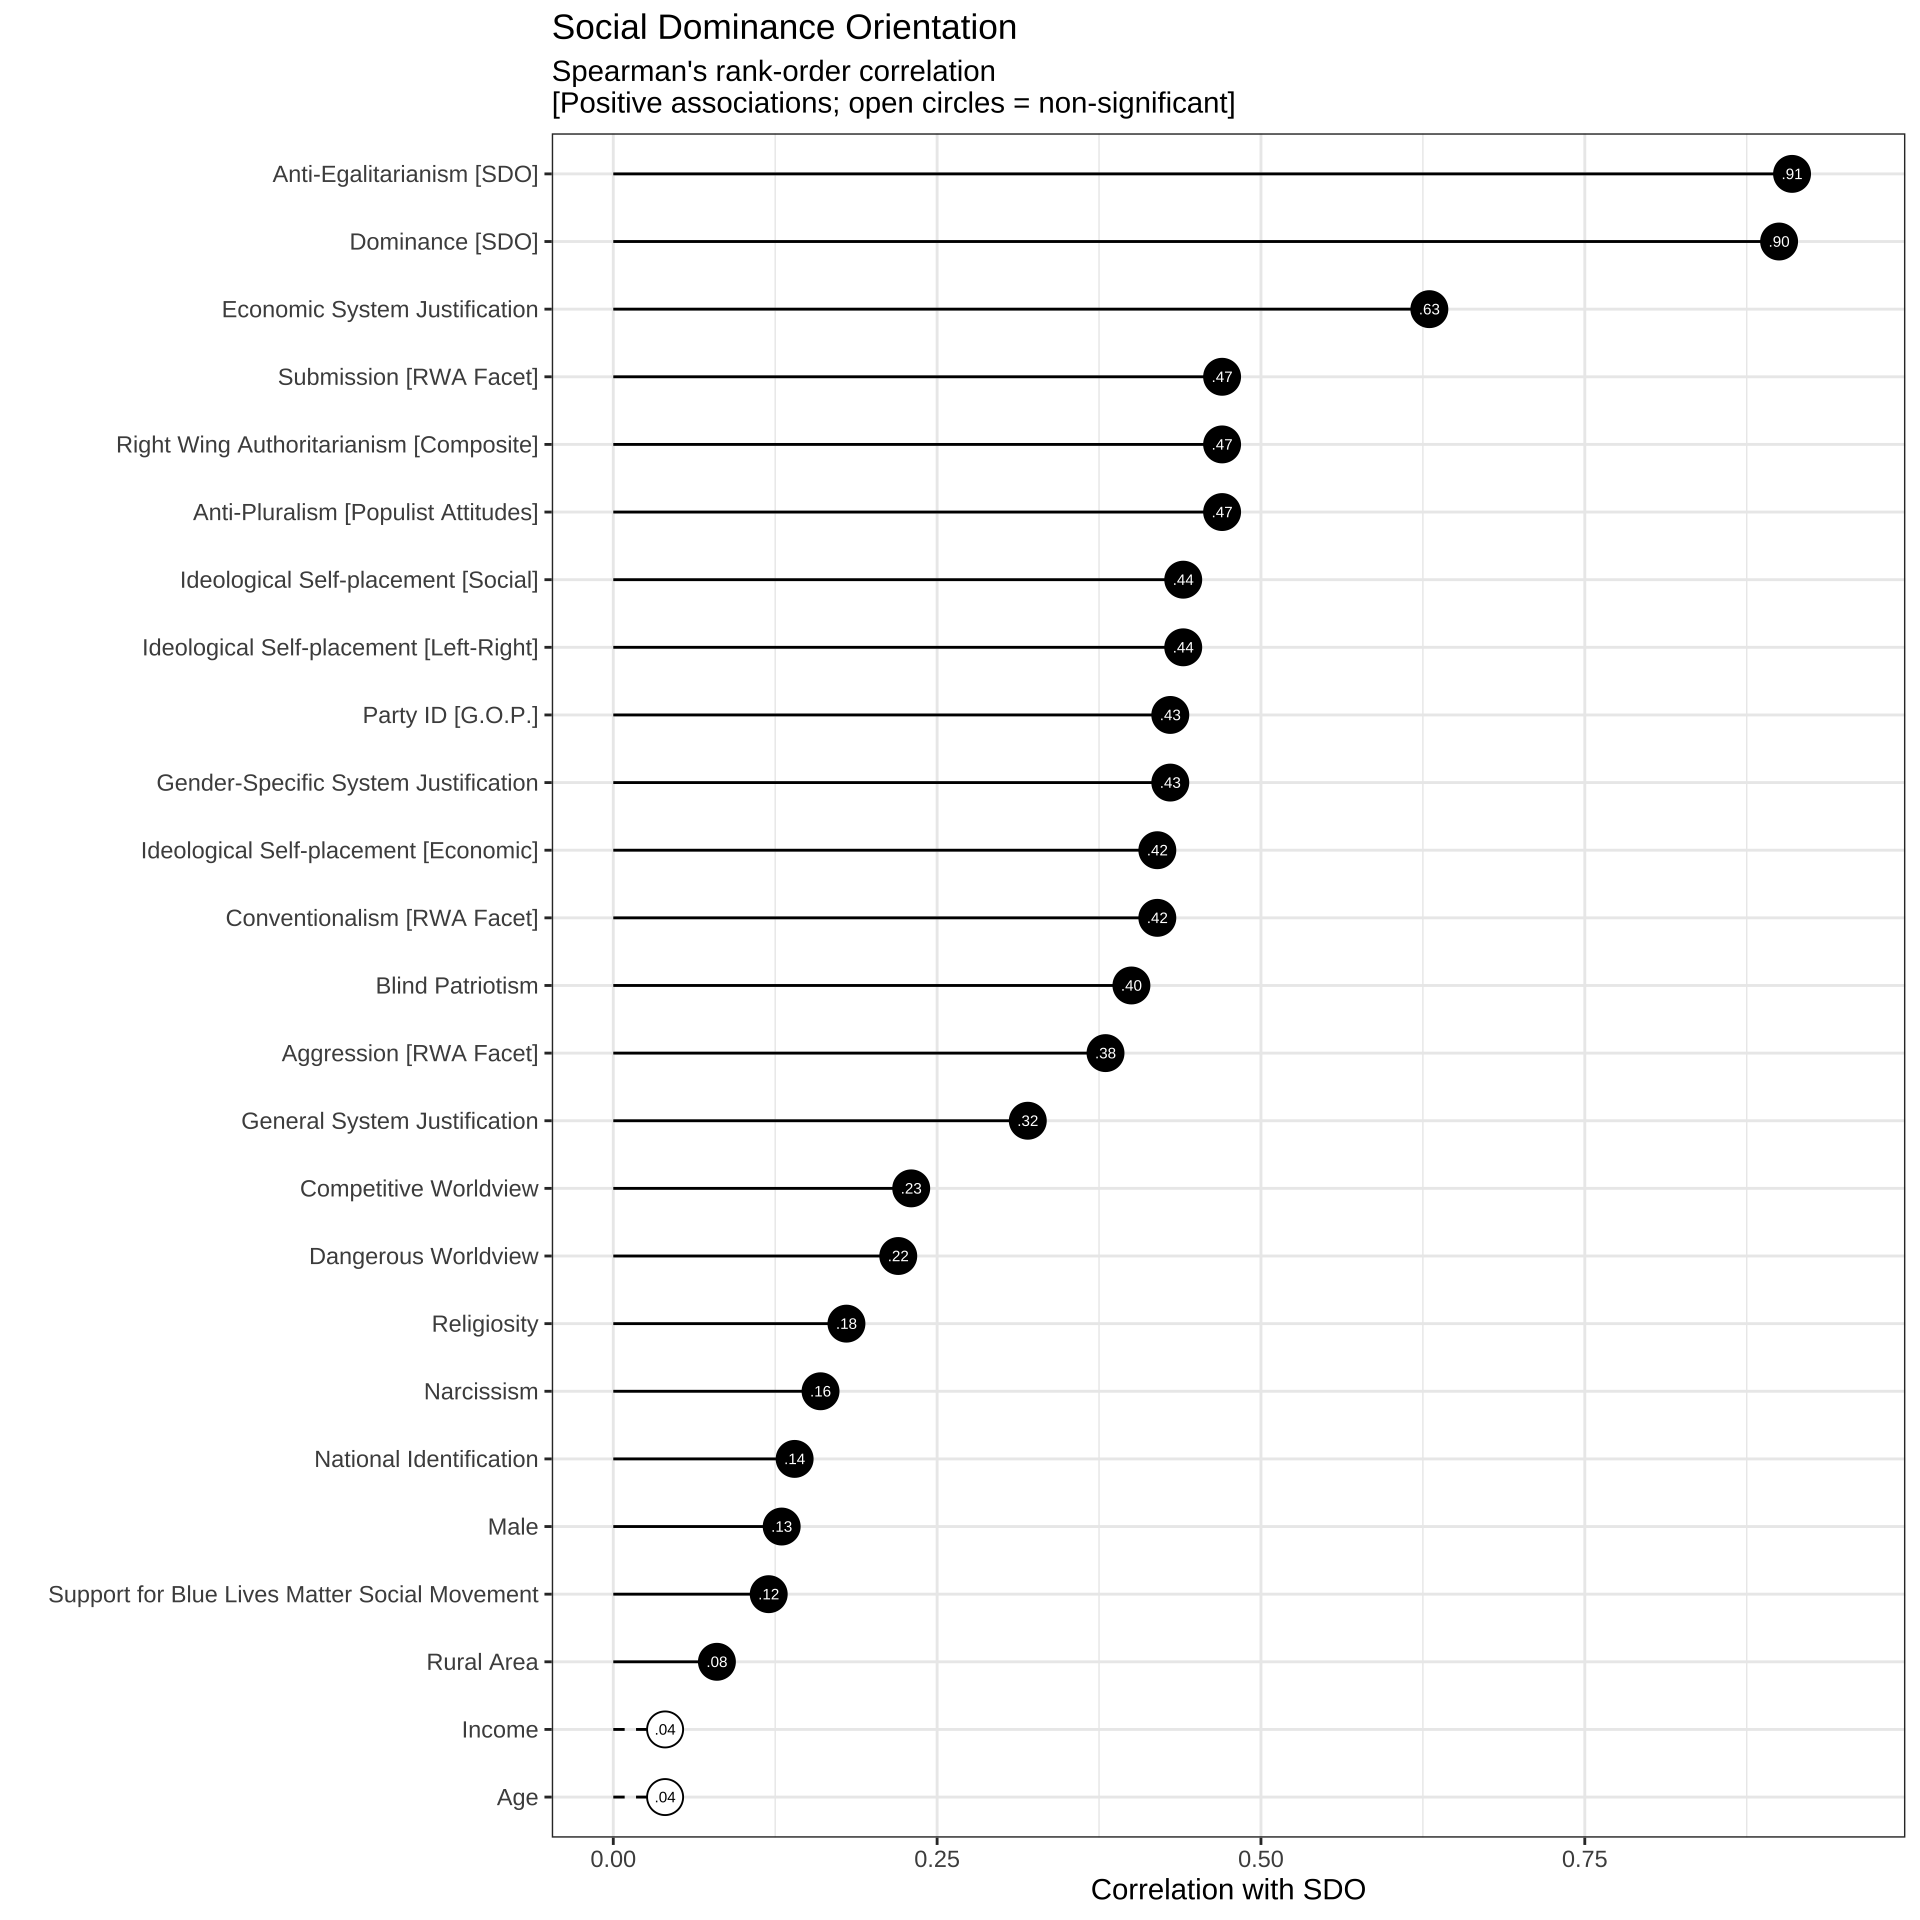
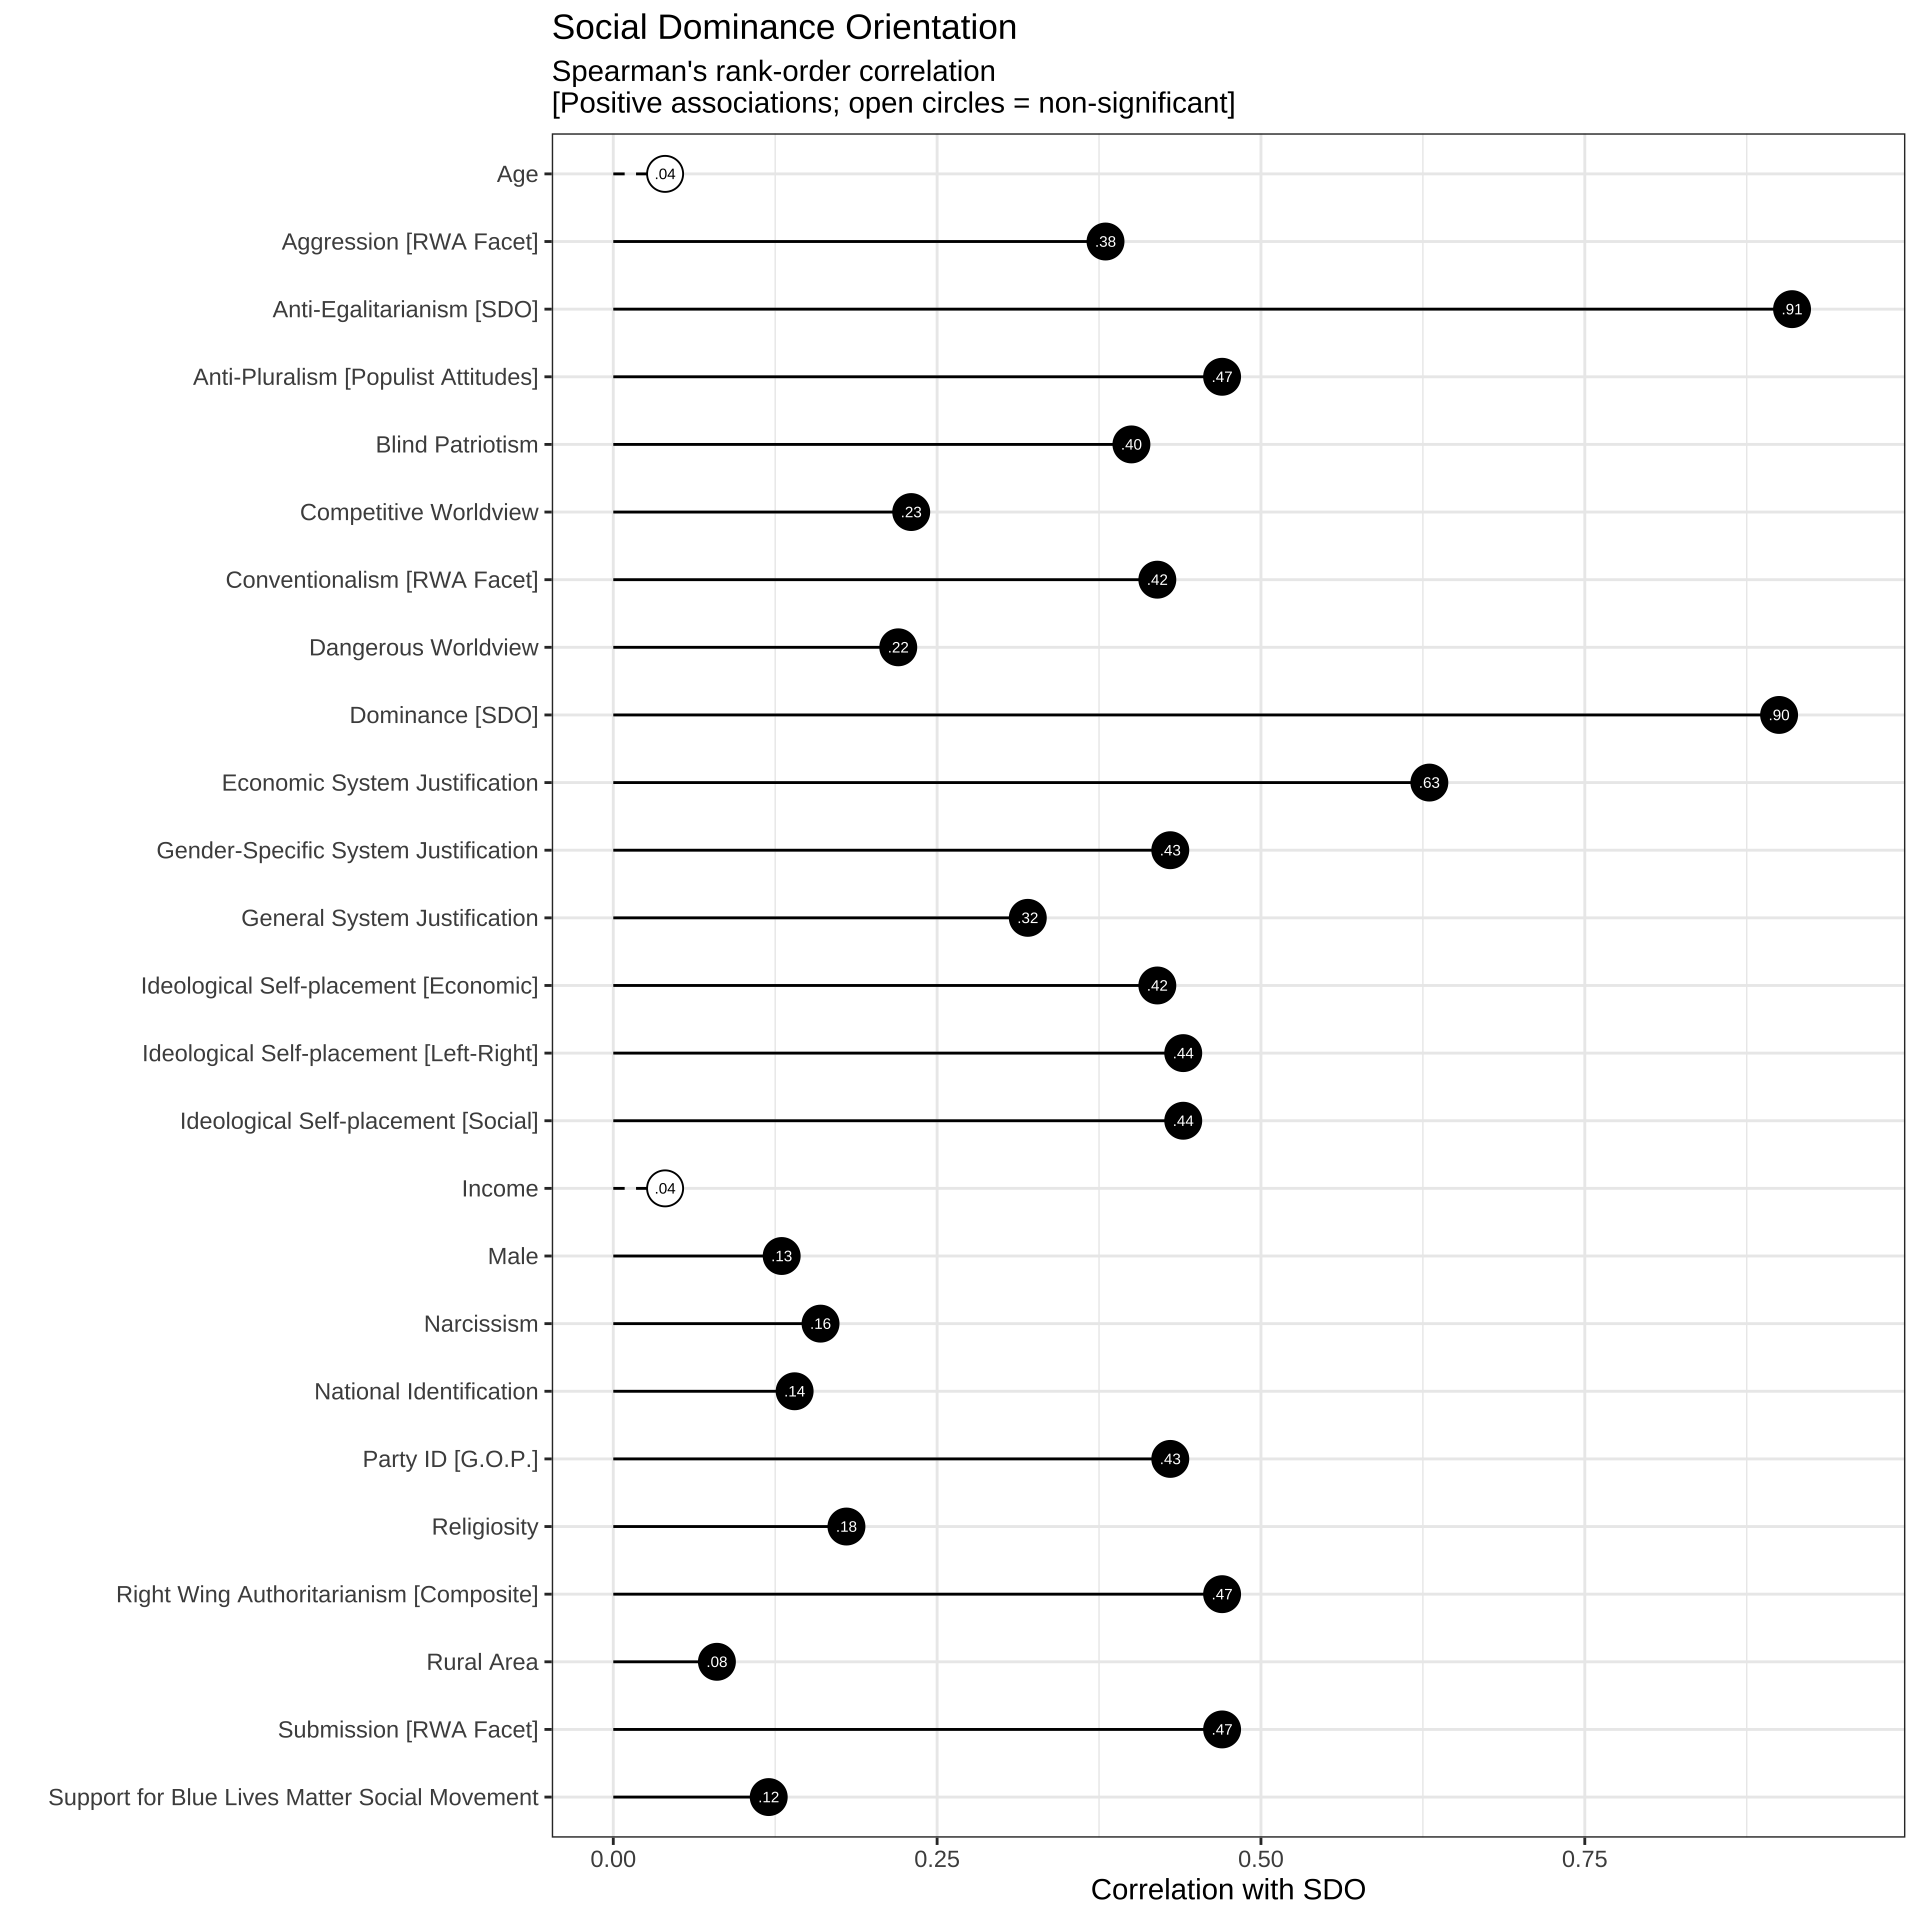
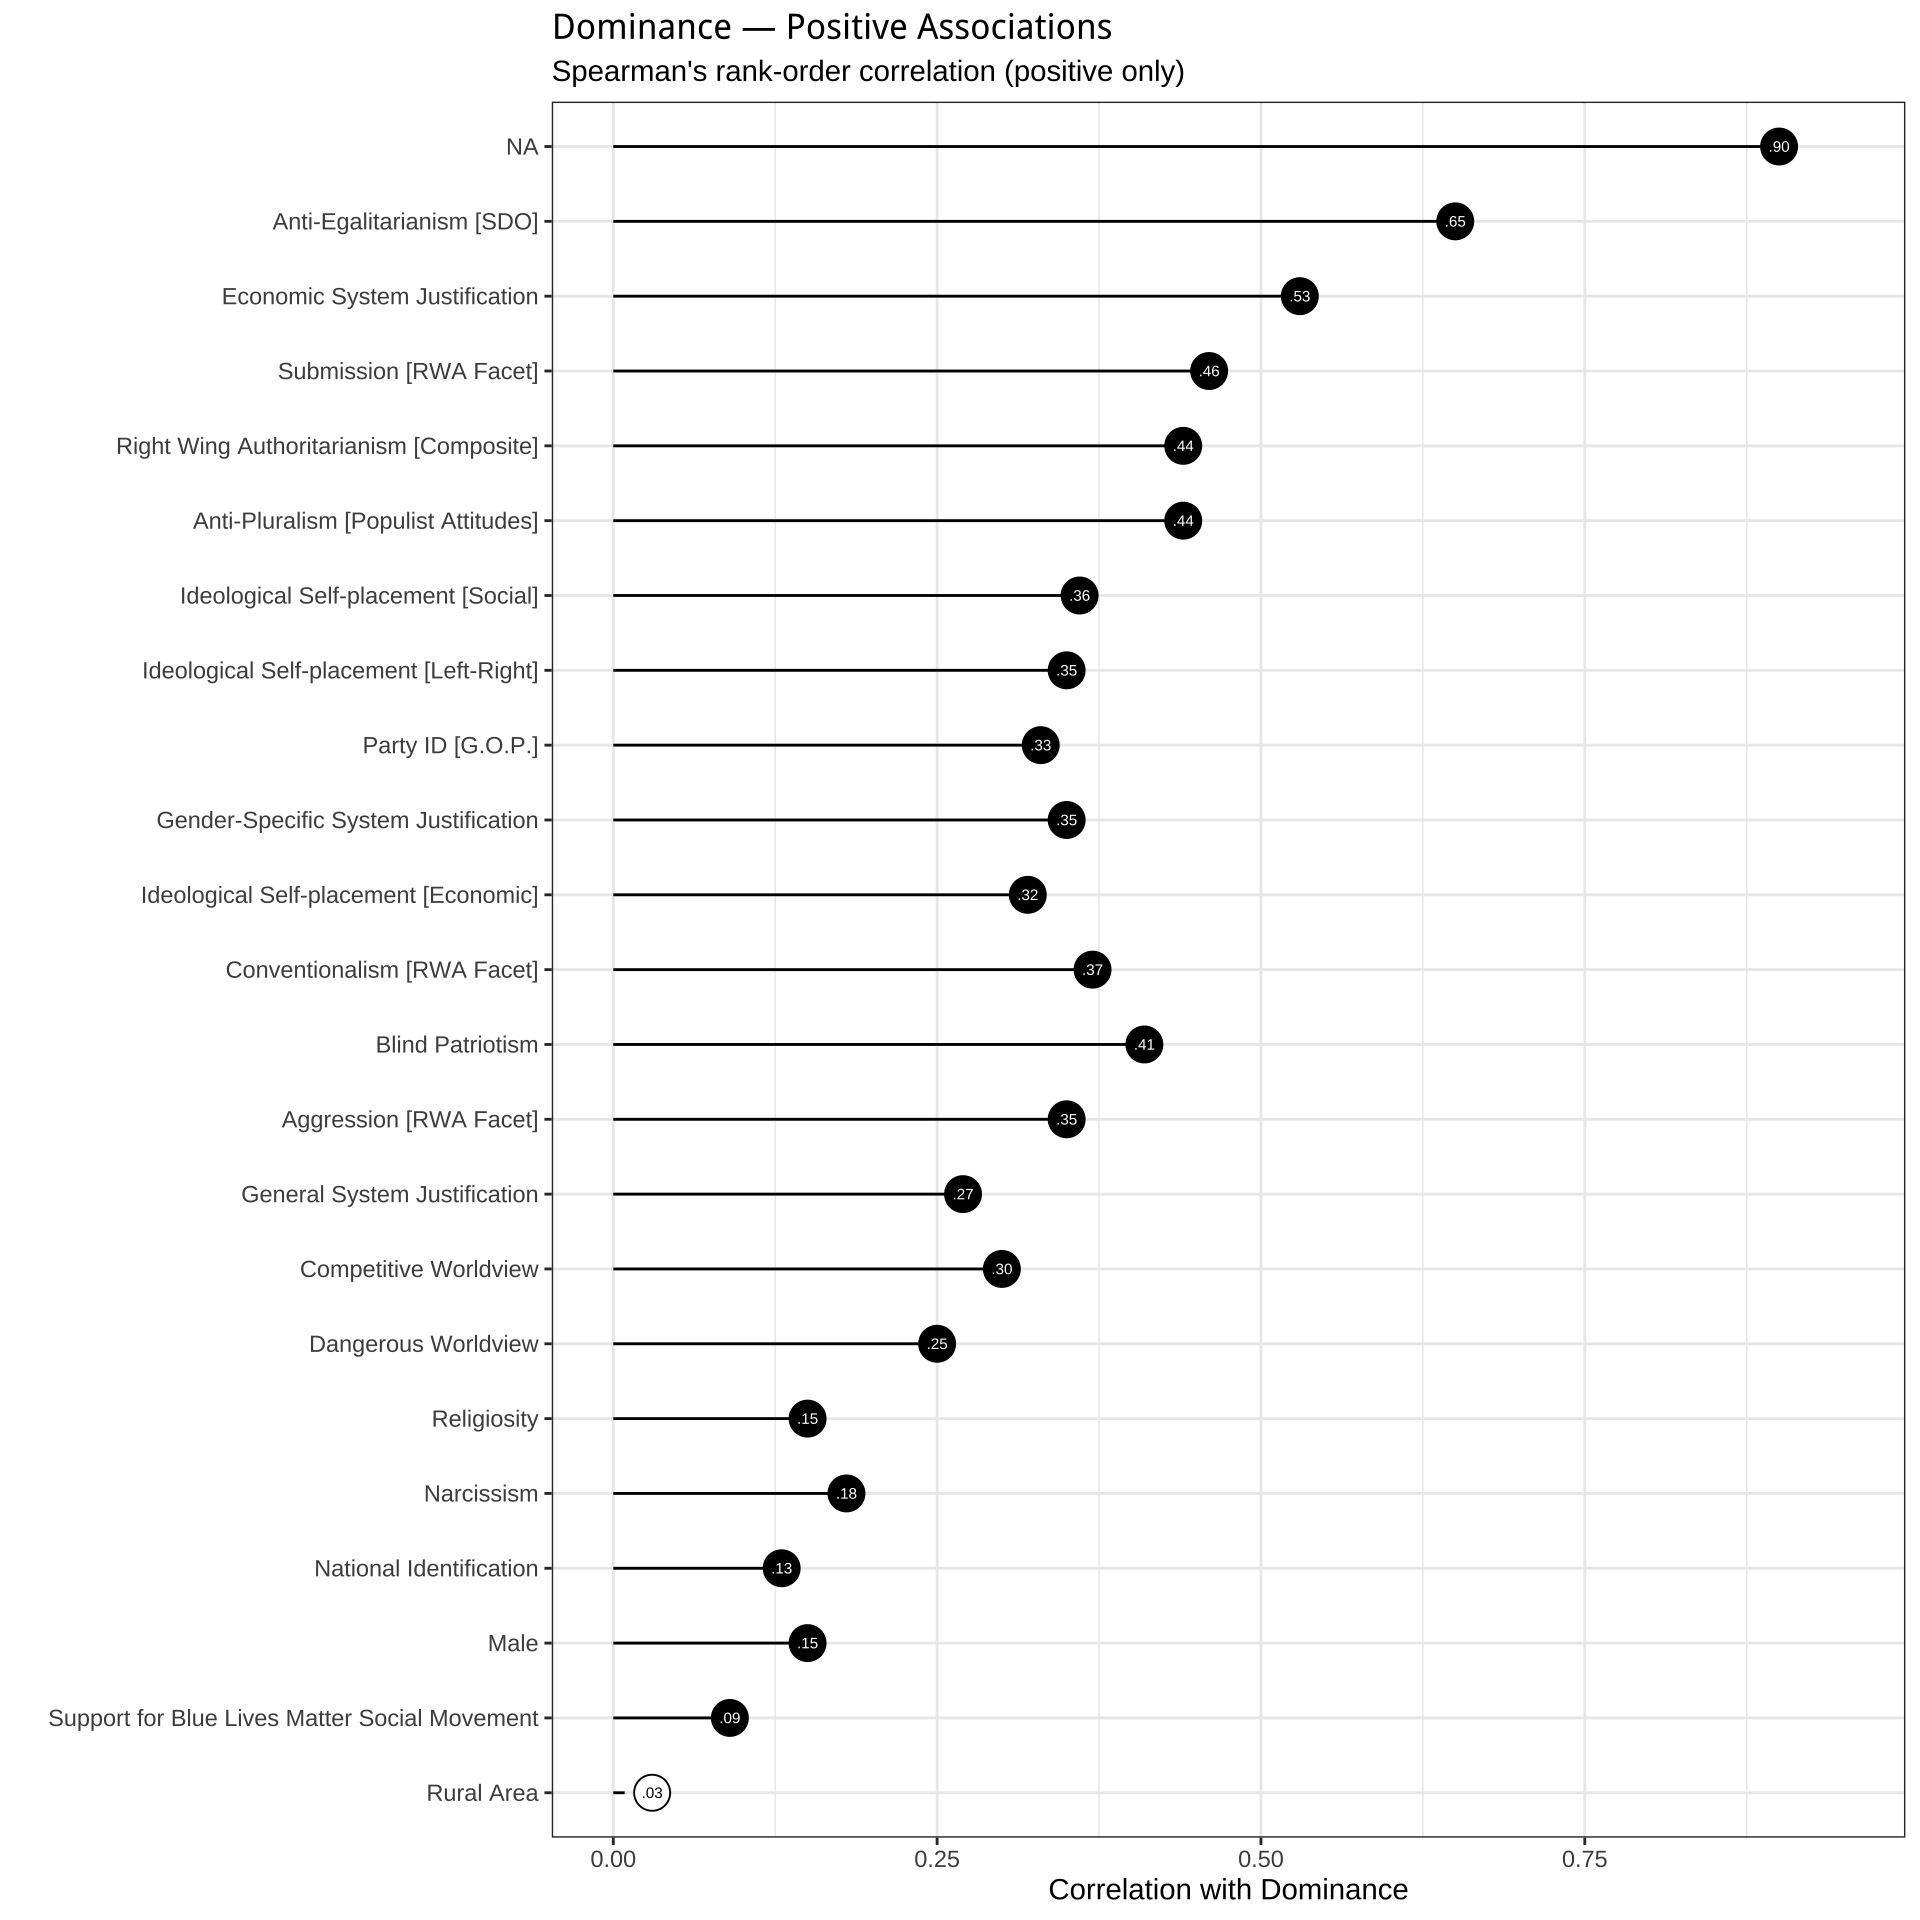
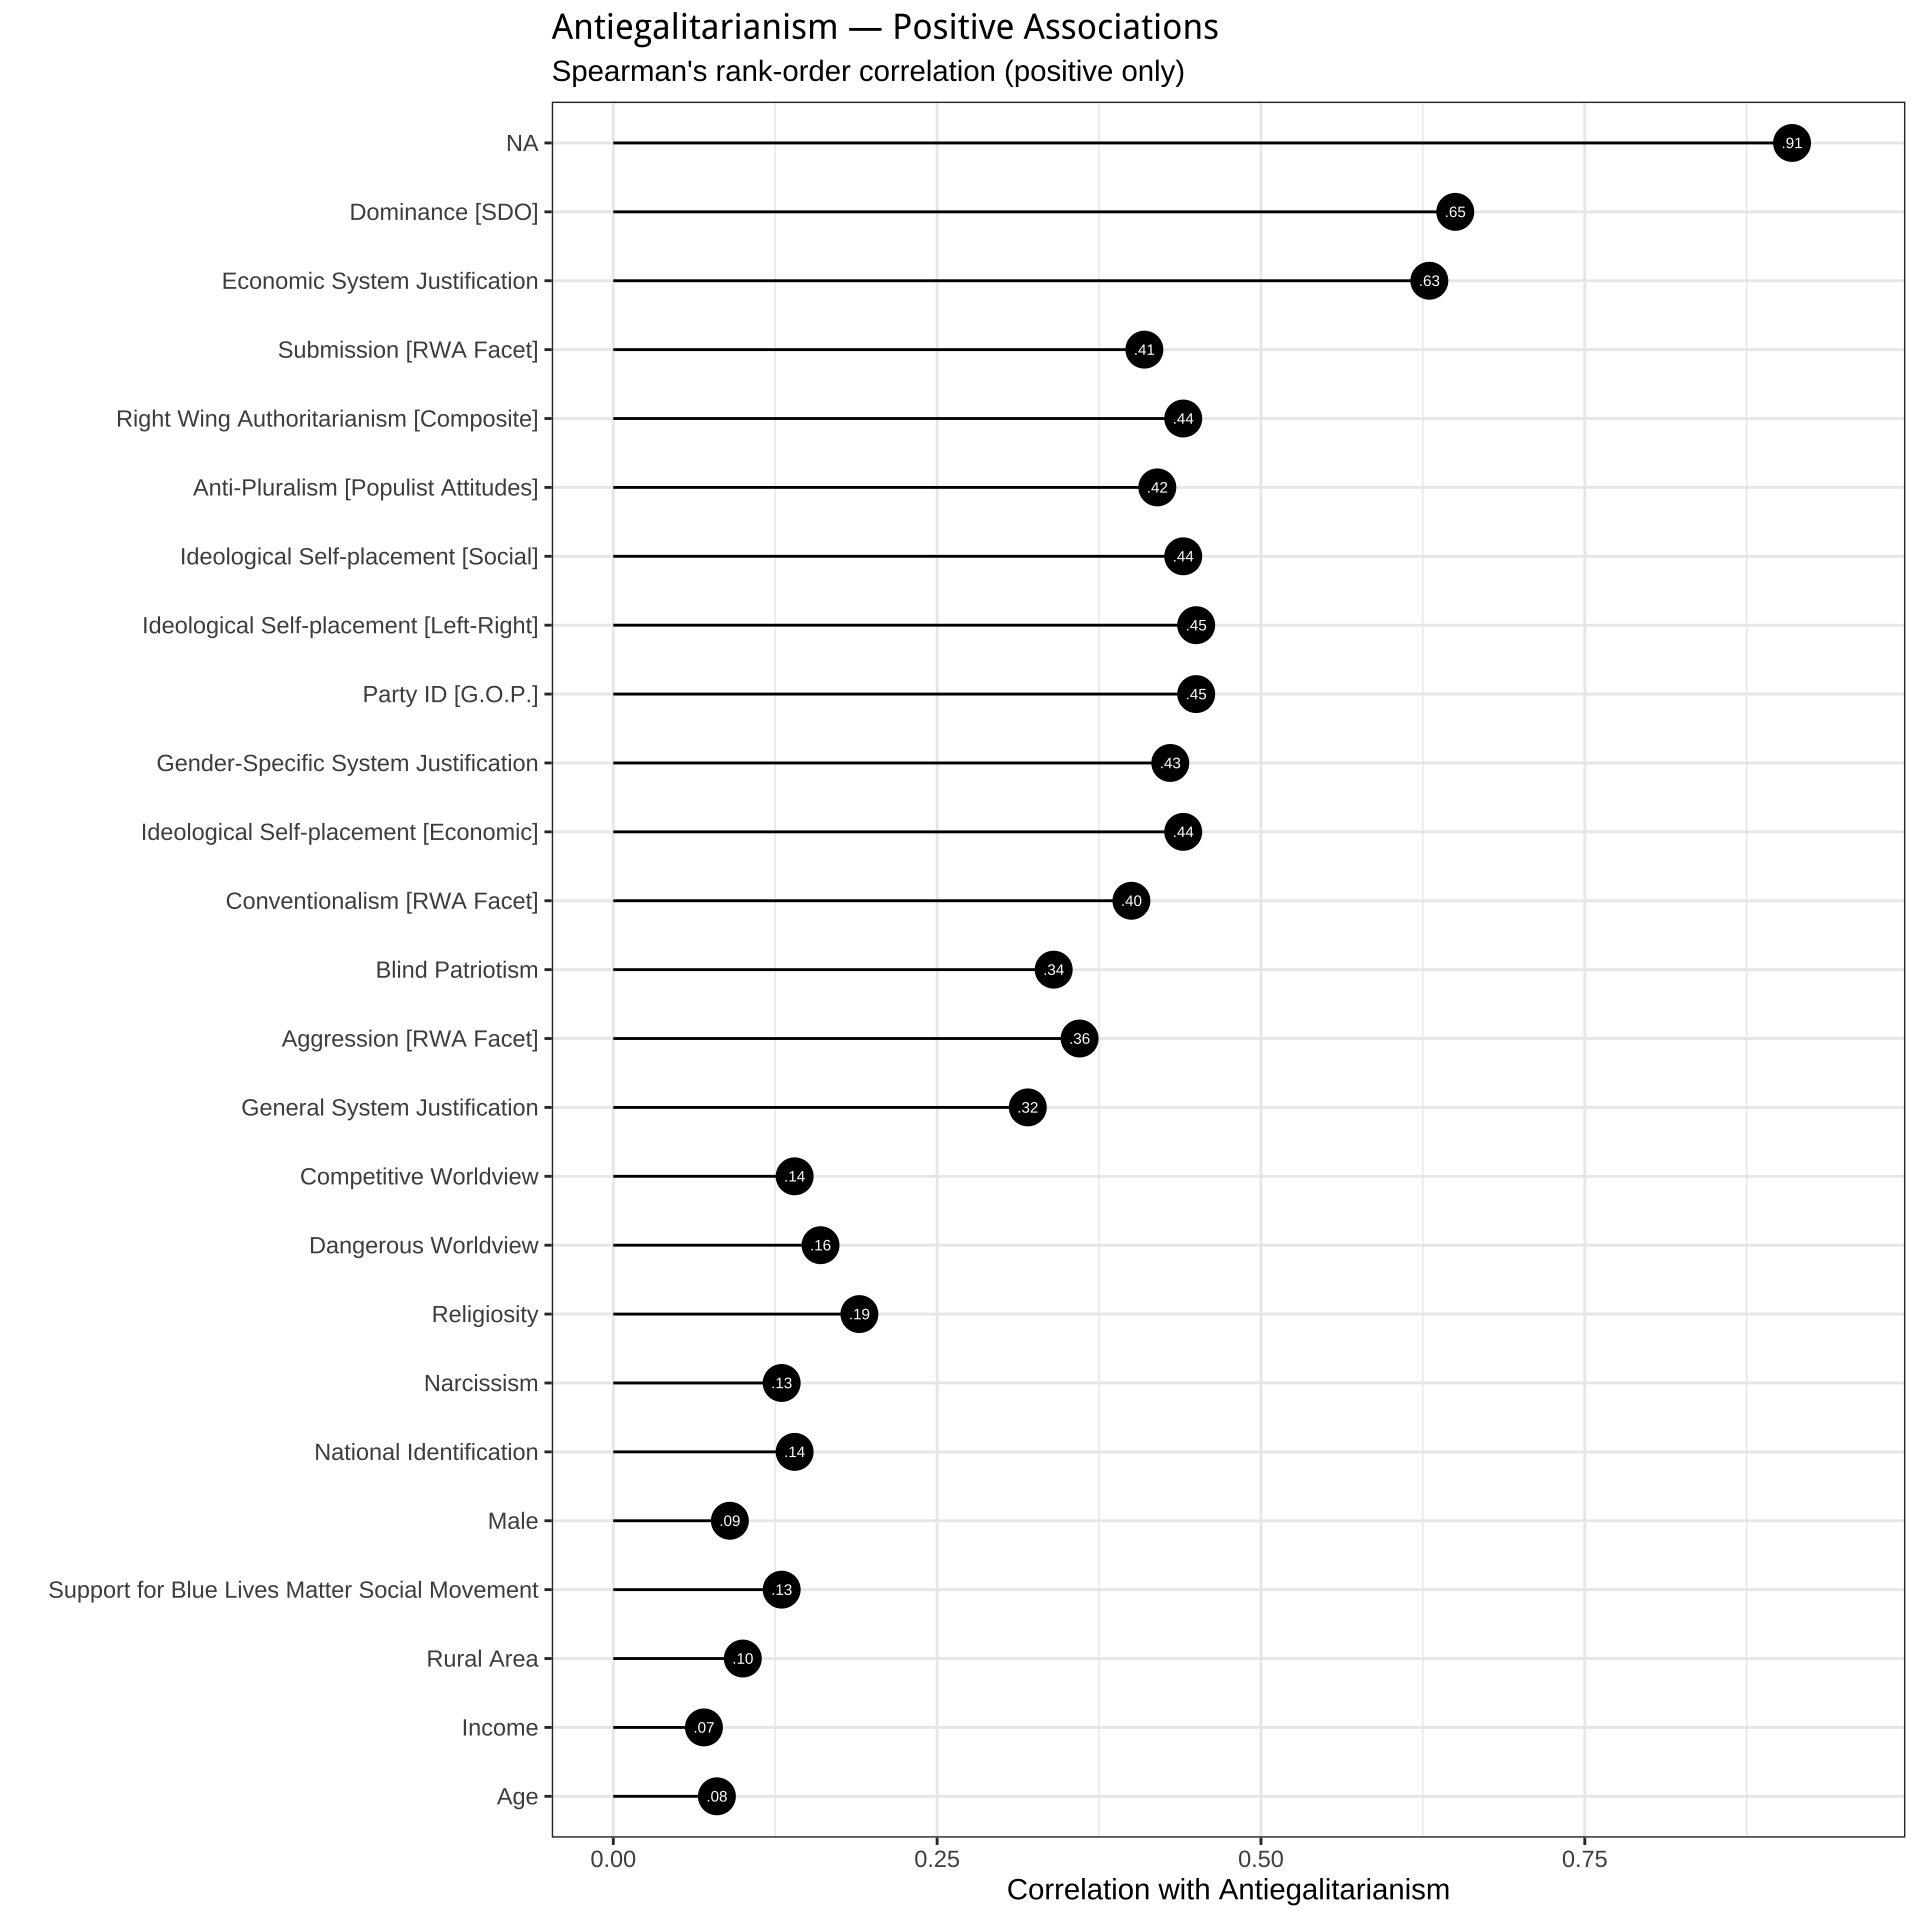
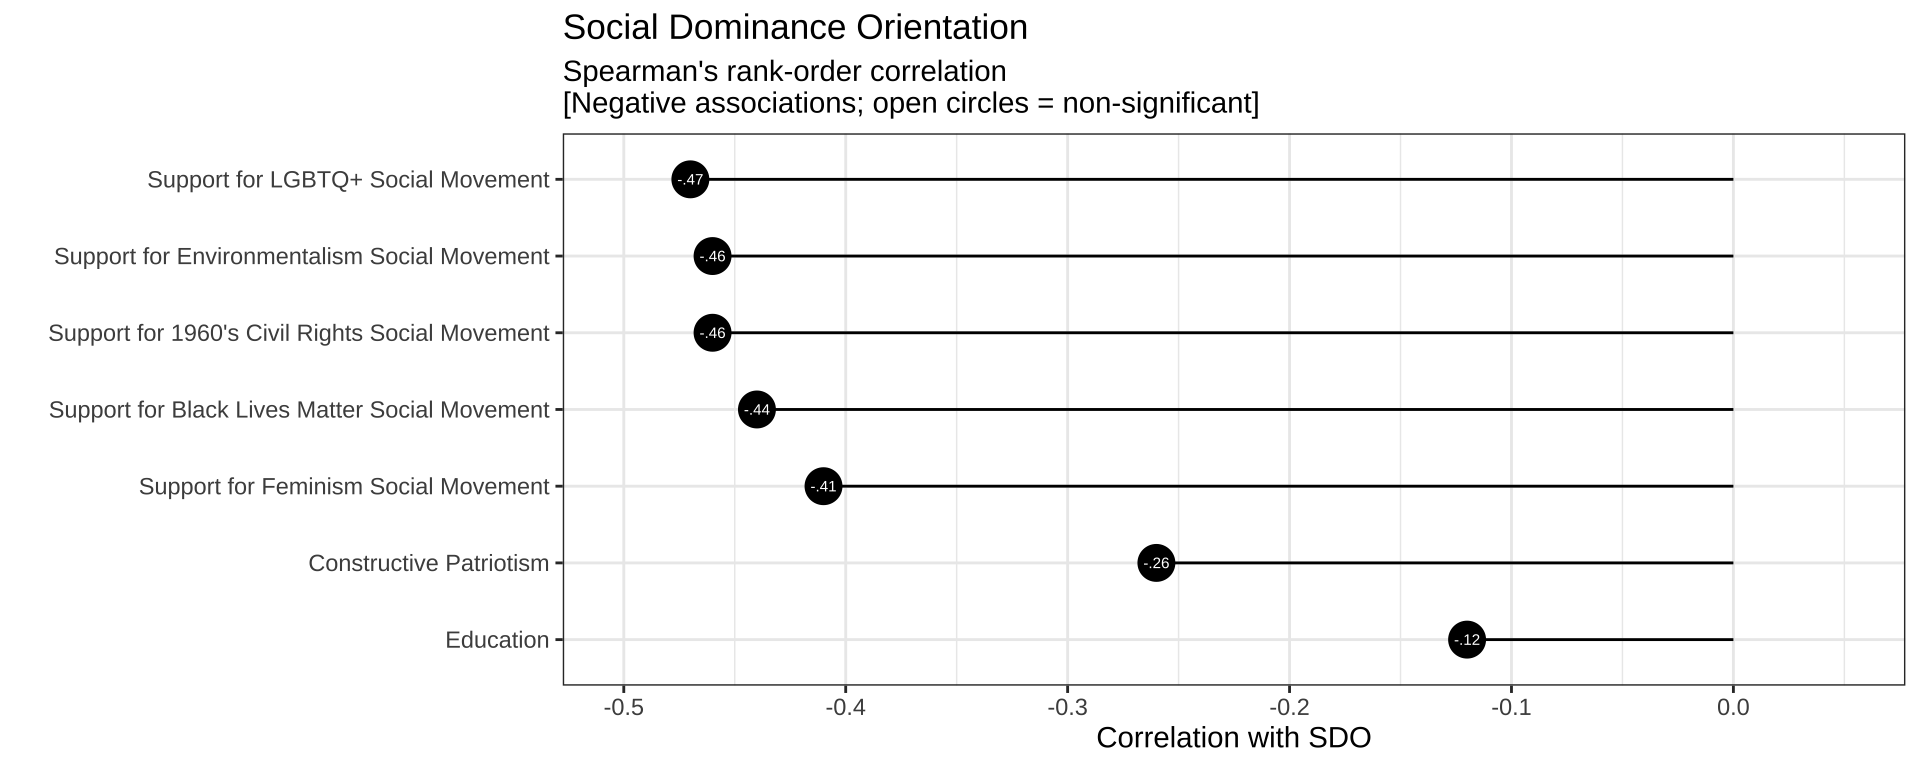
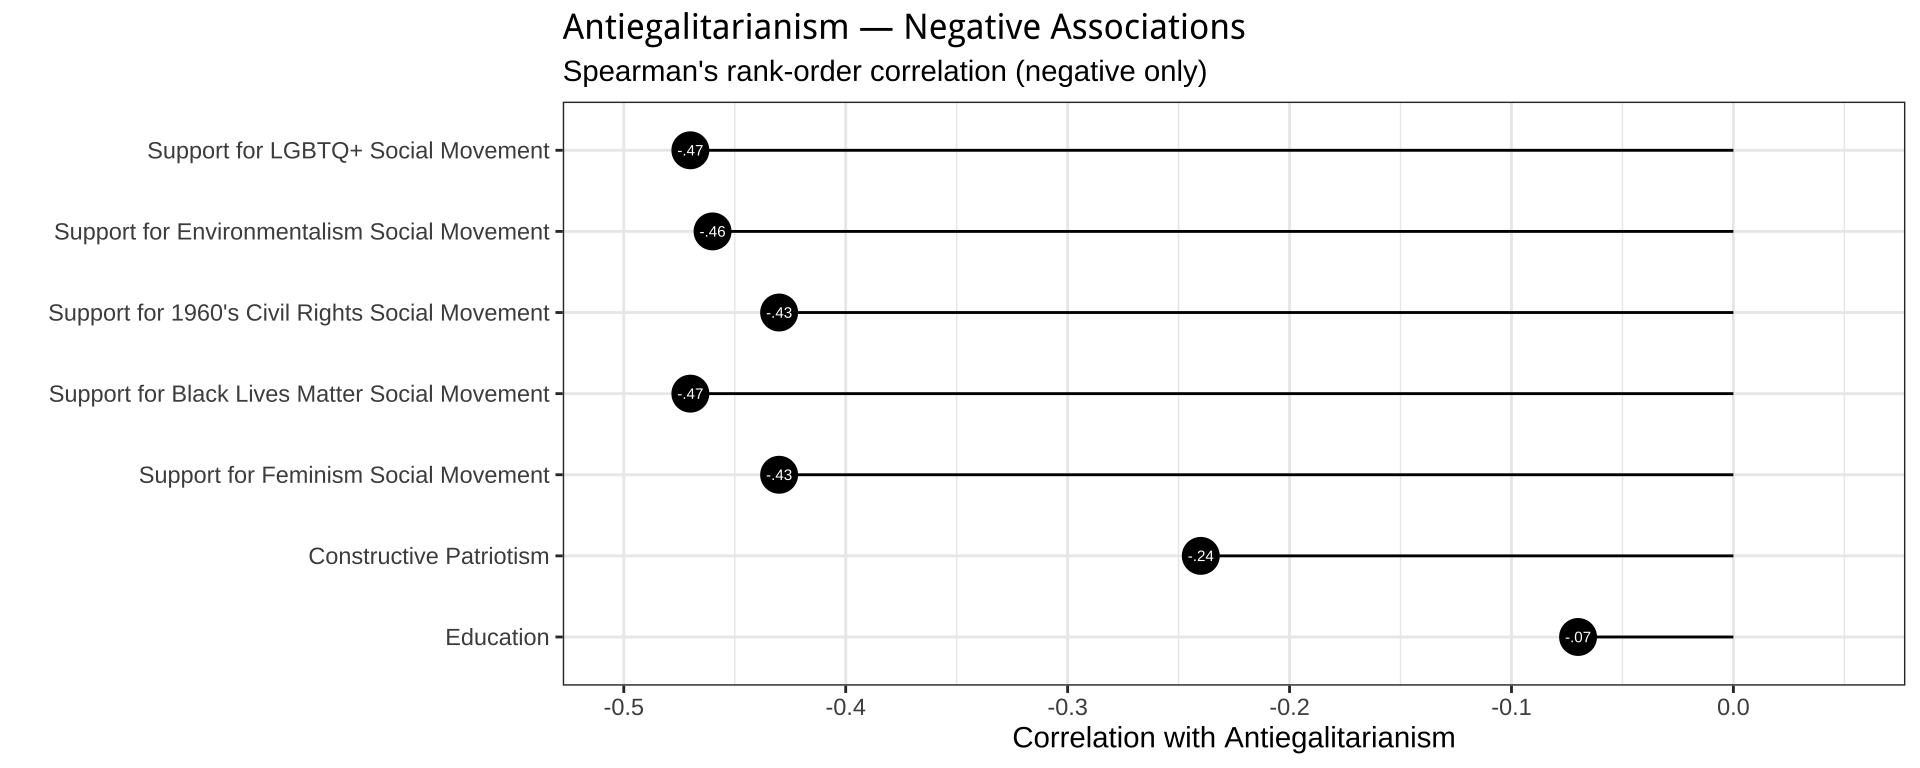
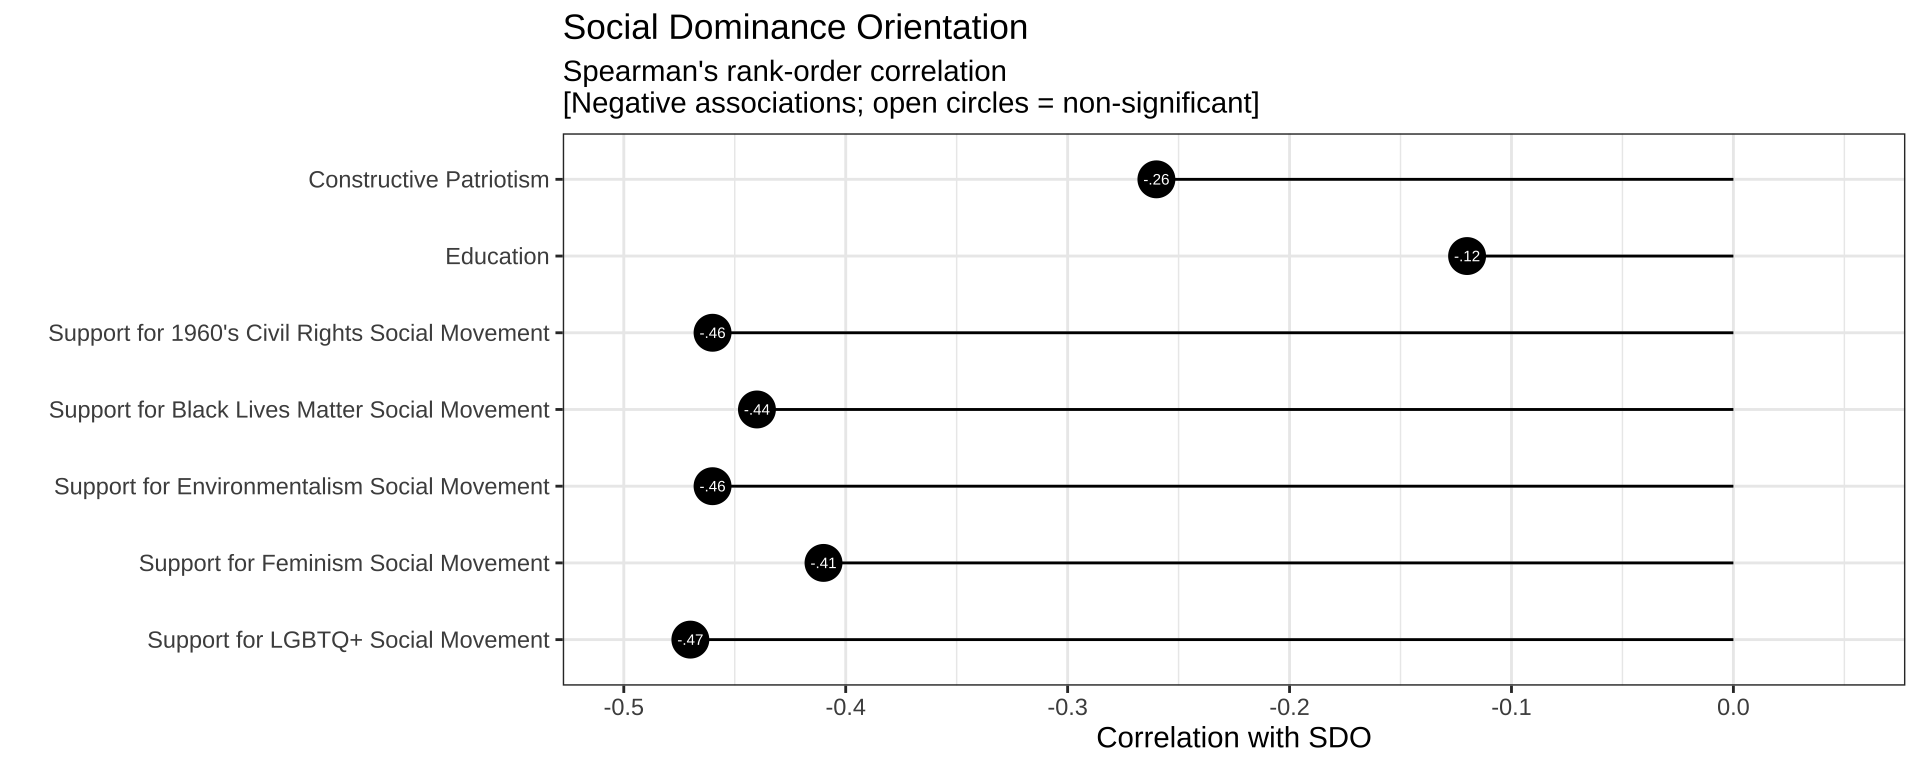
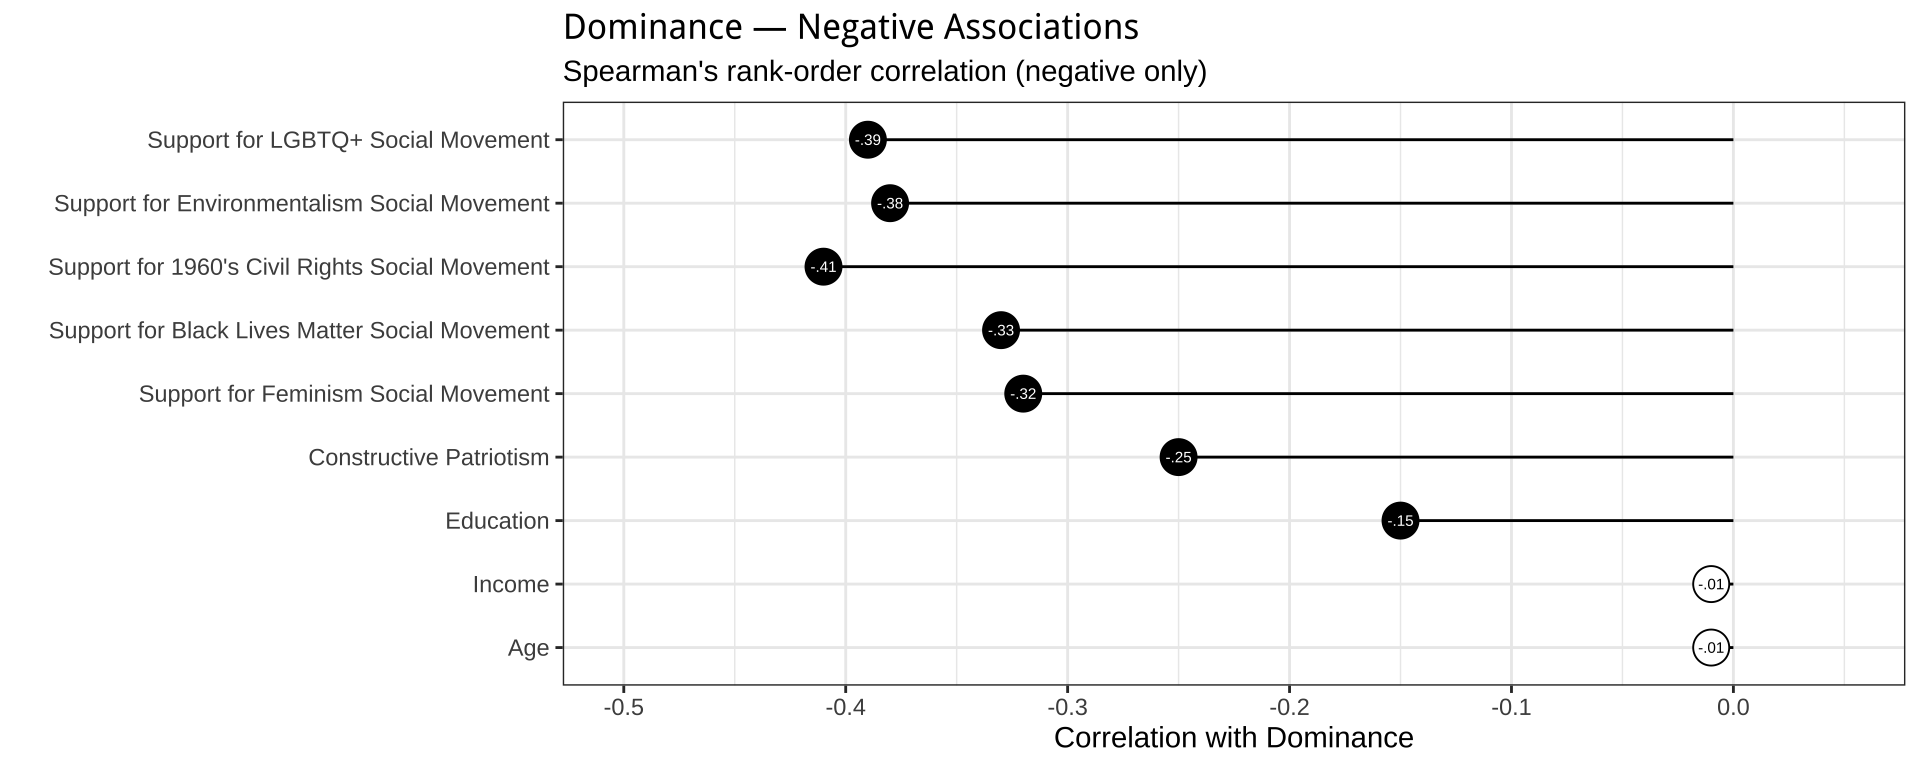
5.4 Positive and Negative correlates of Social Dominance Orientation


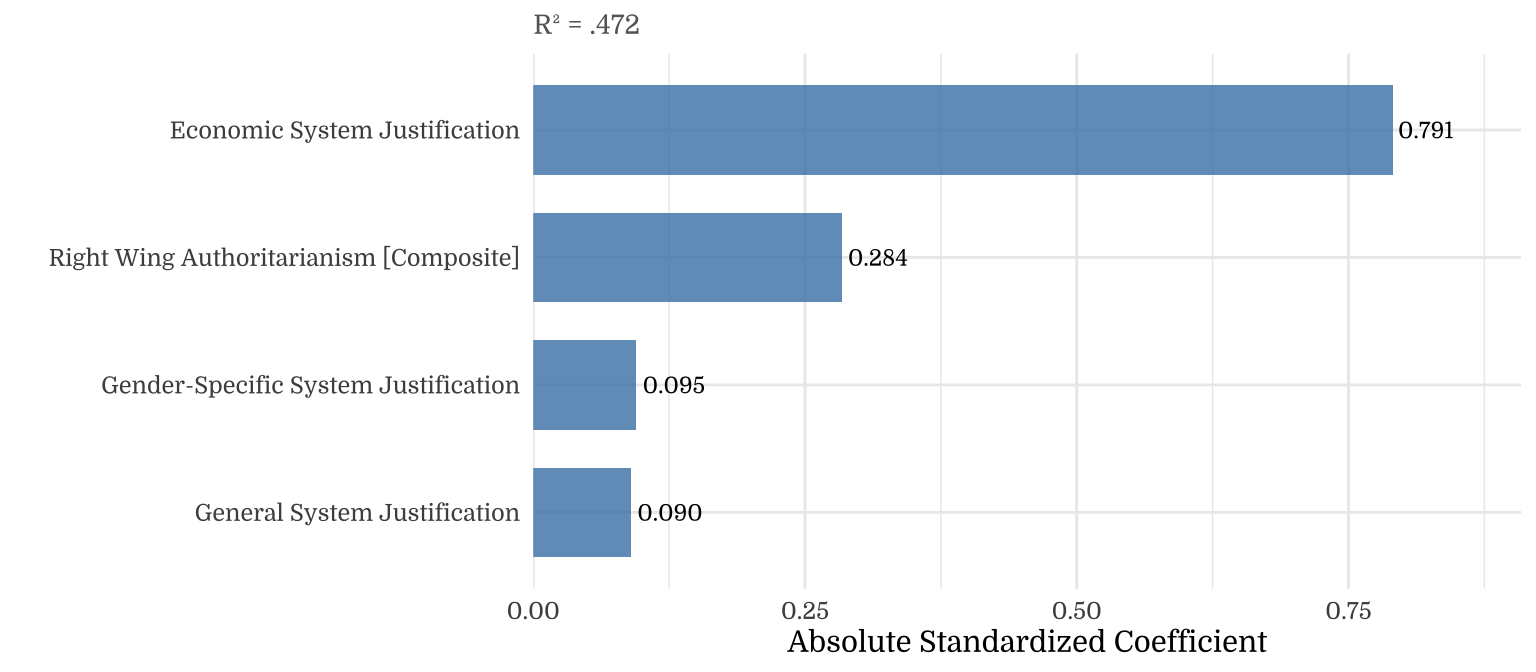
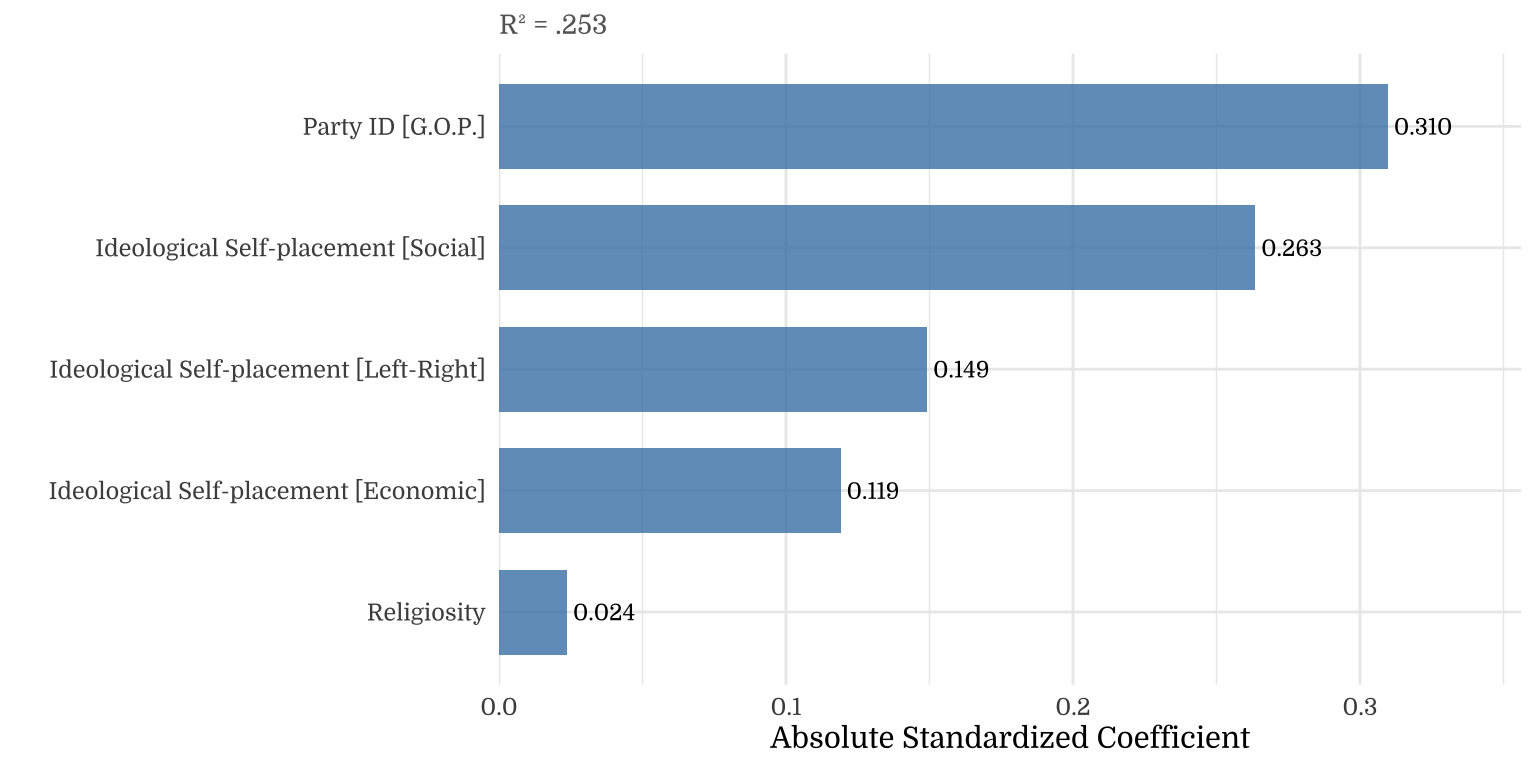
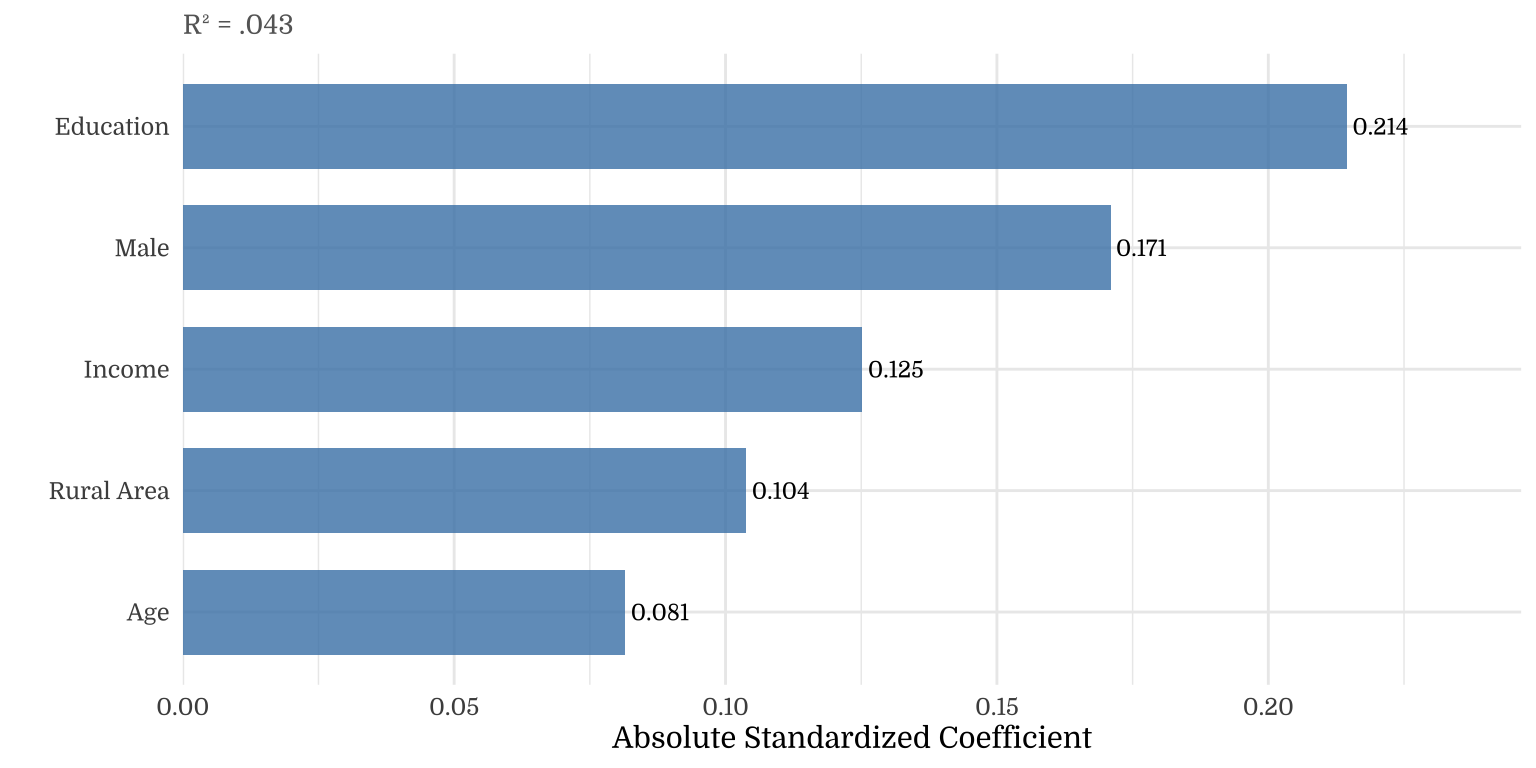
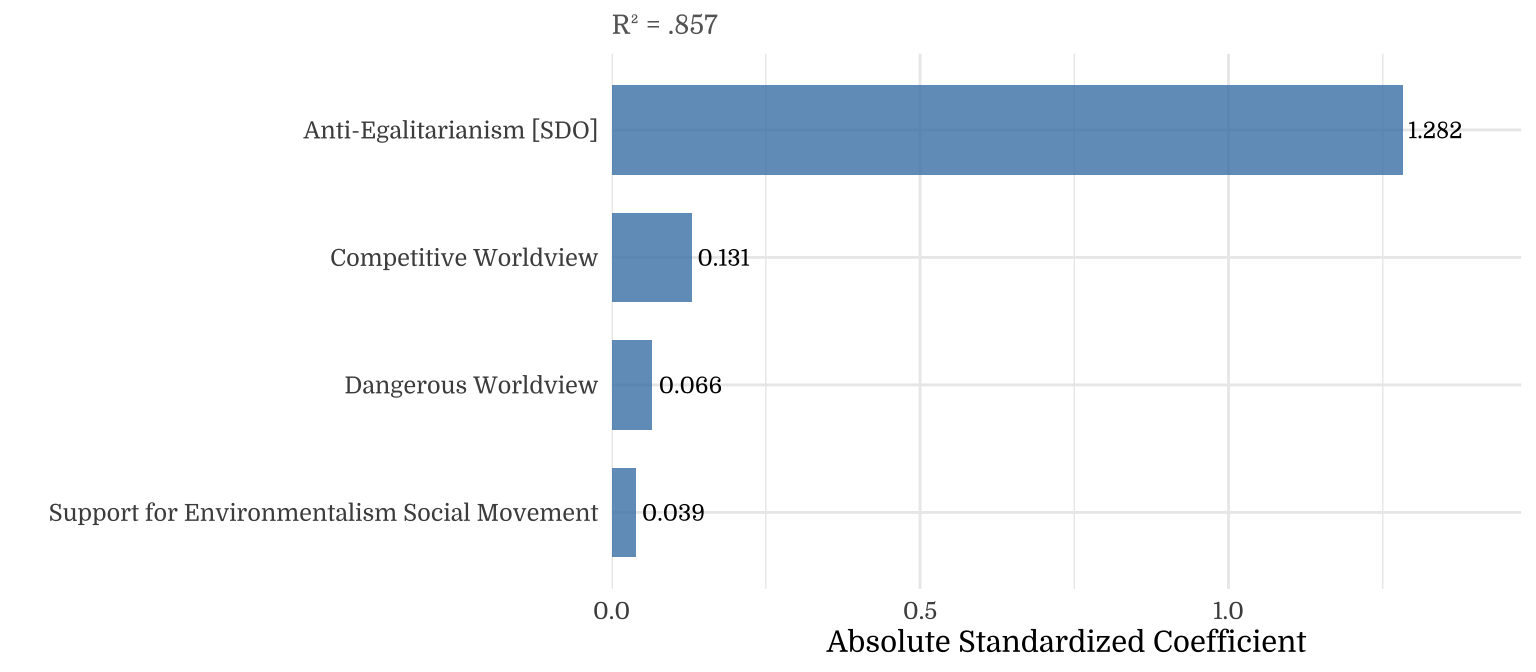
6 Elastic Net Analysis
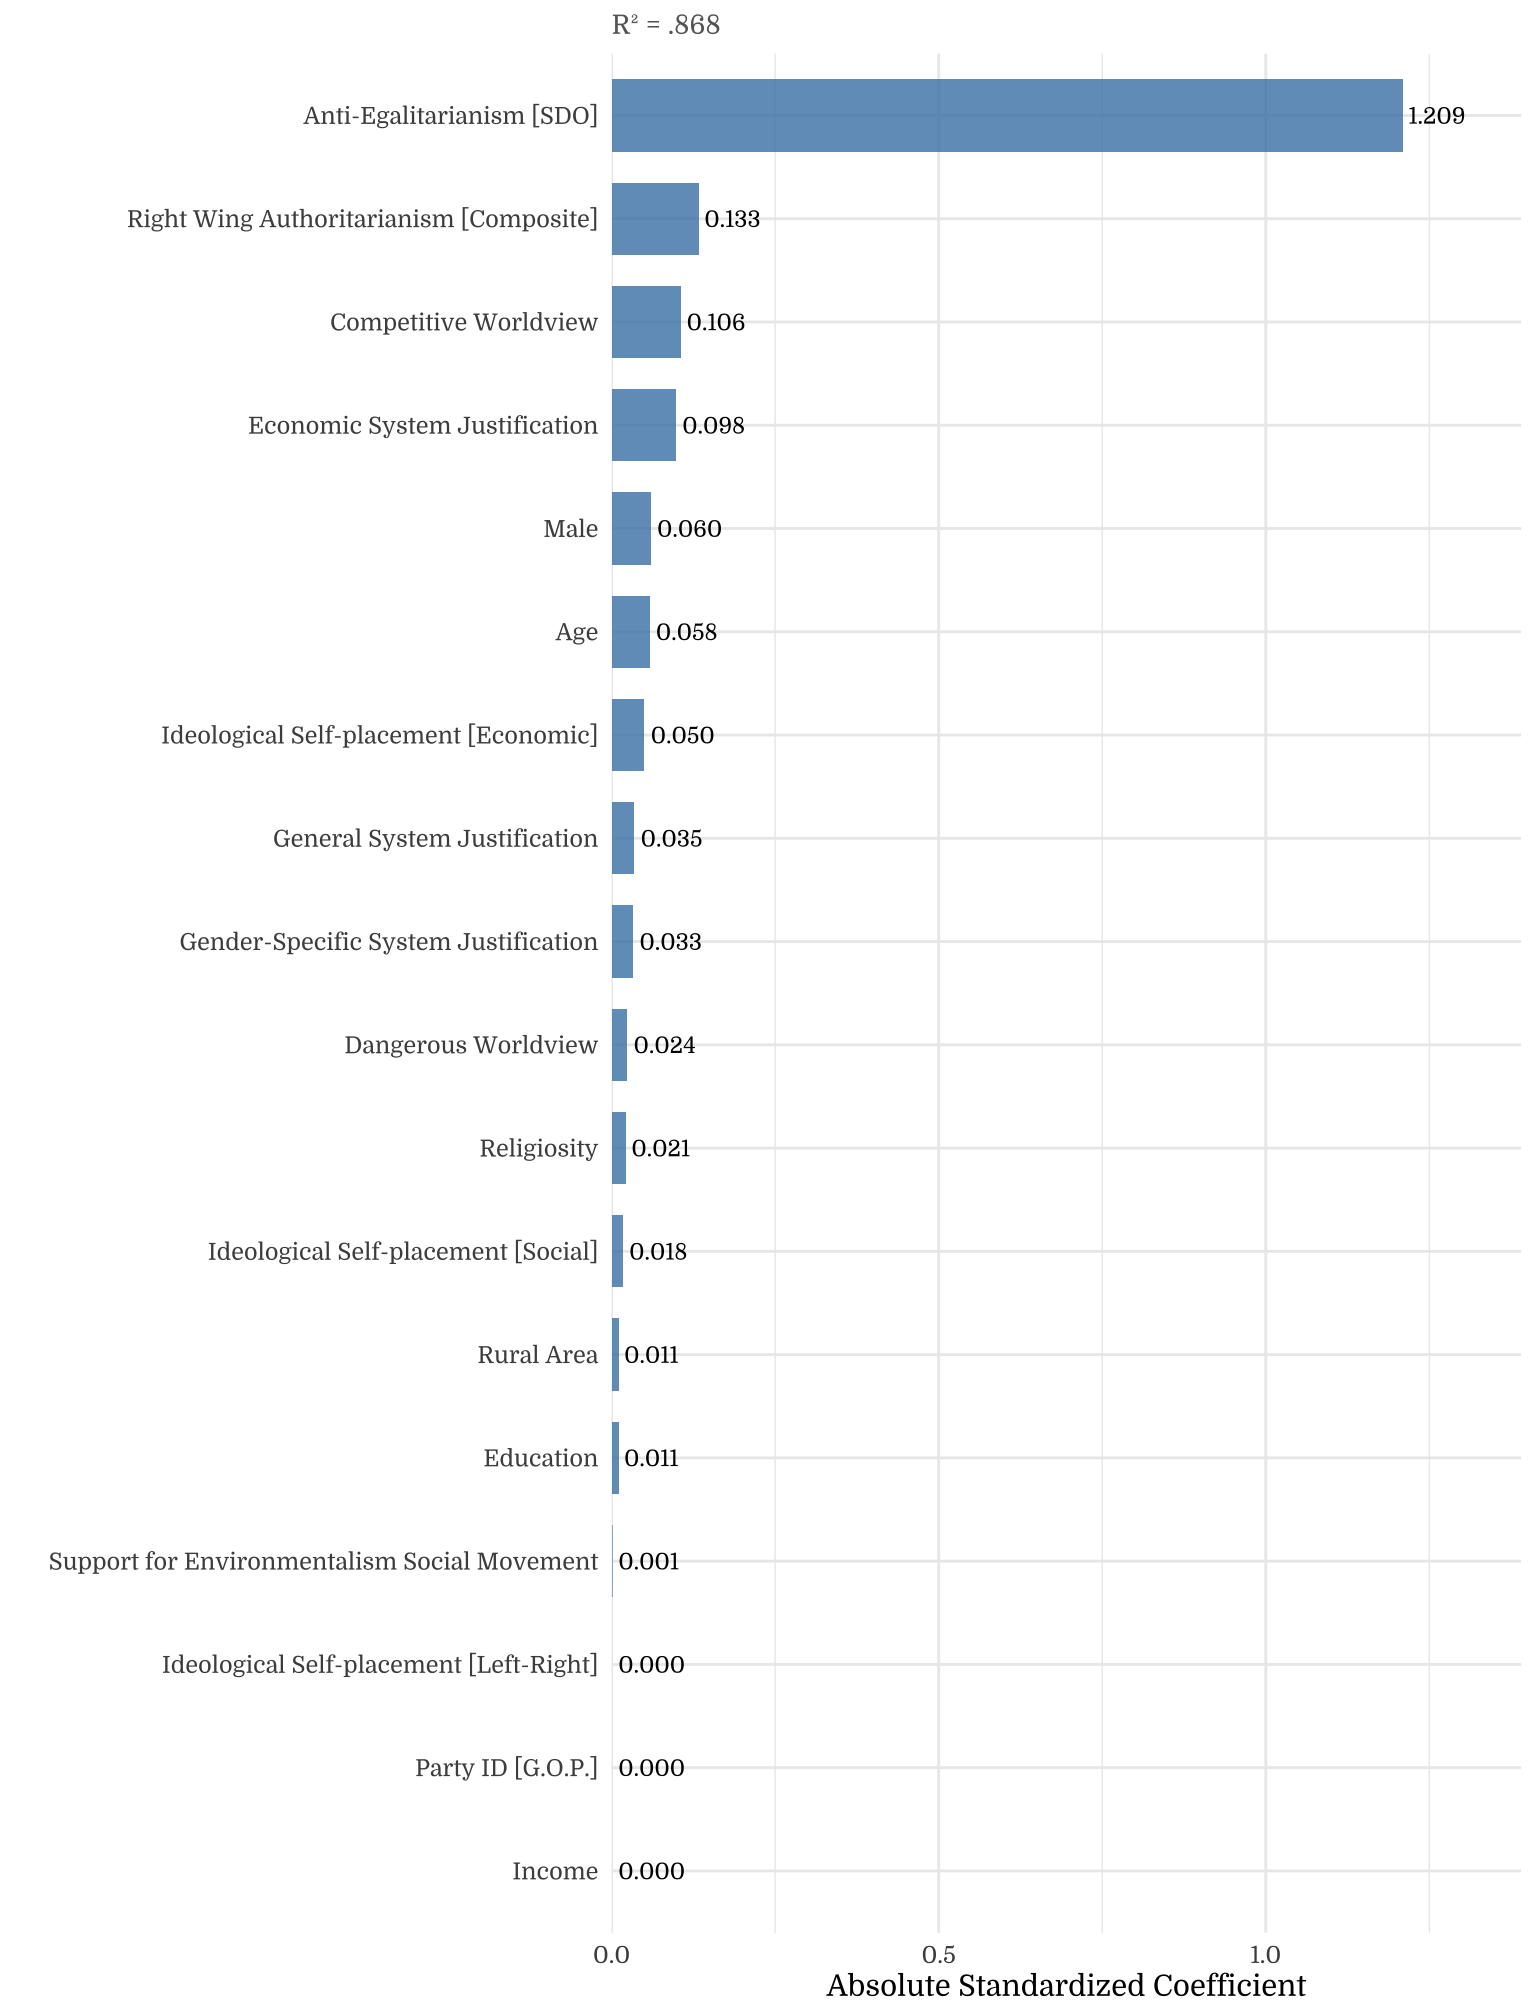
| Variable Group | # Predictors | R² |
|---|---|---|
| Political Psychology | 4 | .472 |
| Ideology & Partisanship | 5 | .253 |
| Demographics | 5 | .043 |
| Attitudes | 4 | .857 |
| Everything | 18 | .869 |
3.1 Social Class
Note on the Raincloud Plots