Right-Wing Authoritarianism [2020]
A Politico-Psychological Analysis
1 Study Characteristics
1.2 Sample
N=TBD
Sample description for the 2020 PPBS CINT study to be added.
2 Descriptives
2.1 Means, SD, Range, & SE
| mean | sd | median | se | |
|---|---|---|---|---|
| Aggression_mean | 5.49 | 1.57 | 5.25 | 0.04 |
| Submission_mean | 4.52 | 1.52 | 5.00 | 0.03 |
| Conventionalism_mean | 4.99 | 1.86 | 5.00 | 0.04 |
| RWA | 5.00 | 1.43 | 5.00 | 0.03 |
| Note: | ||||
| n = 2000, min = 1, max = 9 |
| mean | sd | median | se | |
|---|---|---|---|---|
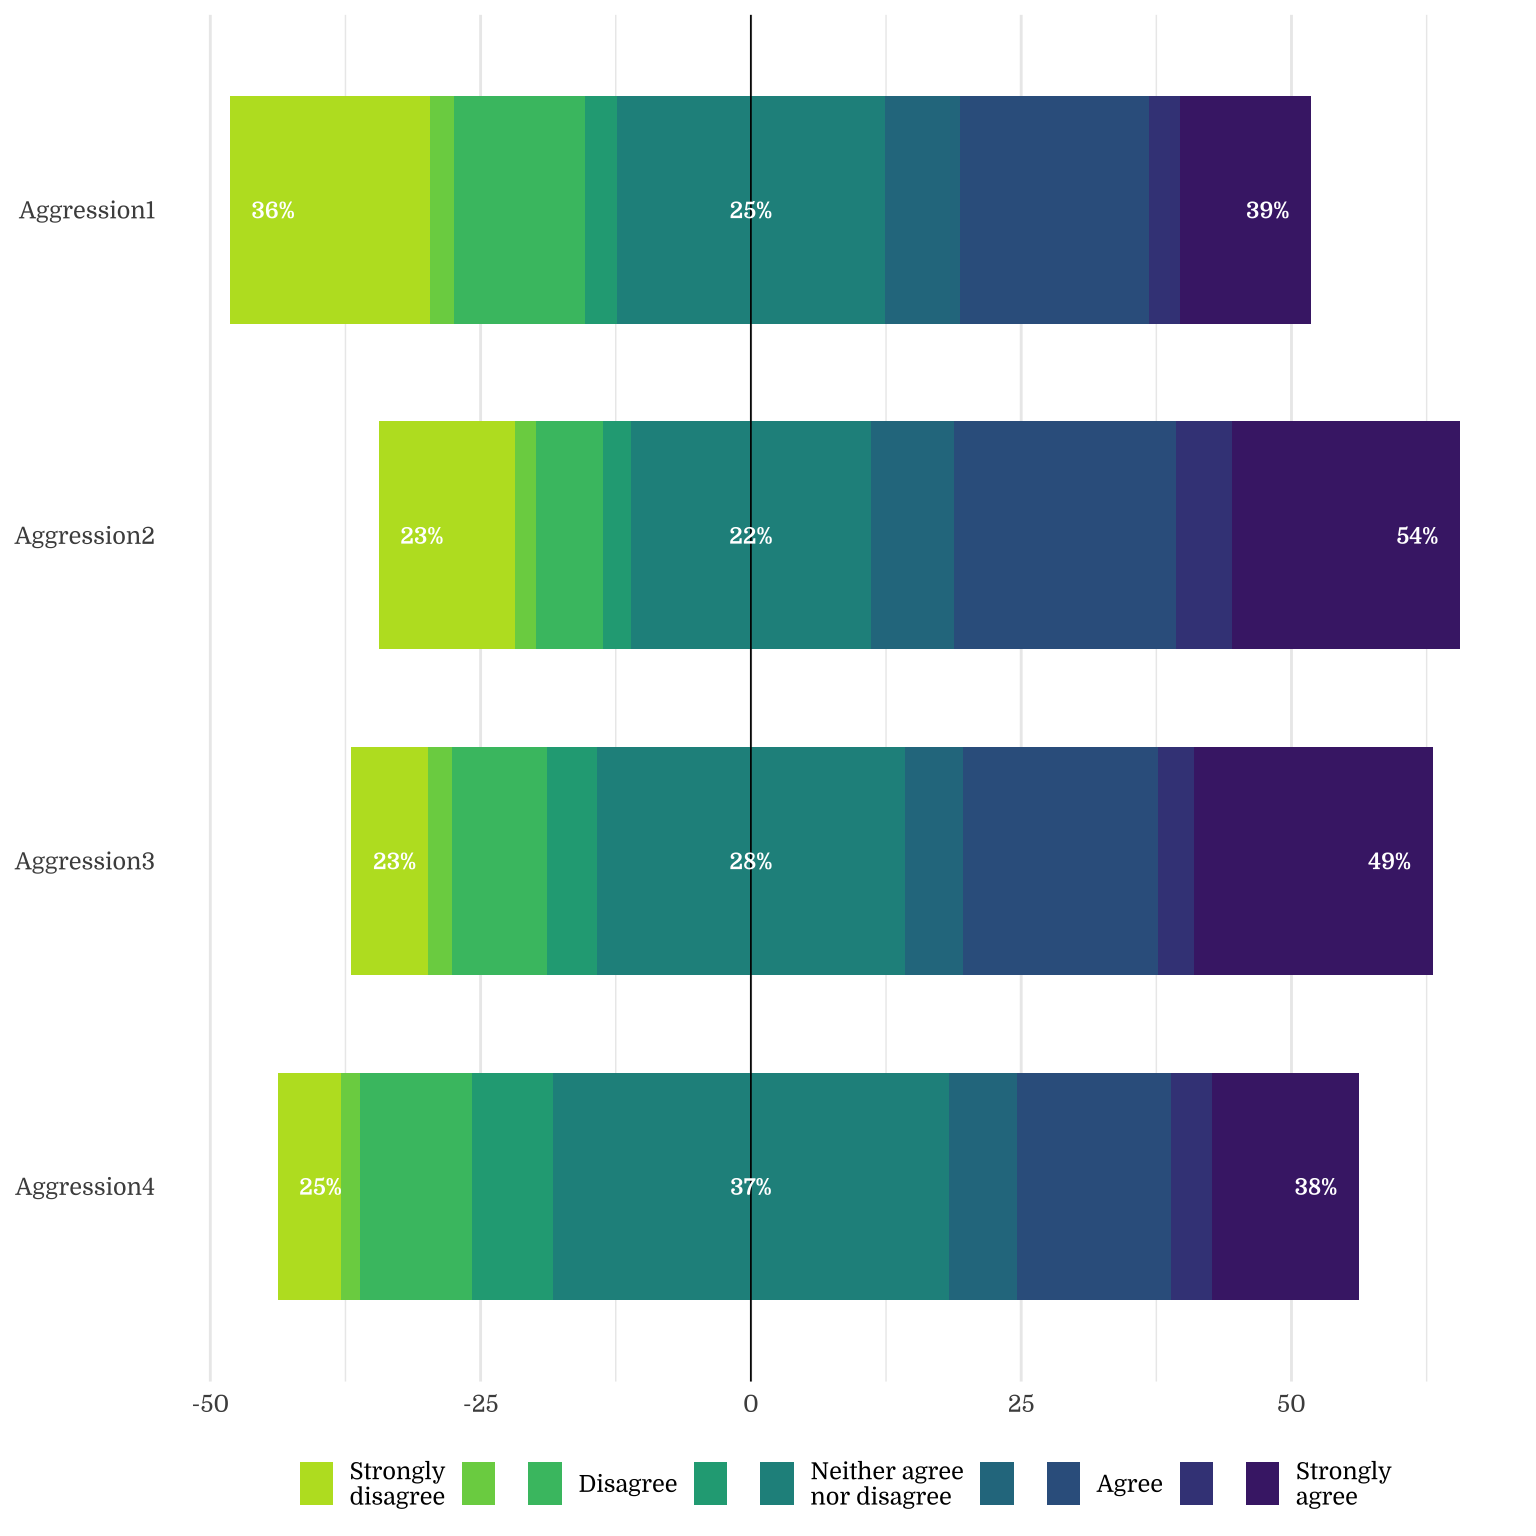
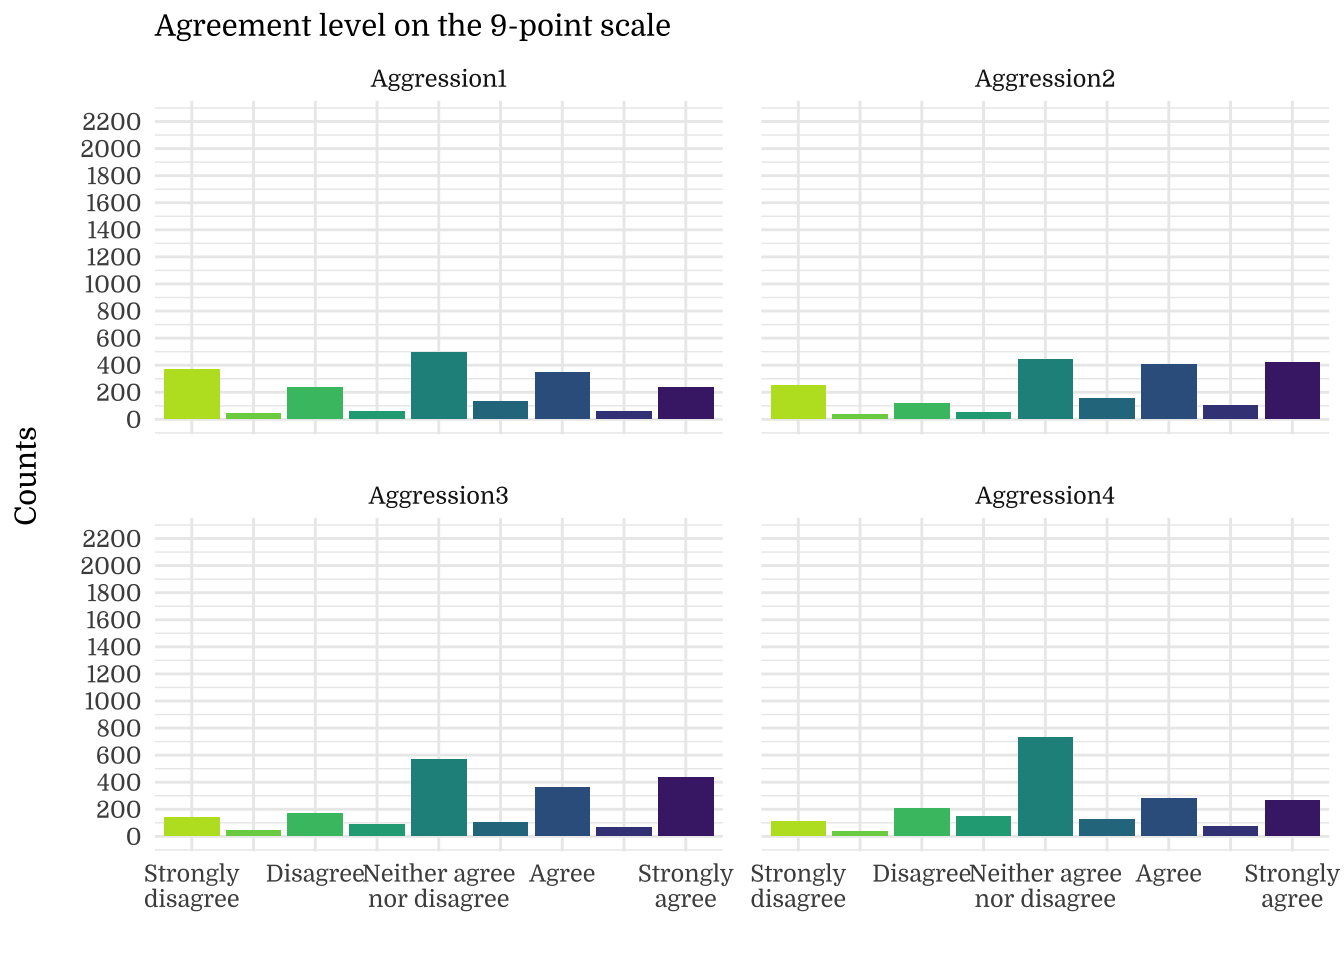
| Aggression1 | 4.91 | 2.58 | 5.00 | 0.06 |
| Aggression2 | 5.77 | 2.57 | 6.00 | 0.06 |
| Aggression3 | 5.83 | 2.38 | 5.00 | 0.05 |
| Aggression4 | 5.44 | 2.13 | 5.00 | 0.05 |
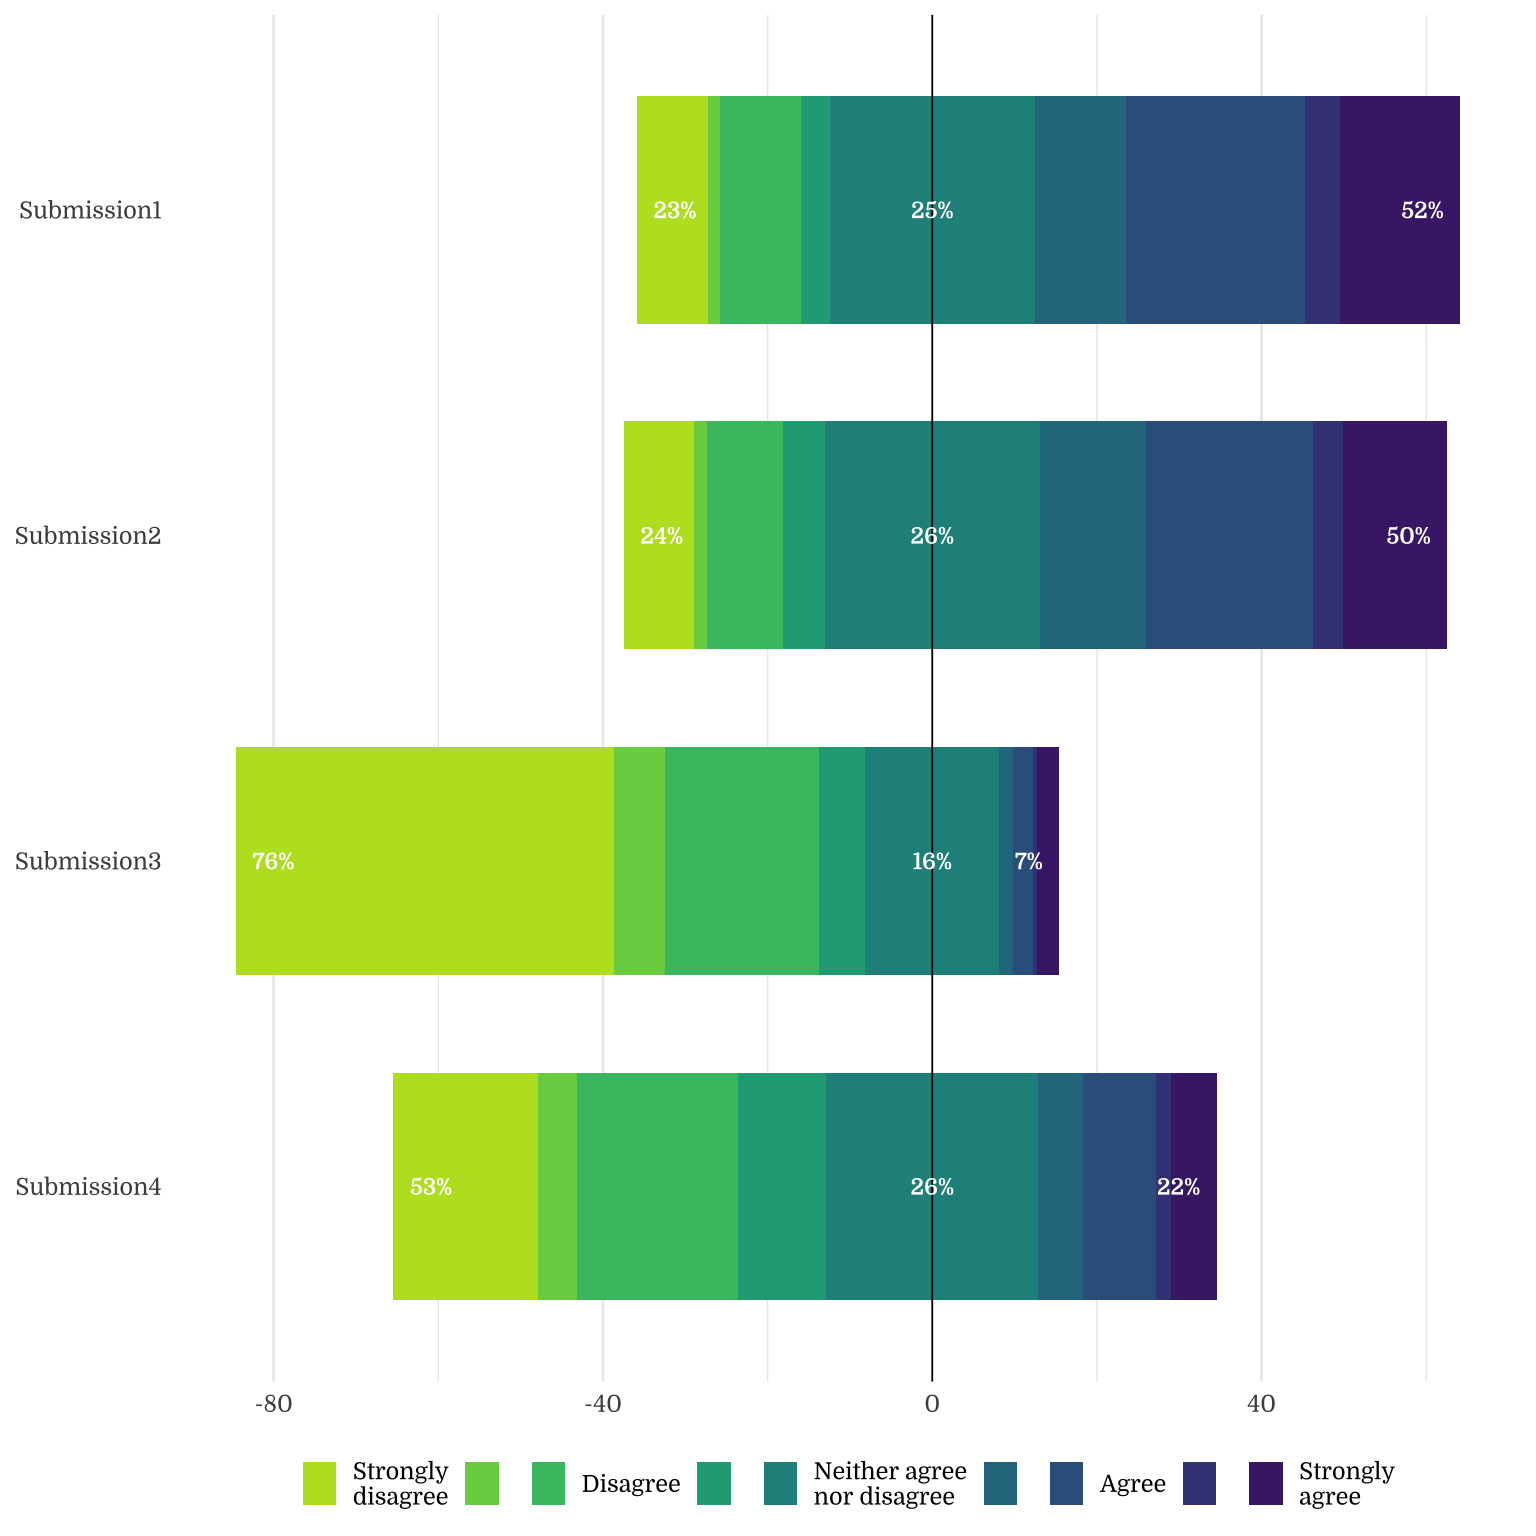
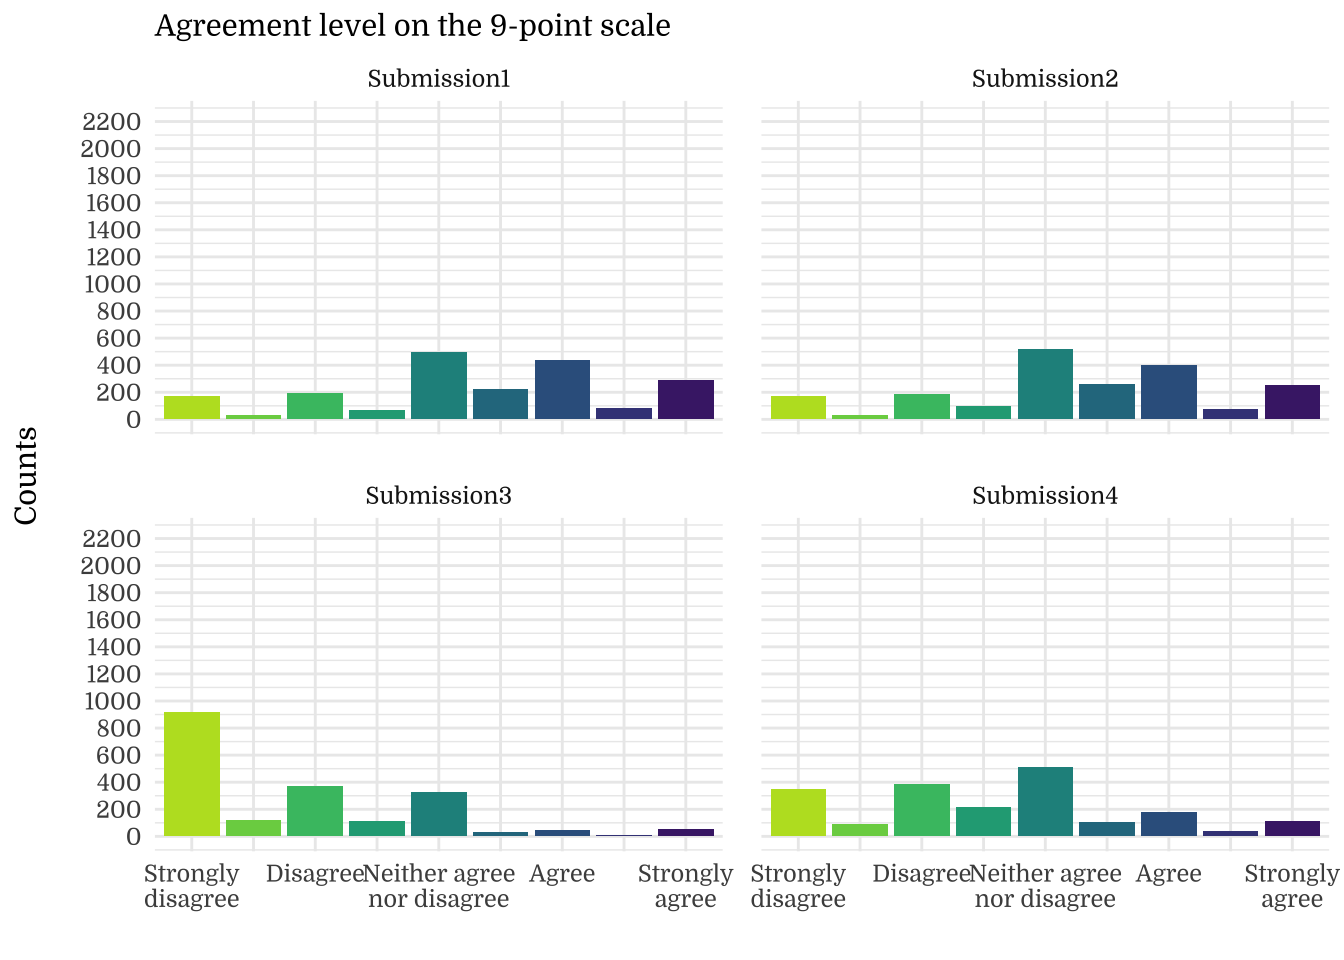
| Submission1 | 5.64 | 2.29 | 6.00 | 0.05 |
| Submission2 | 5.53 | 2.22 | 5.00 | 0.05 |
| Submission3 | 2.73 | 2.04 | 2.00 | 0.05 |
| Submission4 | 4.16 | 2.21 | 4.00 | 0.05 |
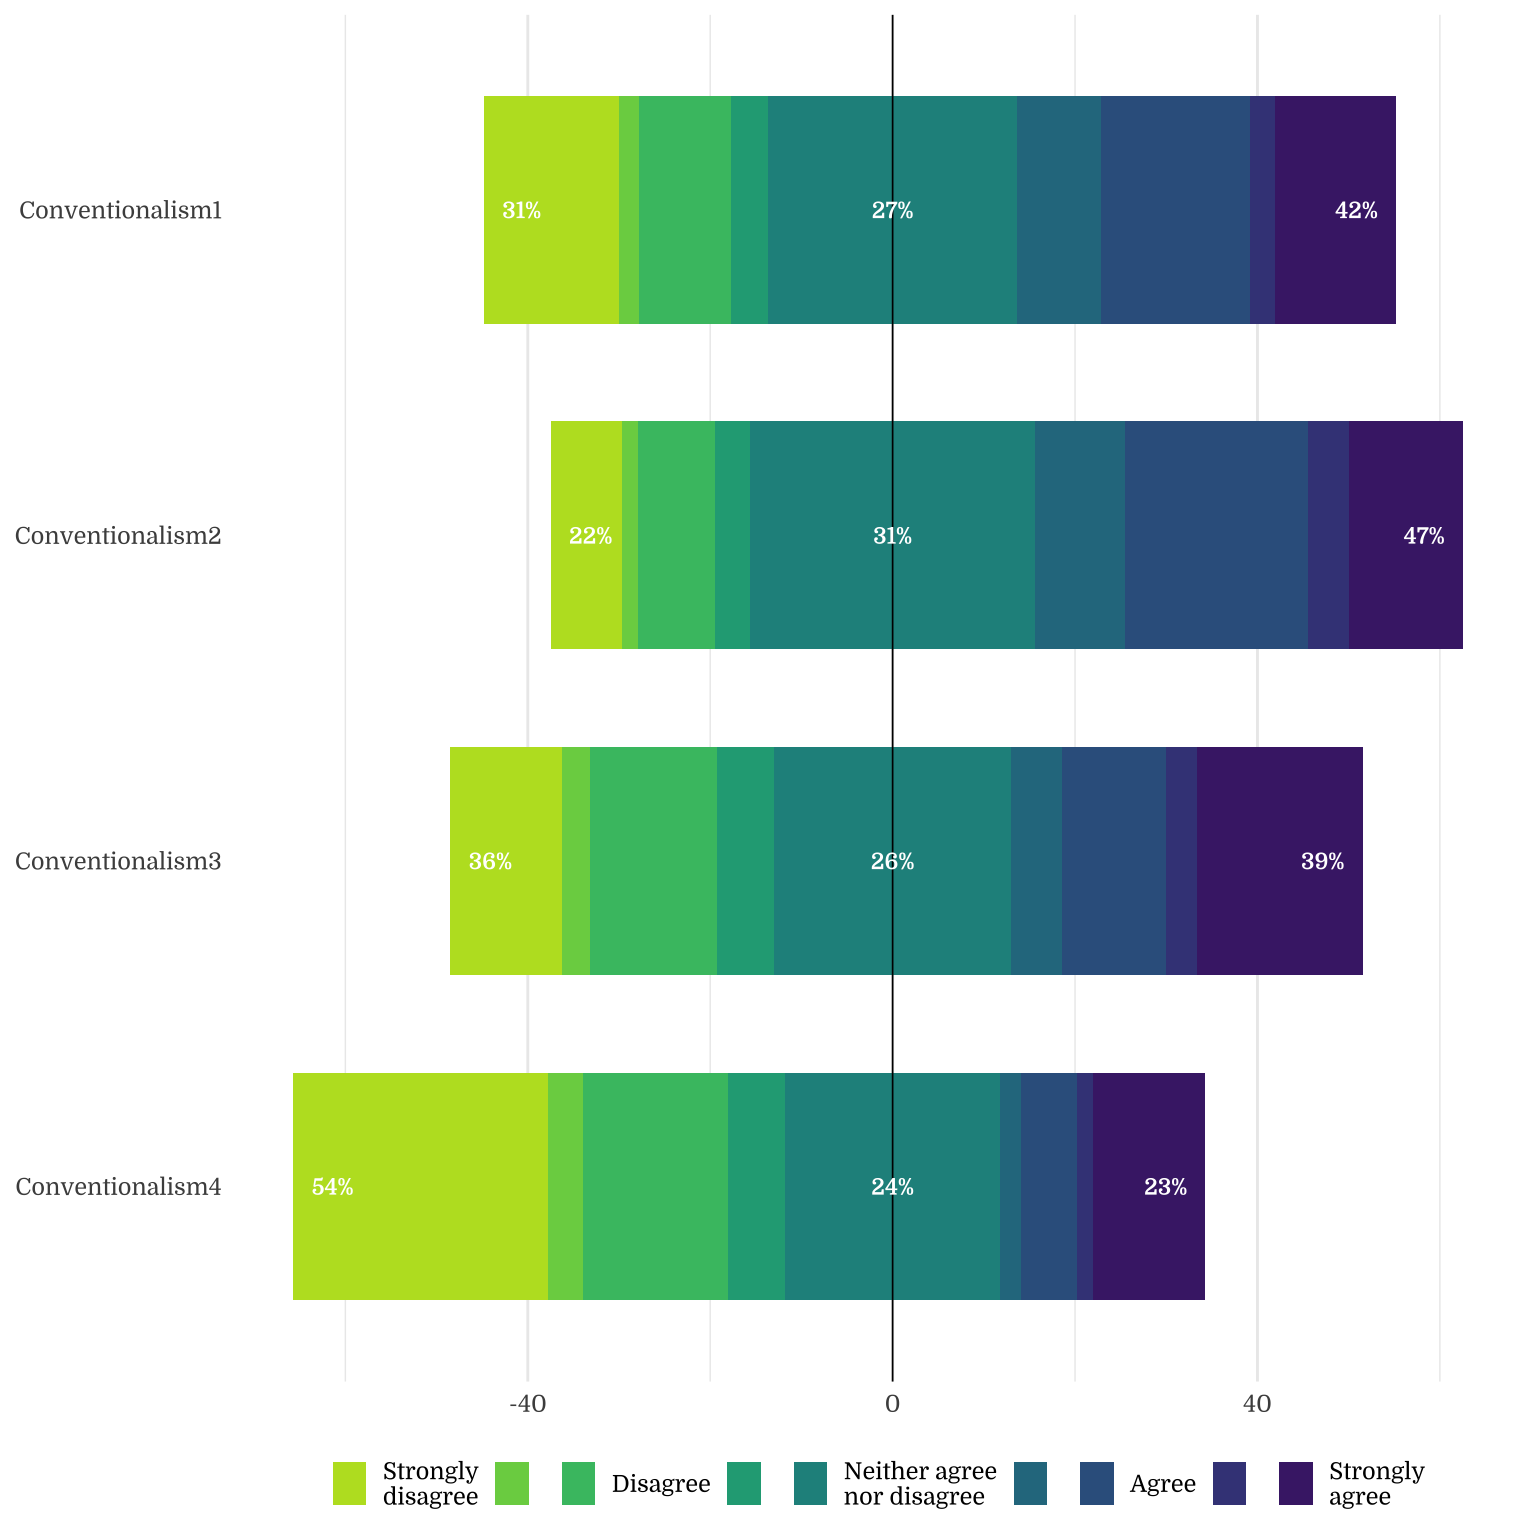
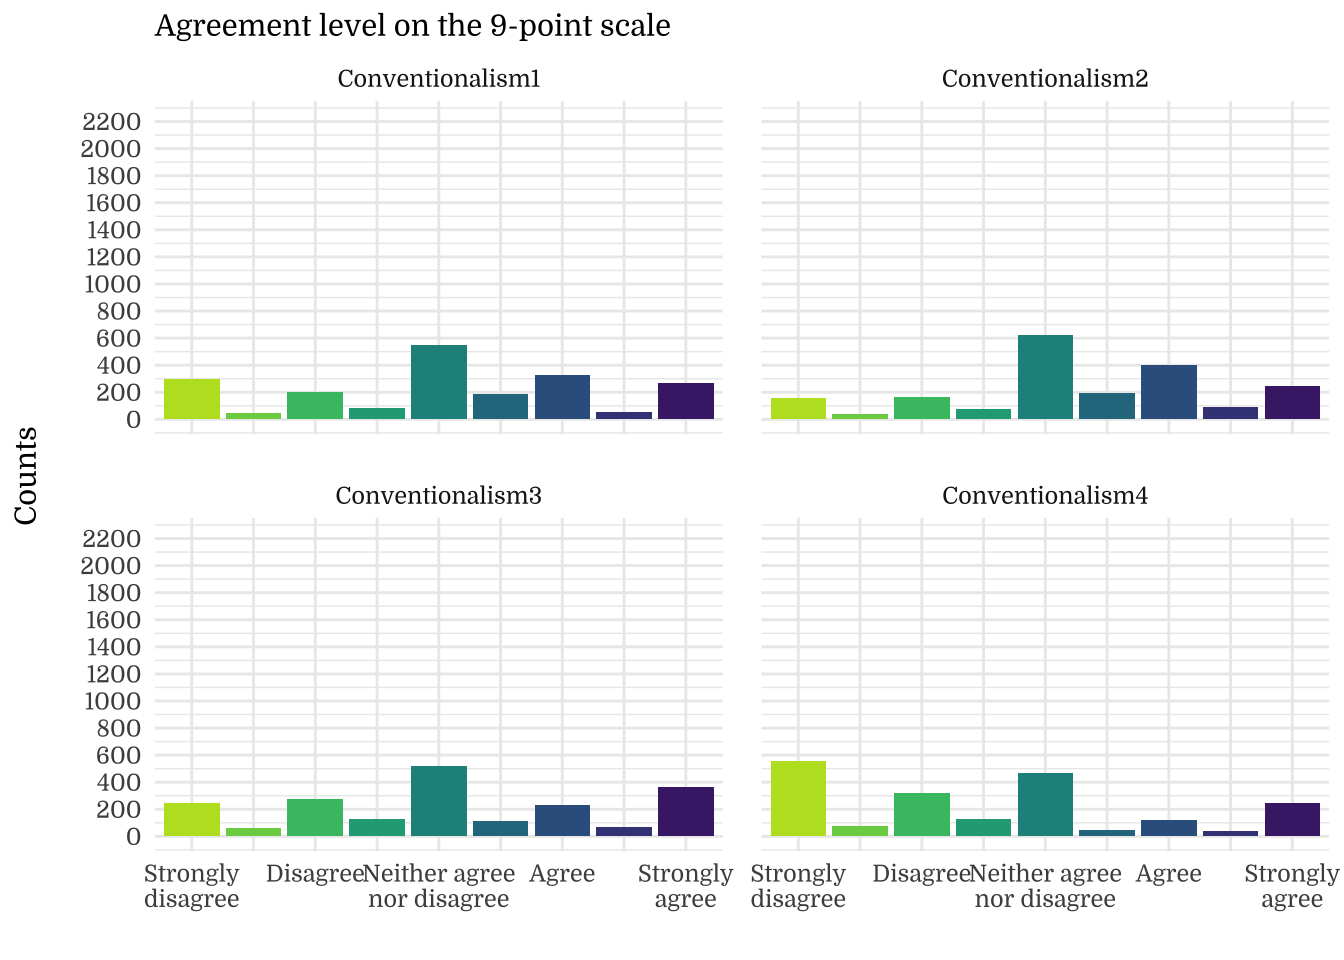
| Conventionalism1 | 5.13 | 2.47 | 5.00 | 0.06 |
| Conventionalism2 | 5.56 | 2.18 | 5.00 | 0.05 |
| Conventionalism3 | 5.19 | 2.56 | 5.00 | 0.06 |
| Conventionalism4 | 4.08 | 2.66 | 4.00 | 0.06 |
| RWA | 5.00 | 1.43 | 5.00 | 0.03 |
| Aggression_mean | 5.49 | 1.57 | 5.25 | 0.04 |
| Submission_mean | 4.52 | 1.52 | 5.00 | 0.03 |
| Conventionalism_mean | 4.99 | 1.86 | 5.00 | 0.04 |
| Note: | ||||
| All items: n = 2000, min = 1, max = 9. RWA: min = 1, max = 9. Aggression_mean: min = 1, max = 9. Submission_mean: min = 1, max = 9. Conventionalism_mean: min = 1, max = 9 |
2.2 Response Distribution
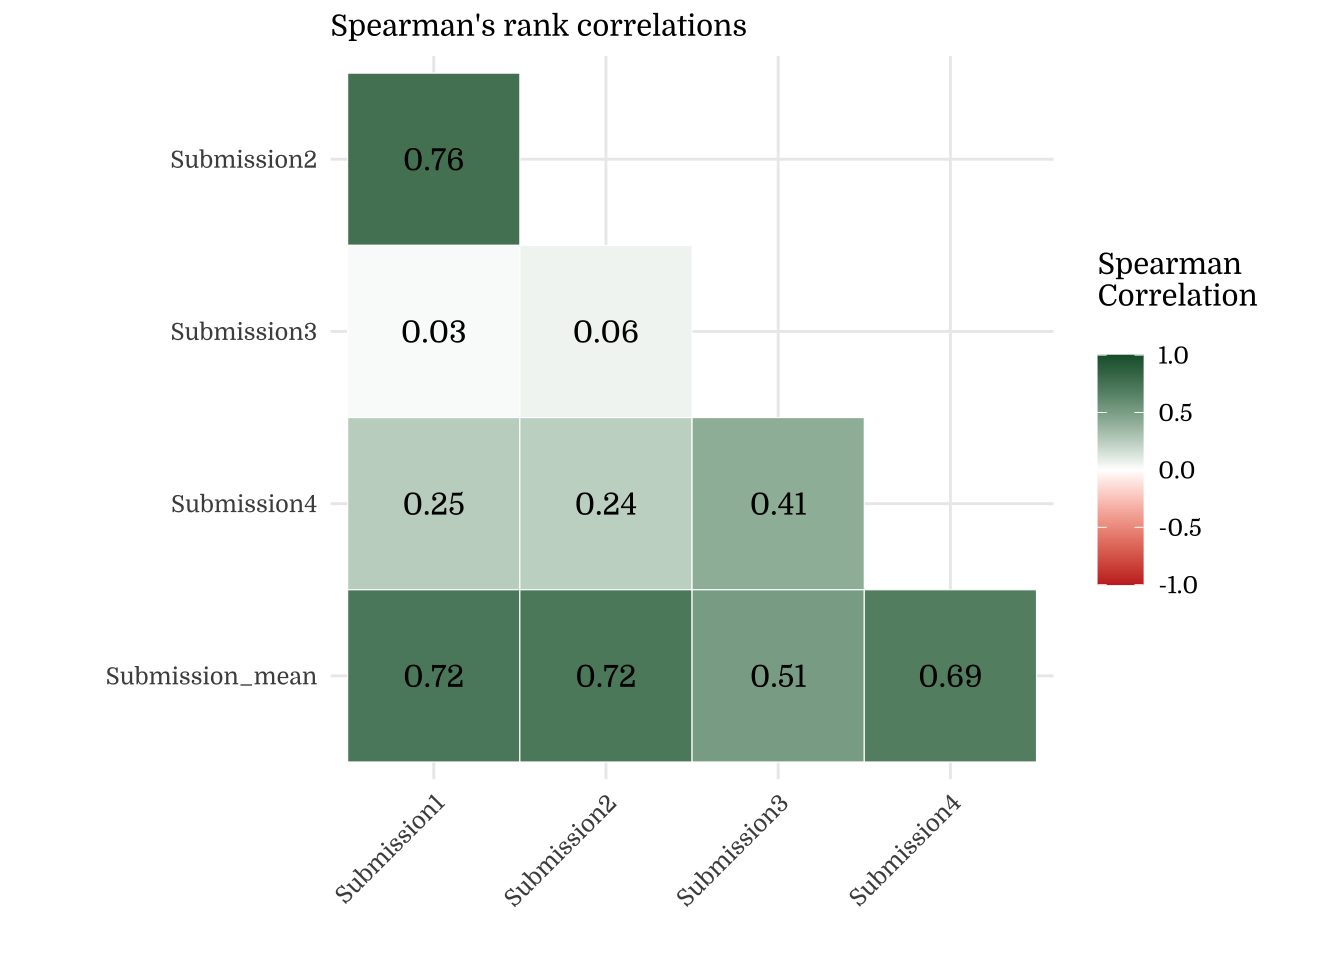
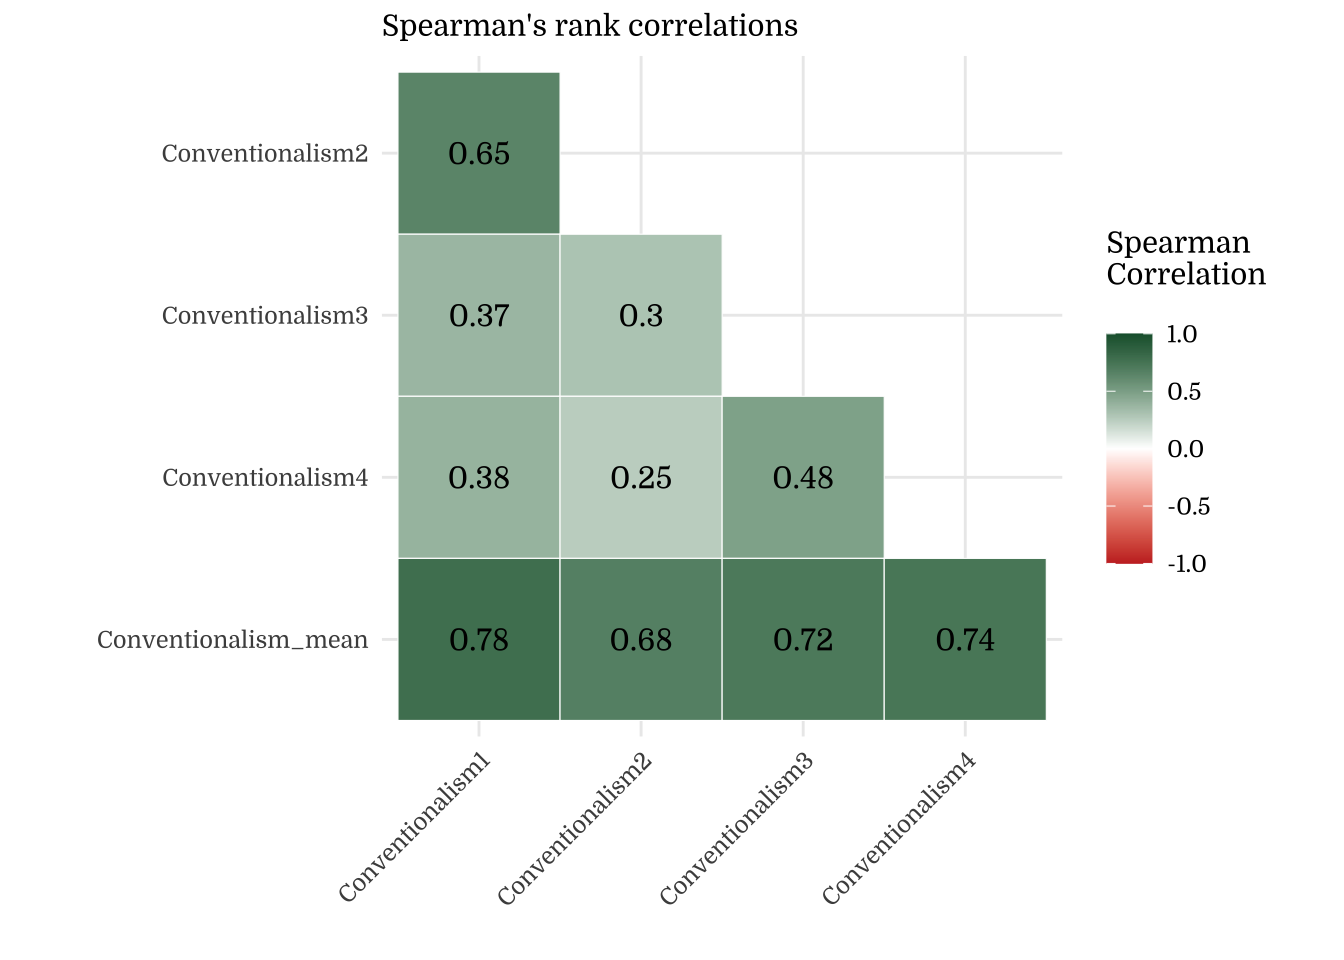
2.3 Correlations
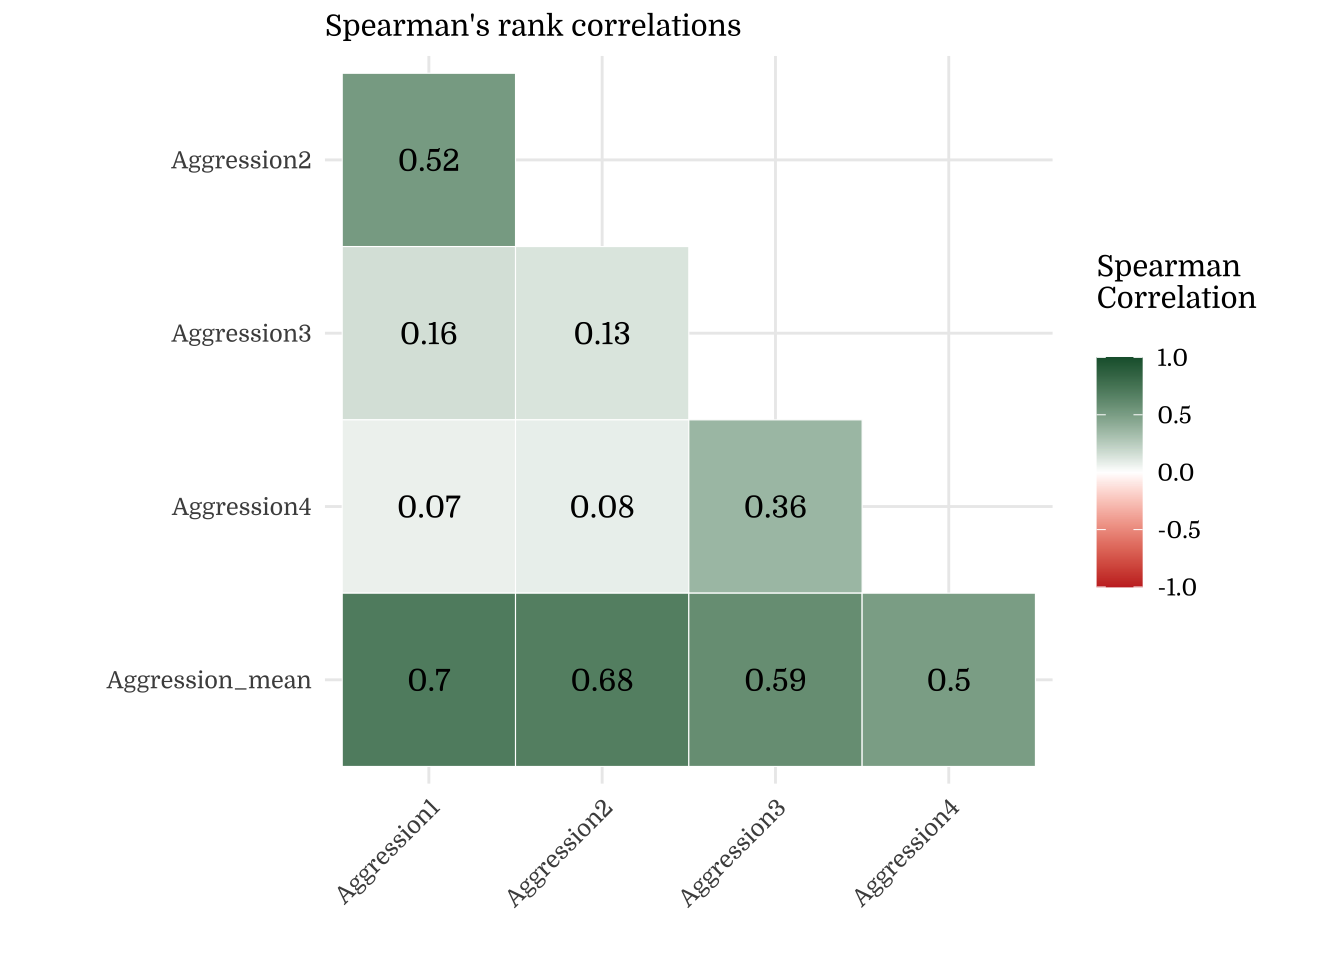
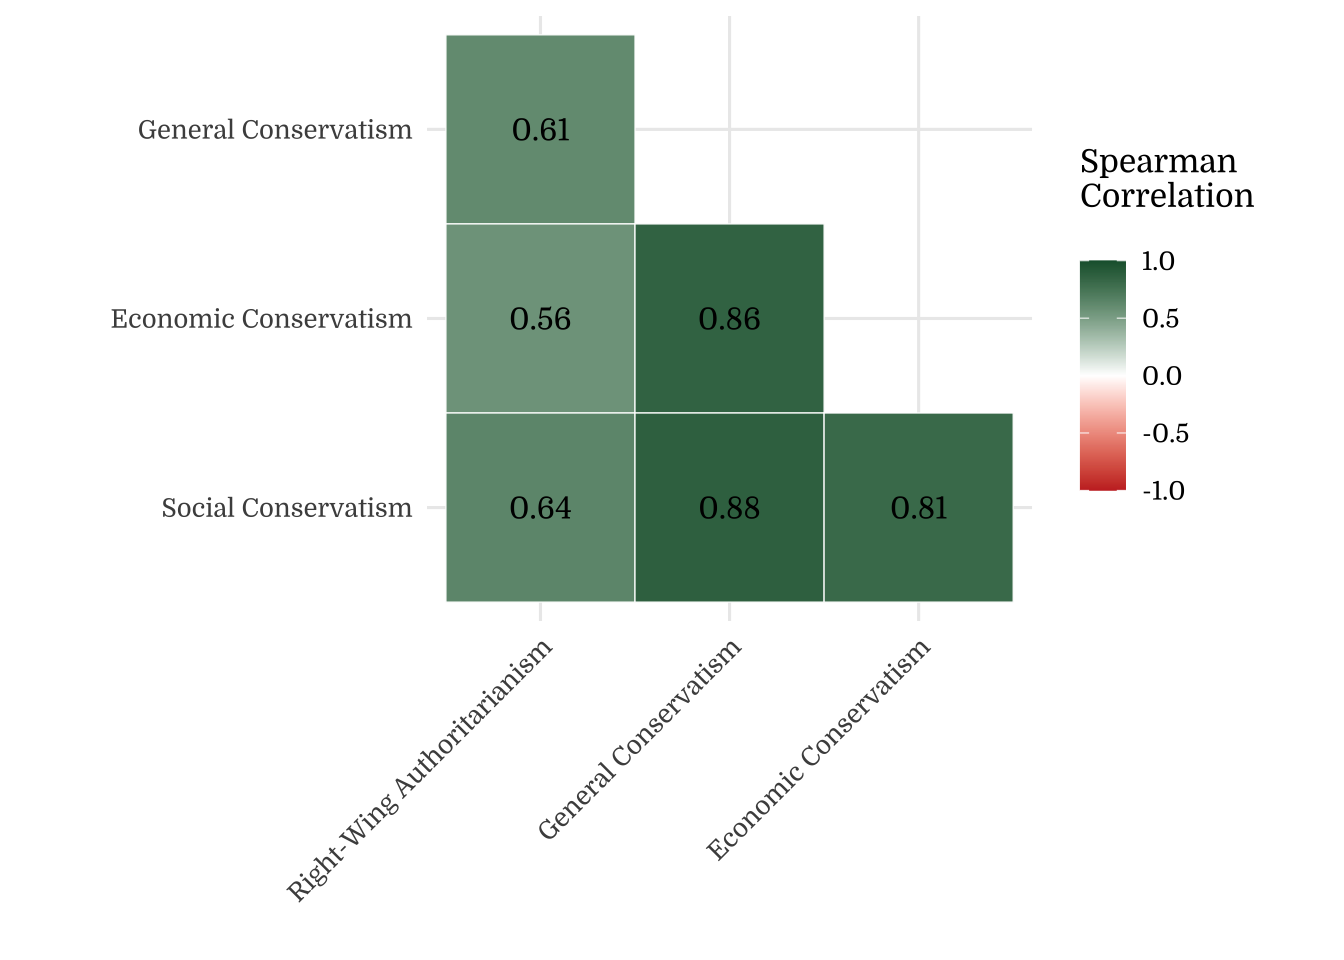
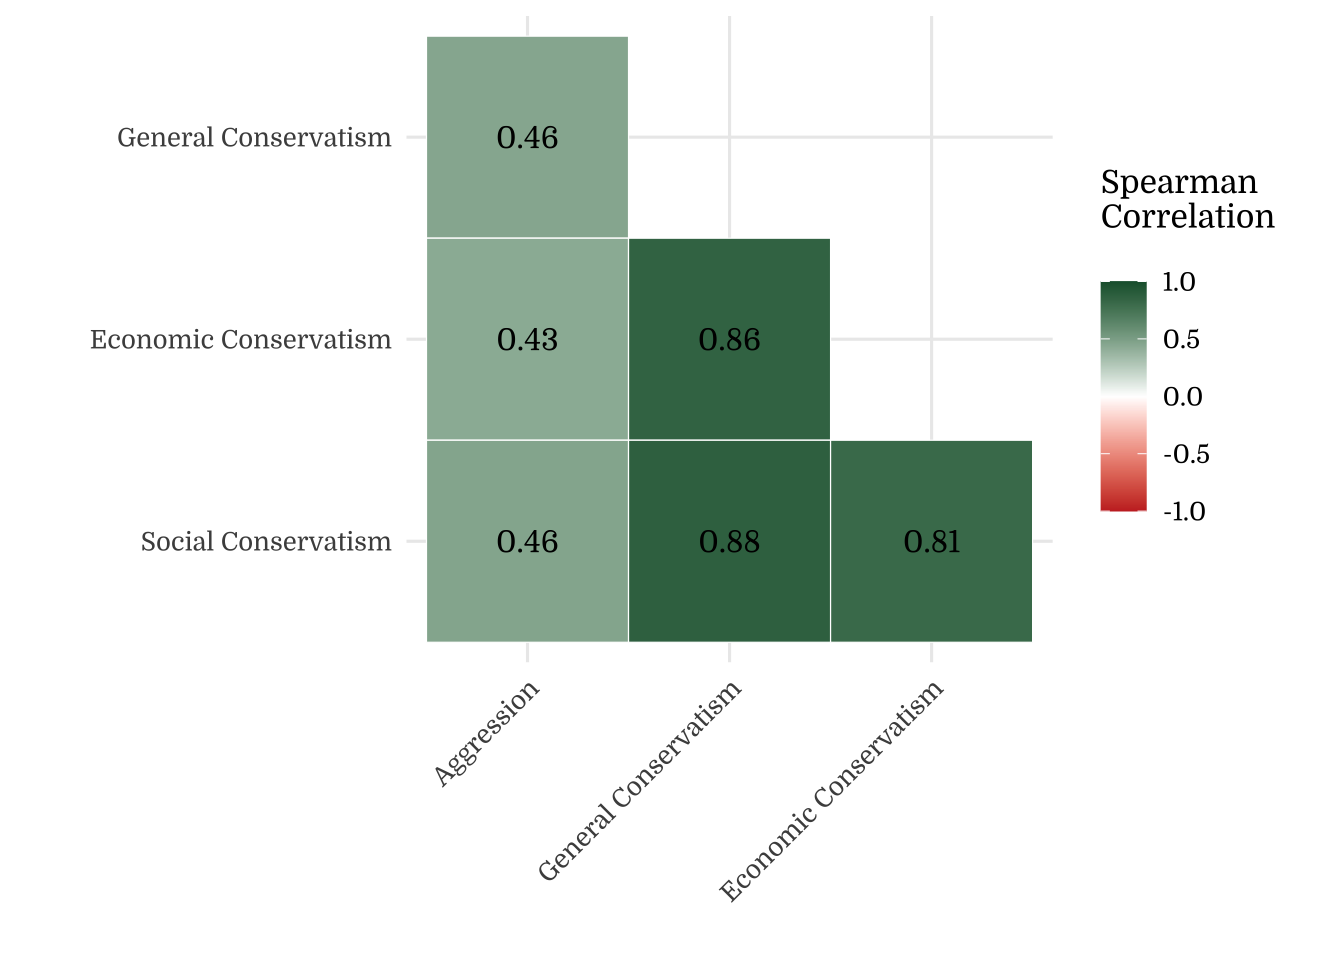
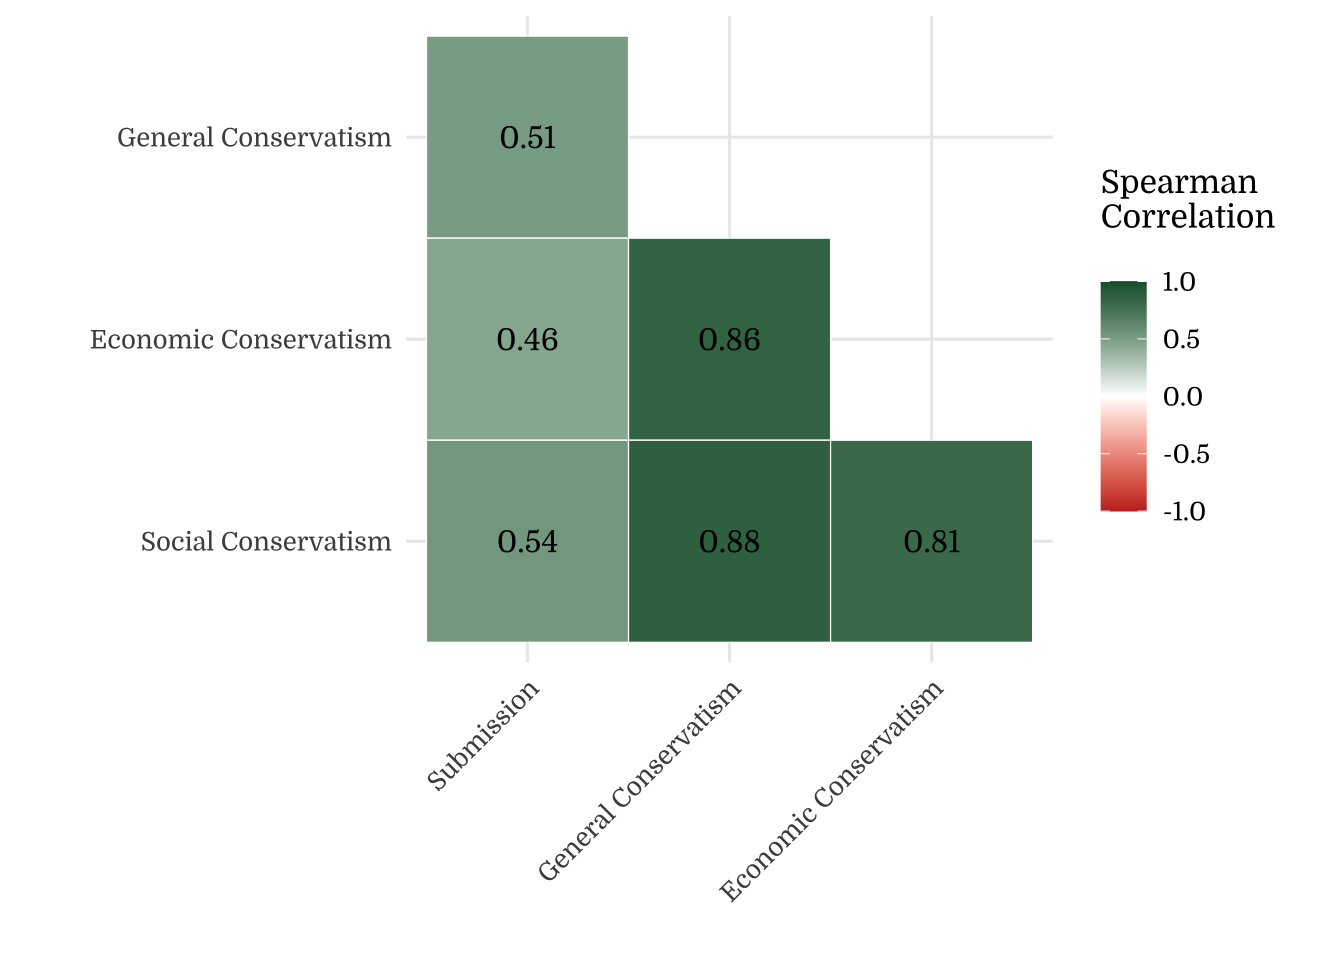
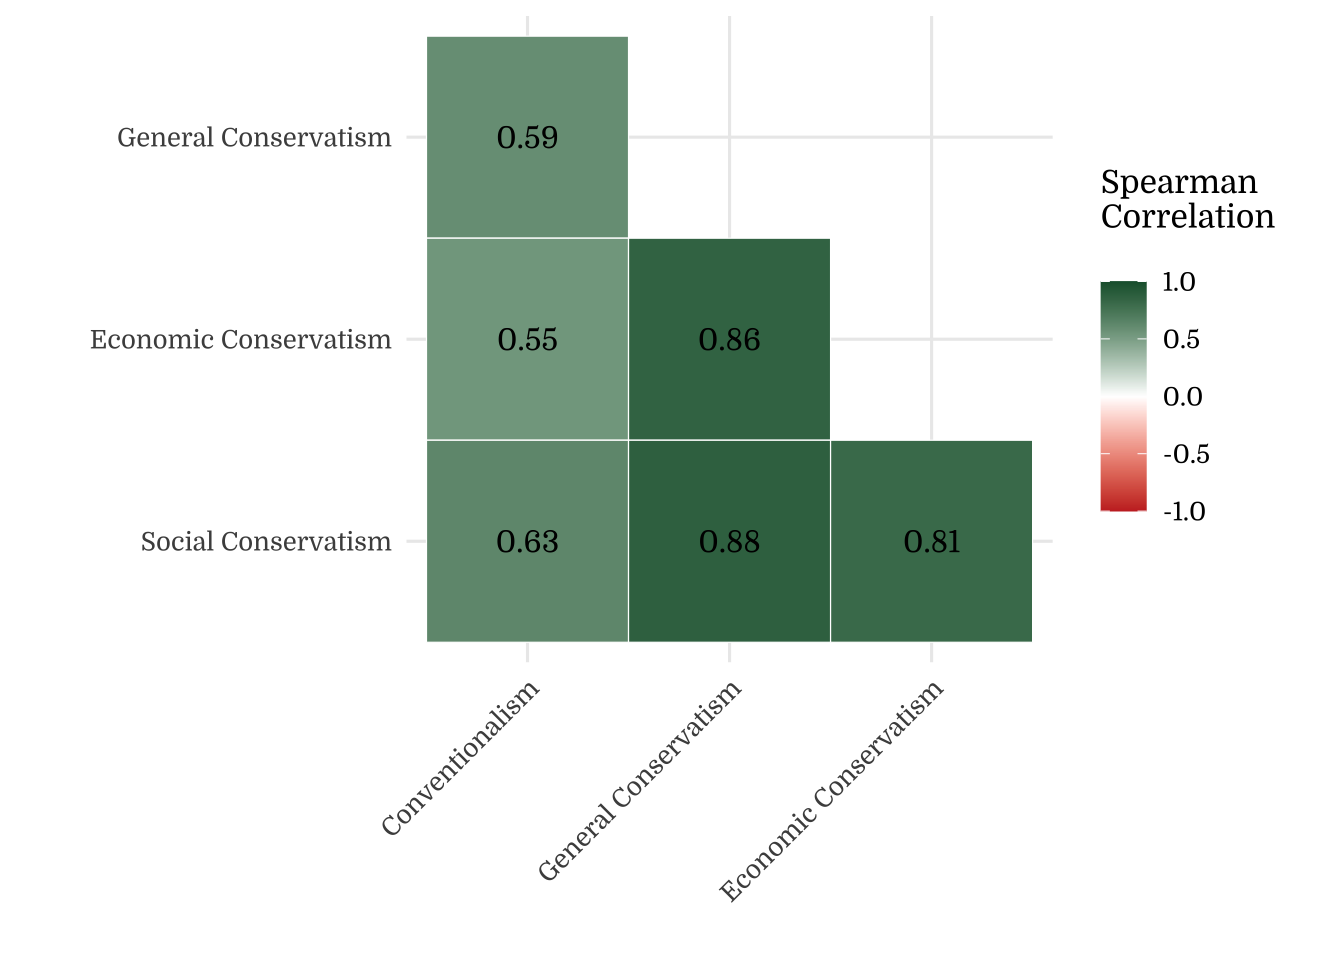
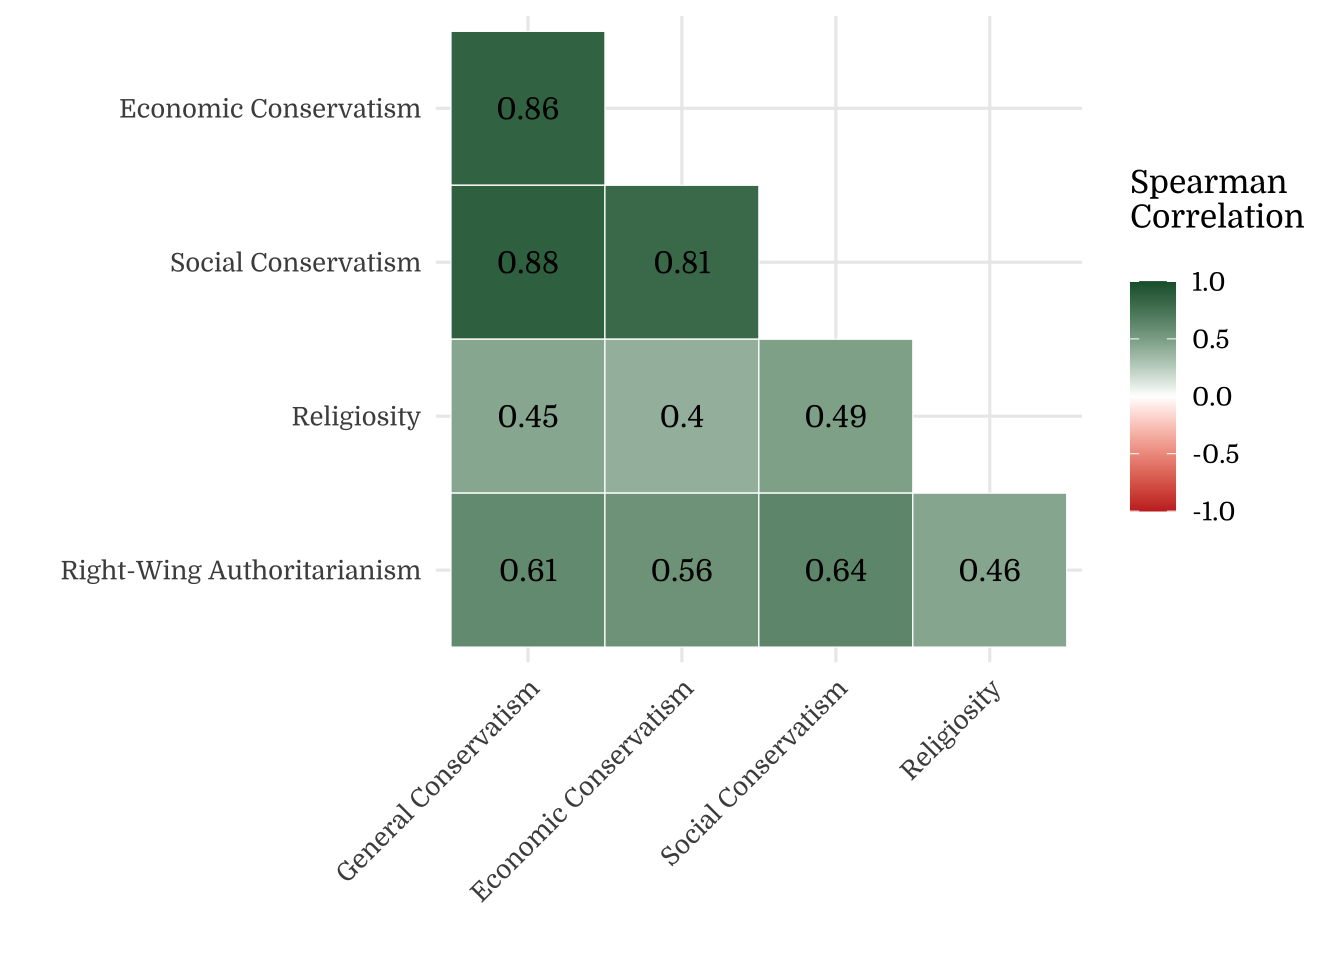
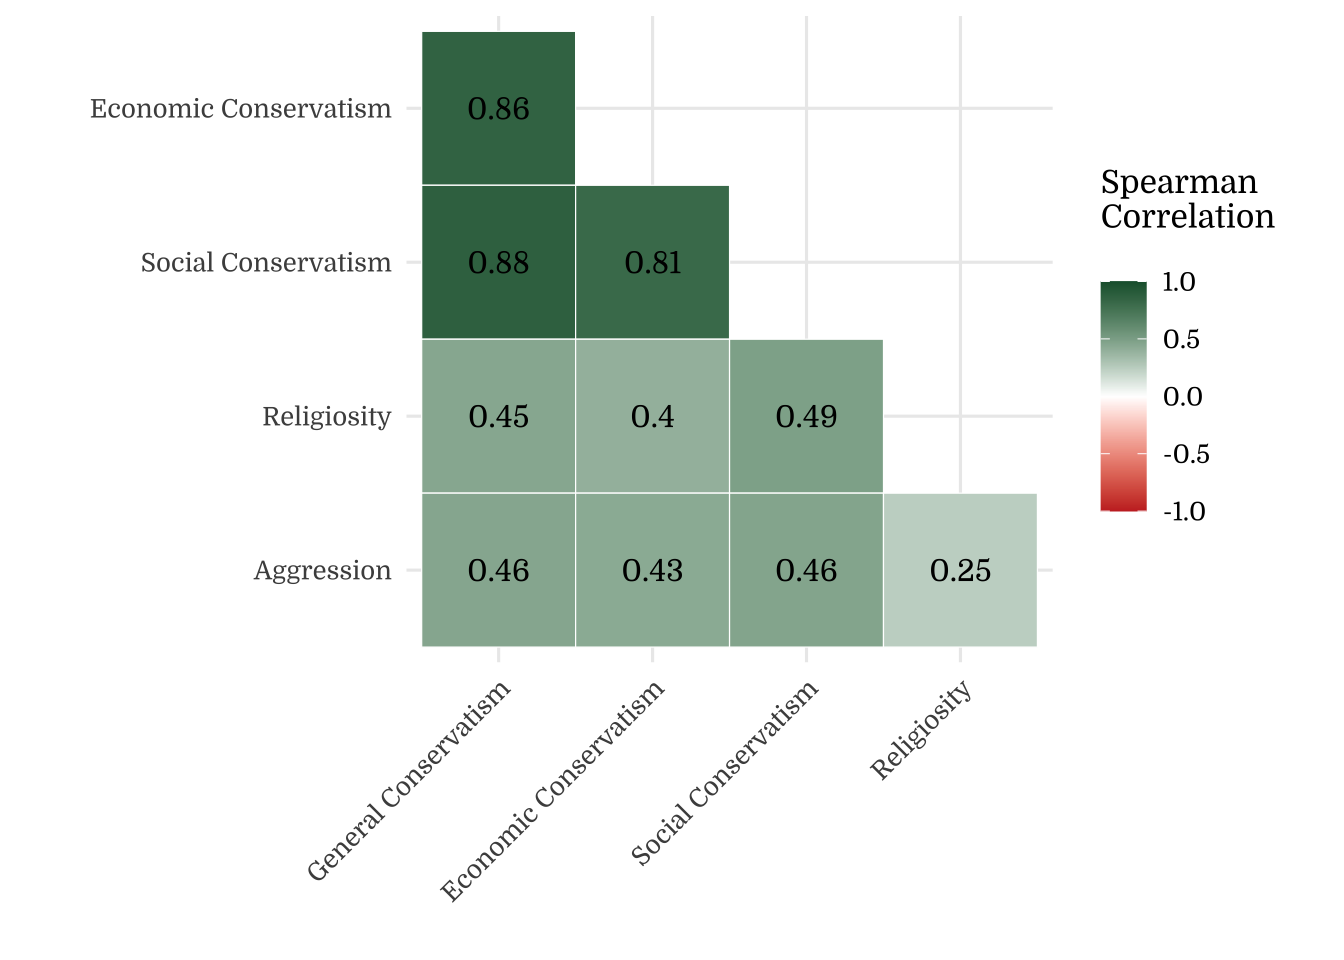
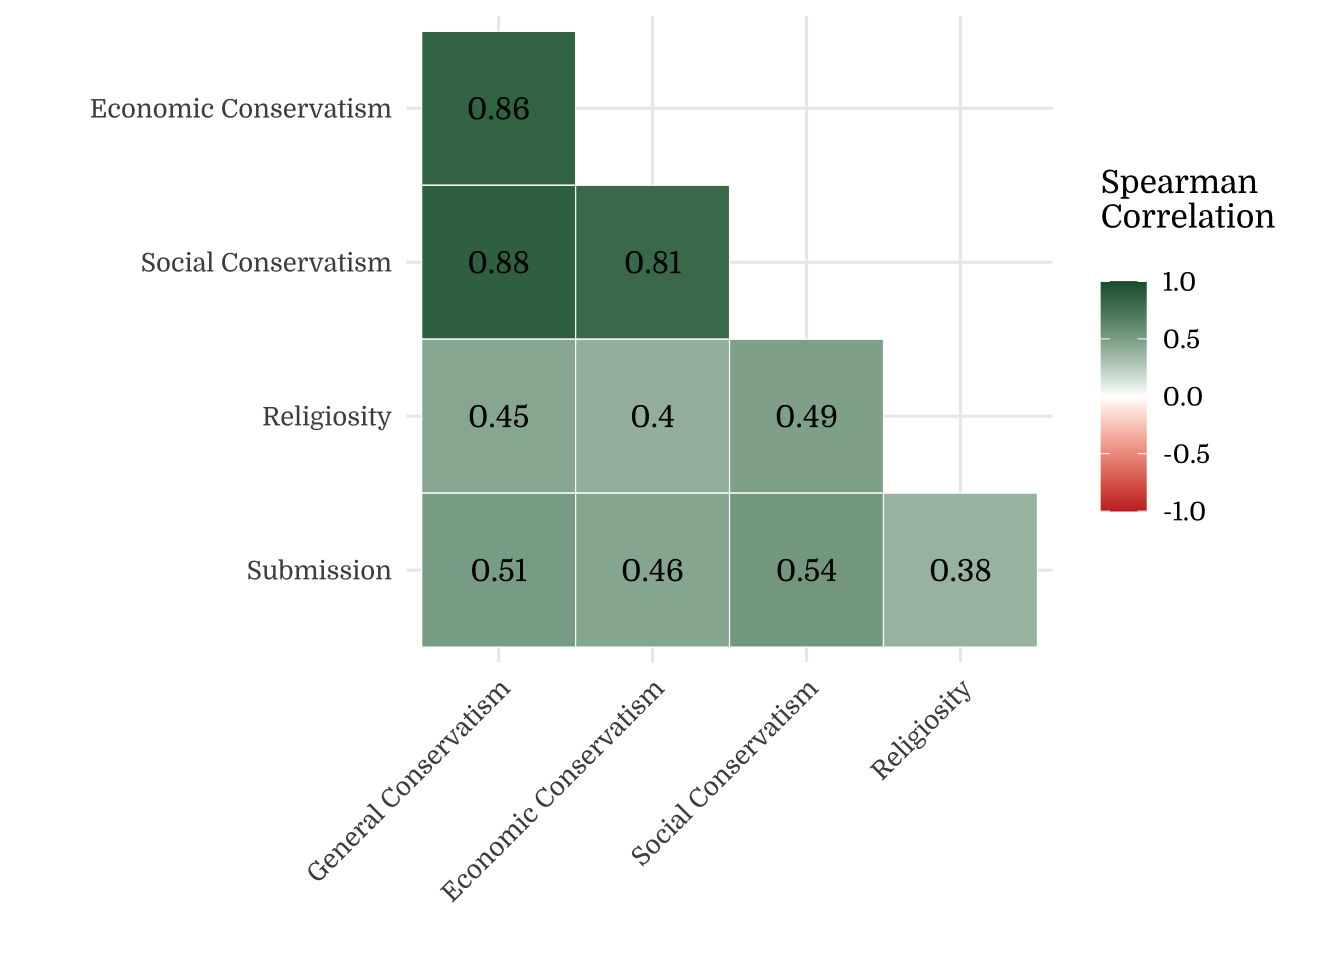
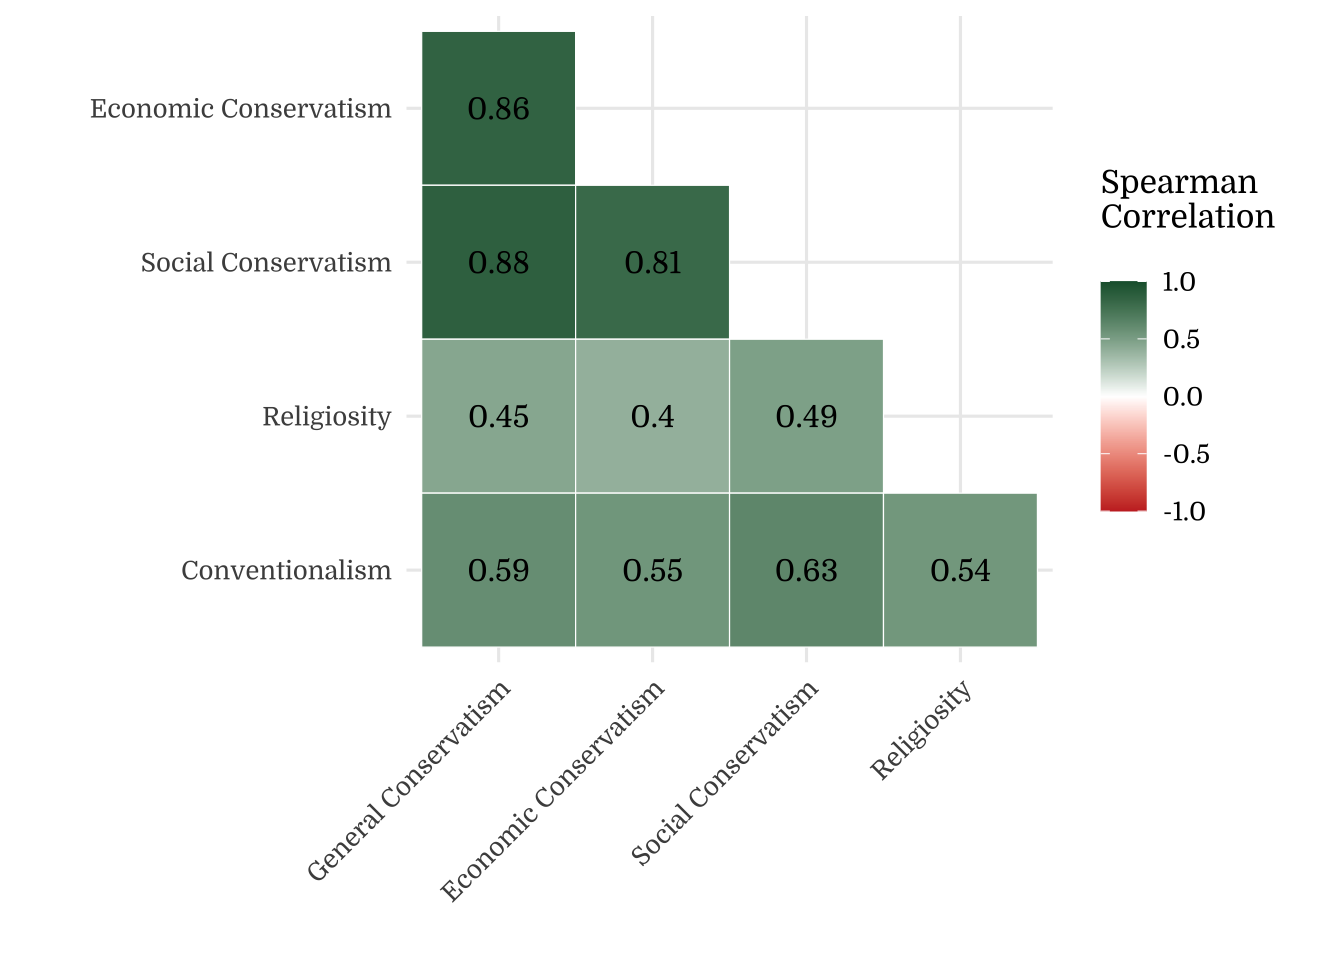
2.3.1 Correlation Plots
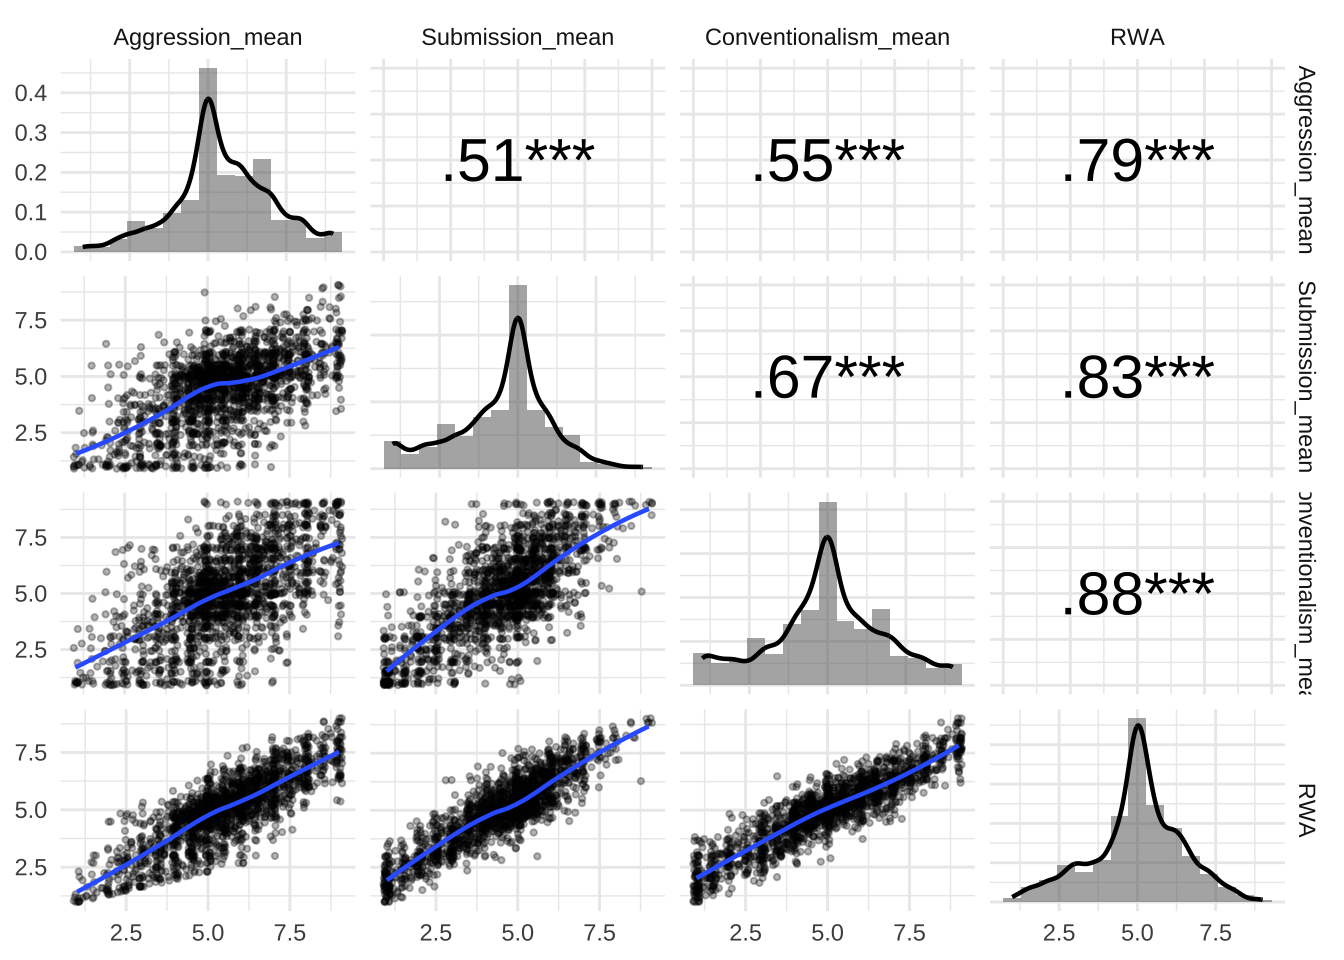
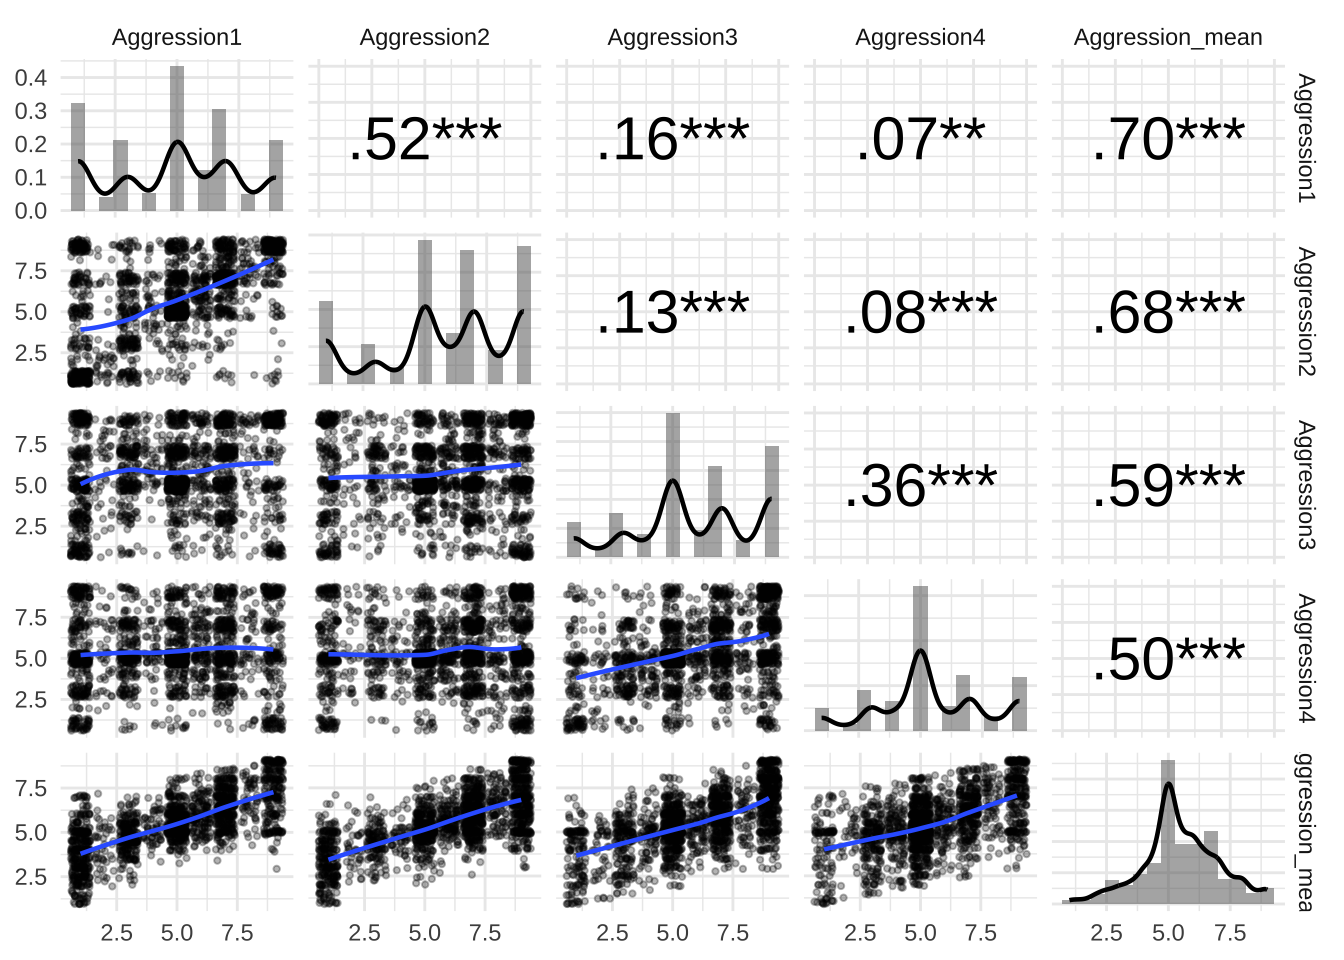
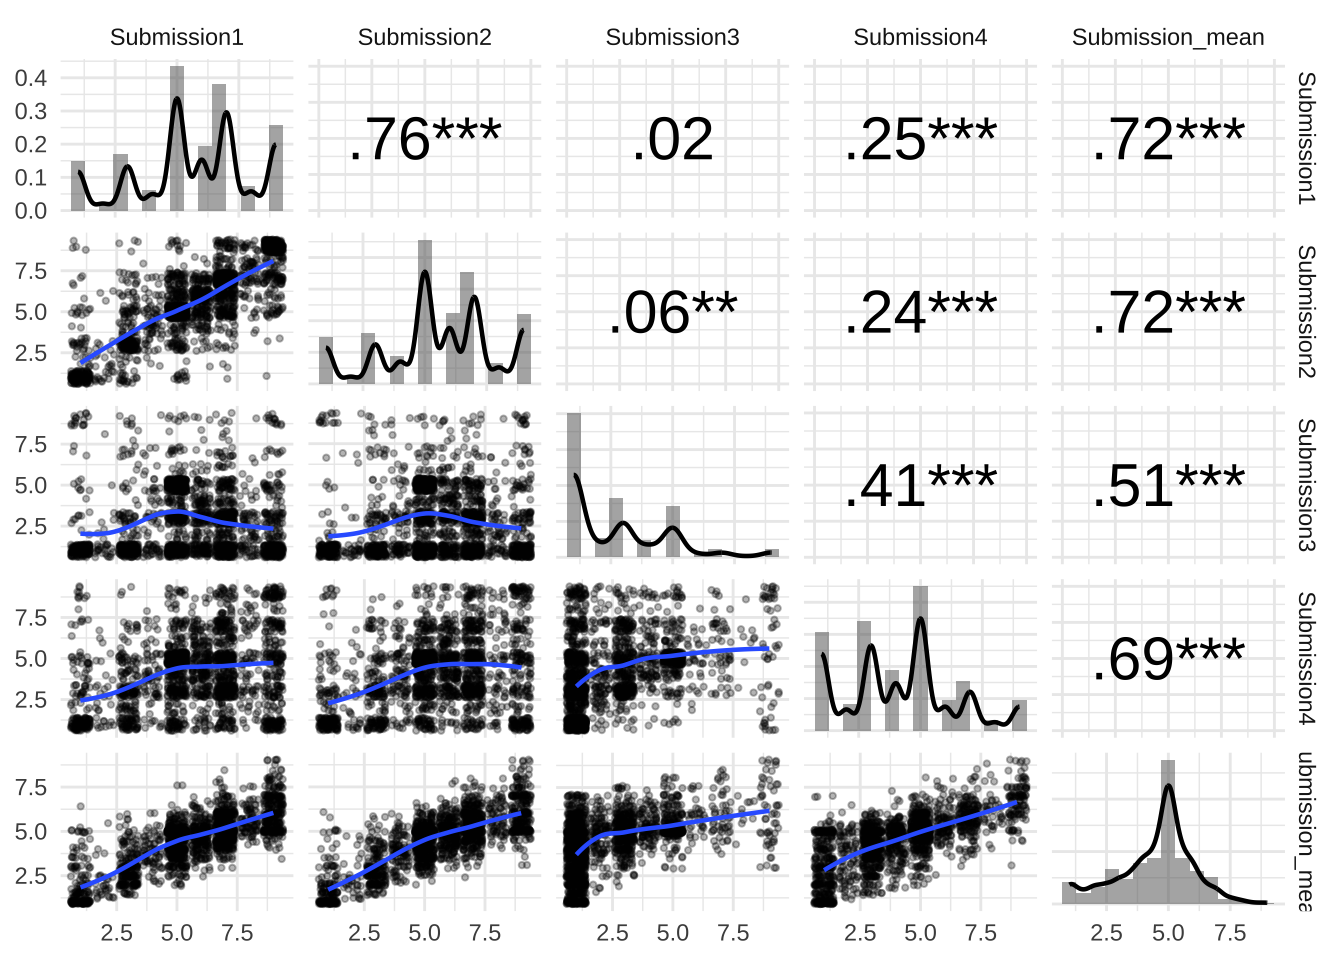
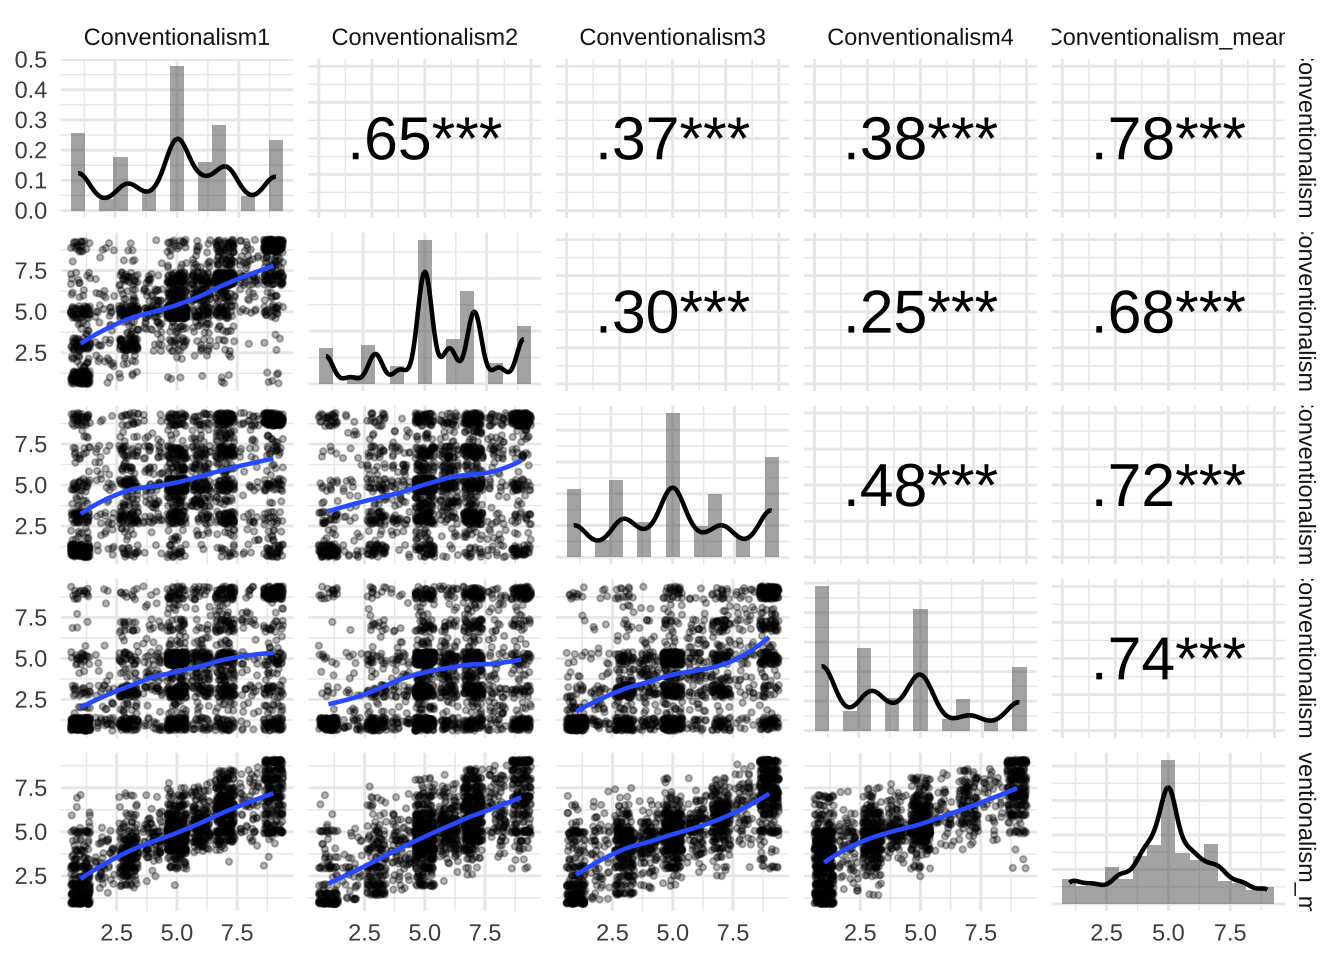
Note. Upper triangle shows Spearman’s rank-order correlations. *** p < .001, ** p < .01, * p < .05.
2.3.2 PIDF
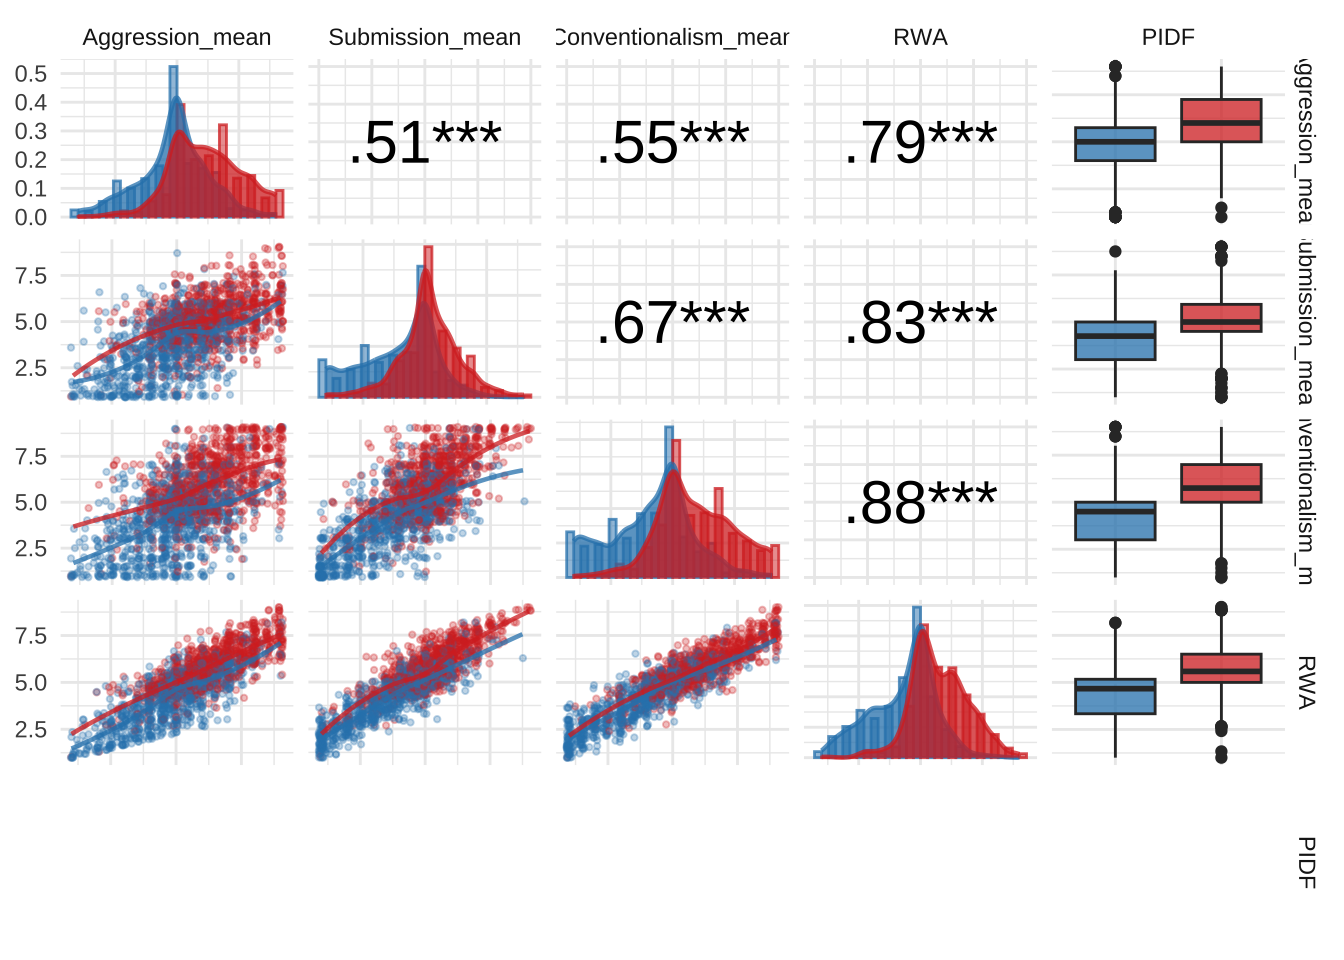
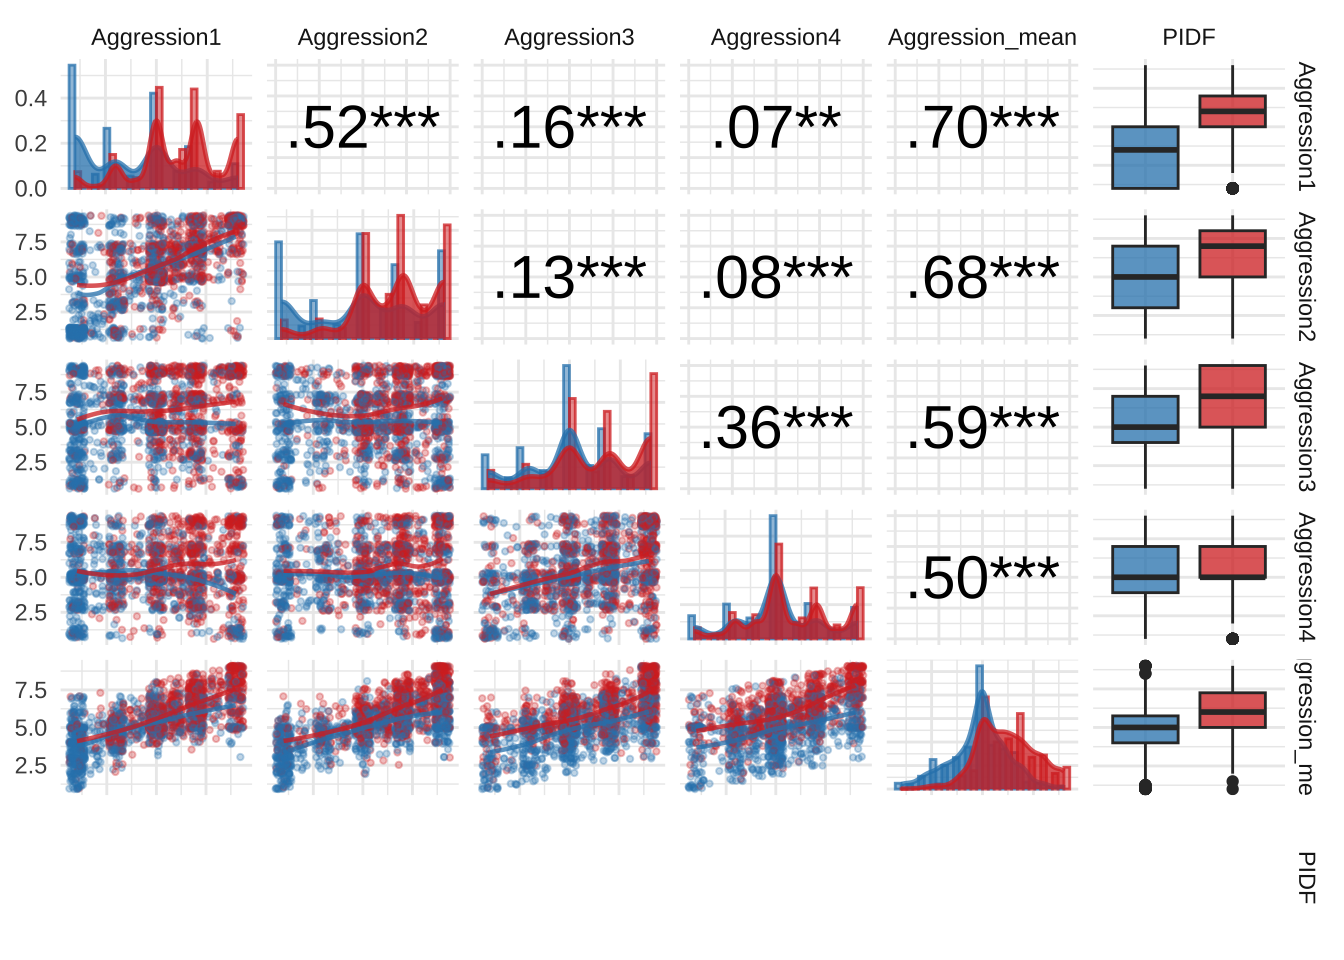
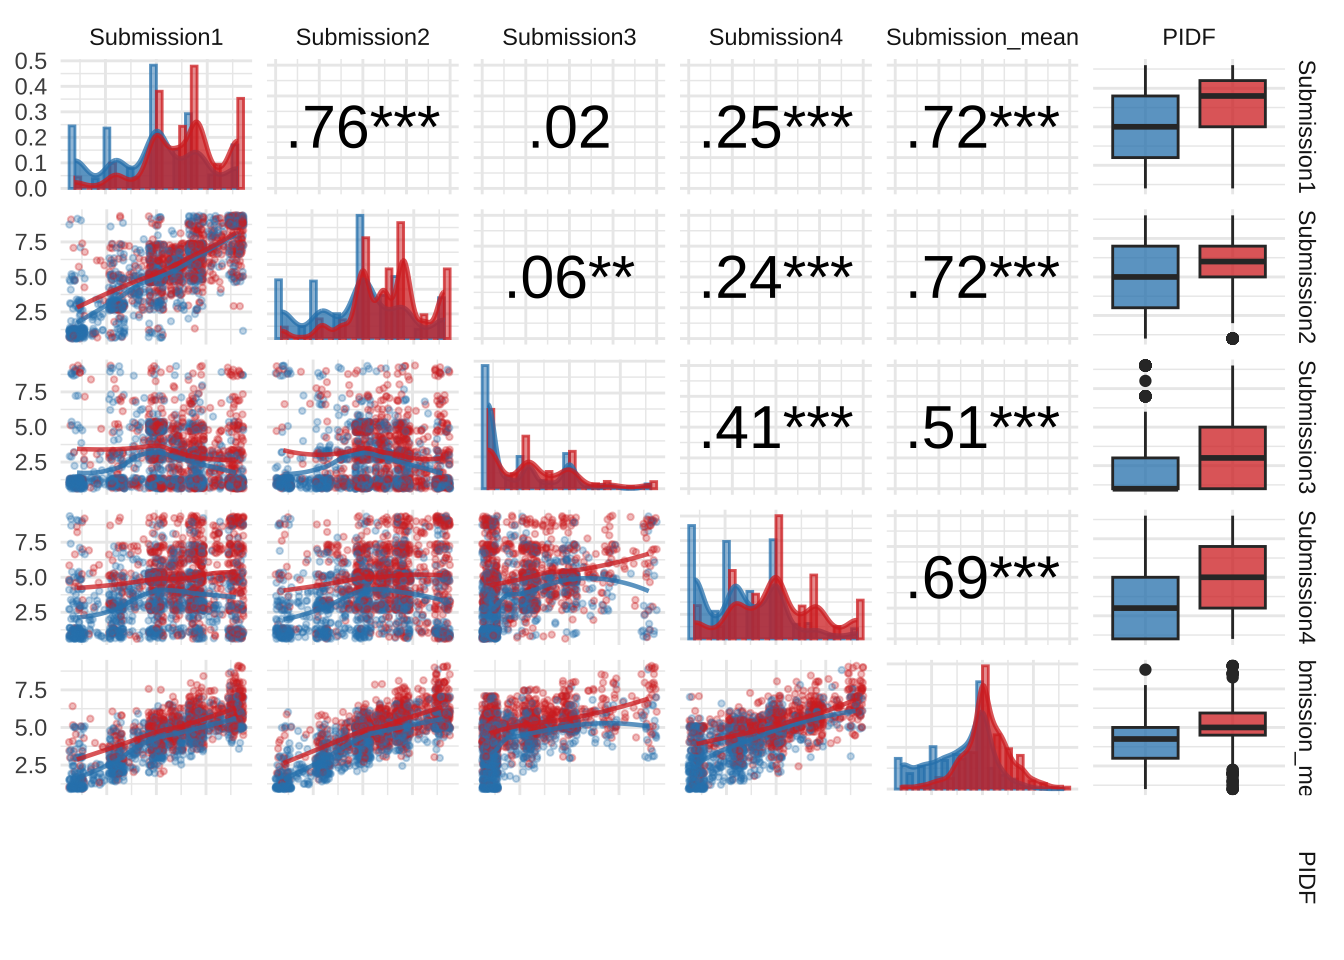
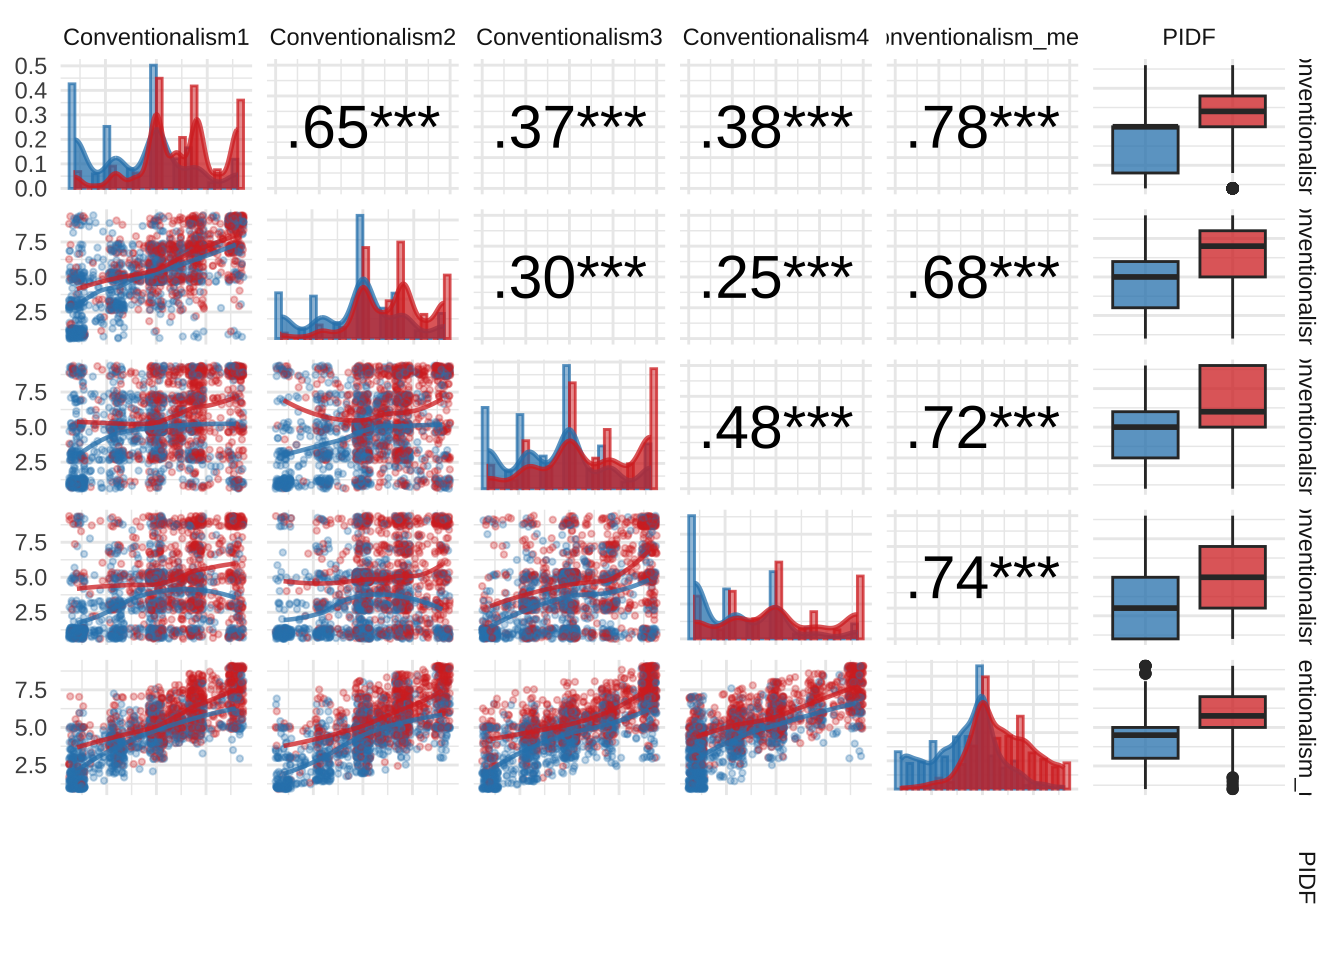
Note. Upper triangle shows Spearman’s rank-order correlations by party identity. *** p < .001, ** p < .01, * p < .05.
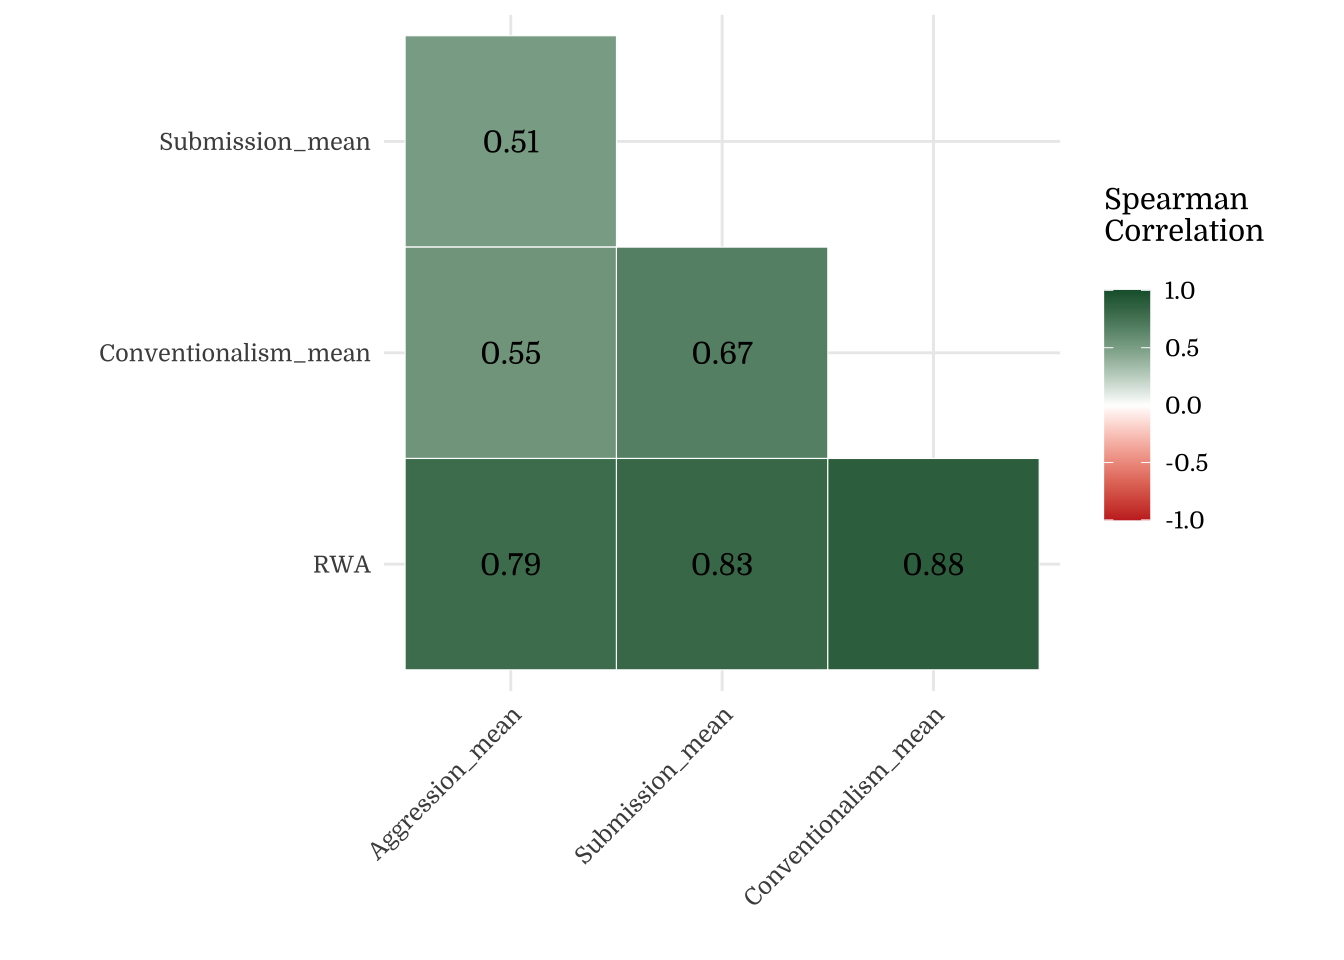
2.3.3 Correlation Matrix
3 Demographics
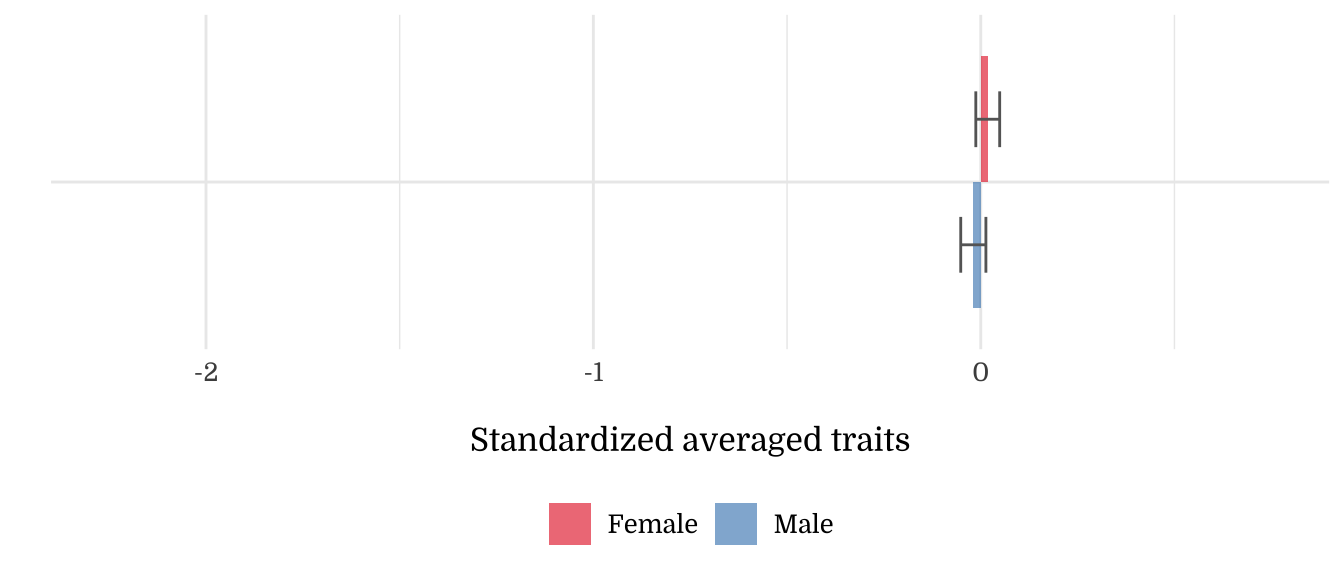
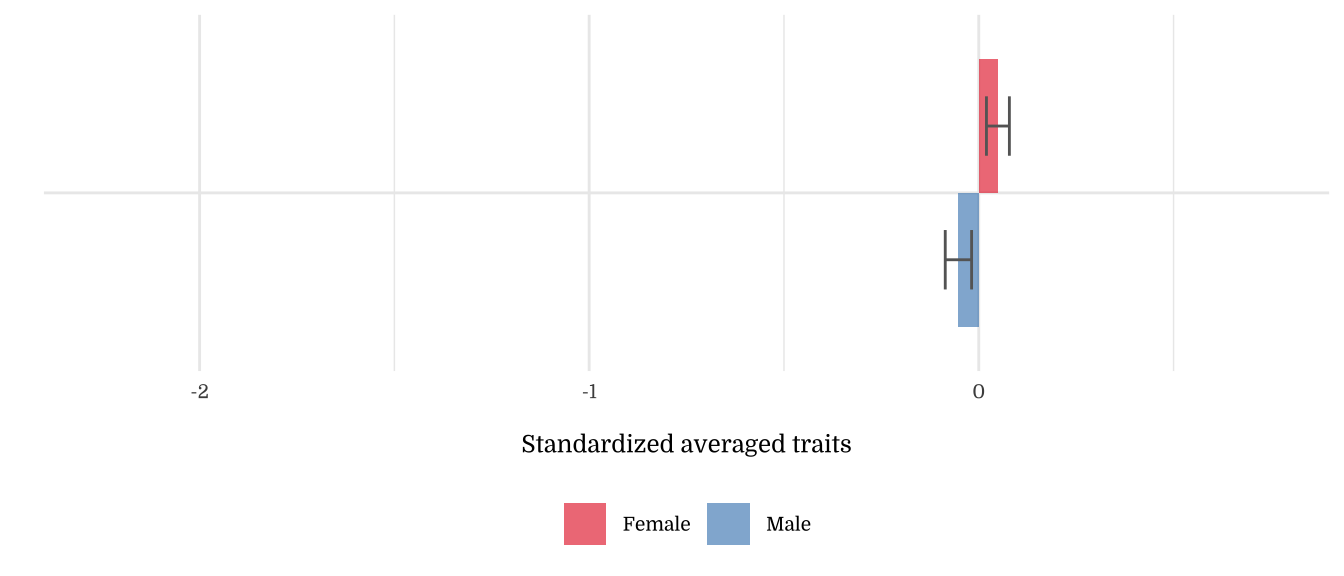
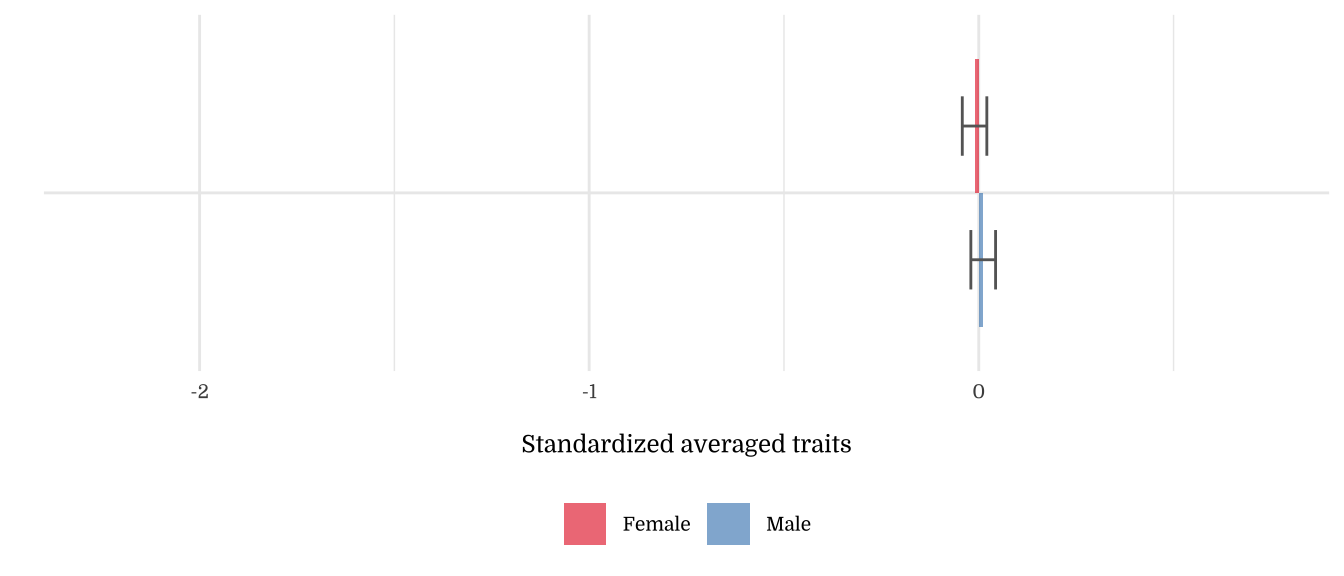
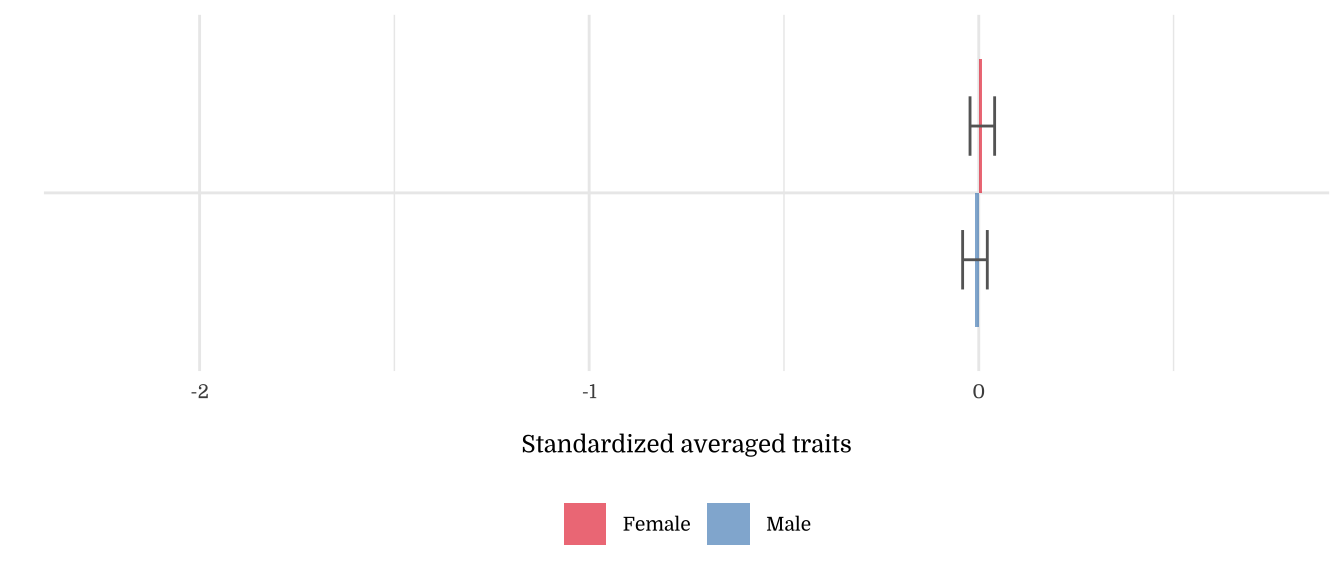
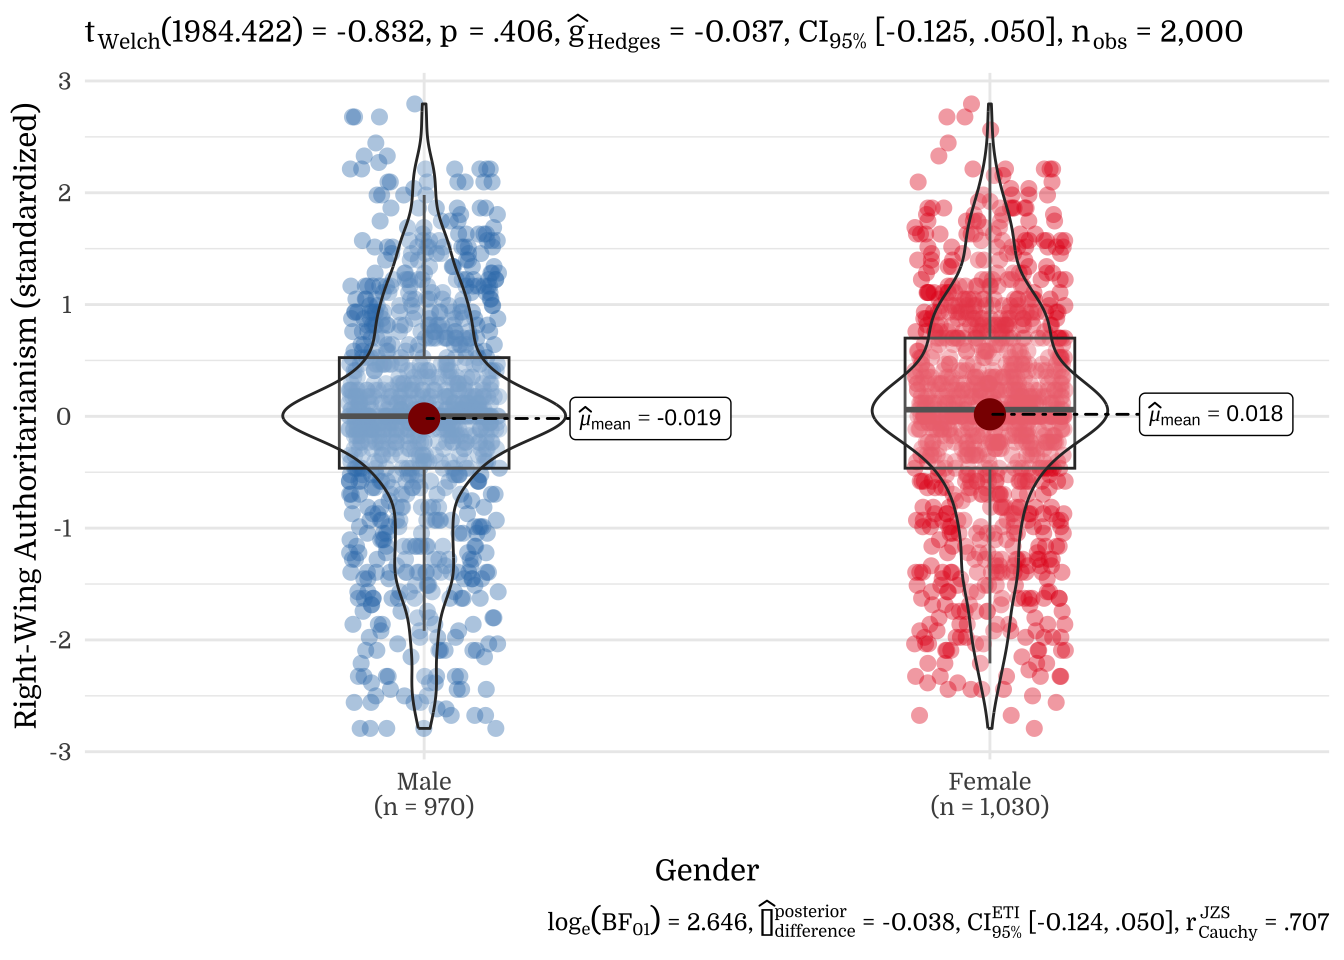
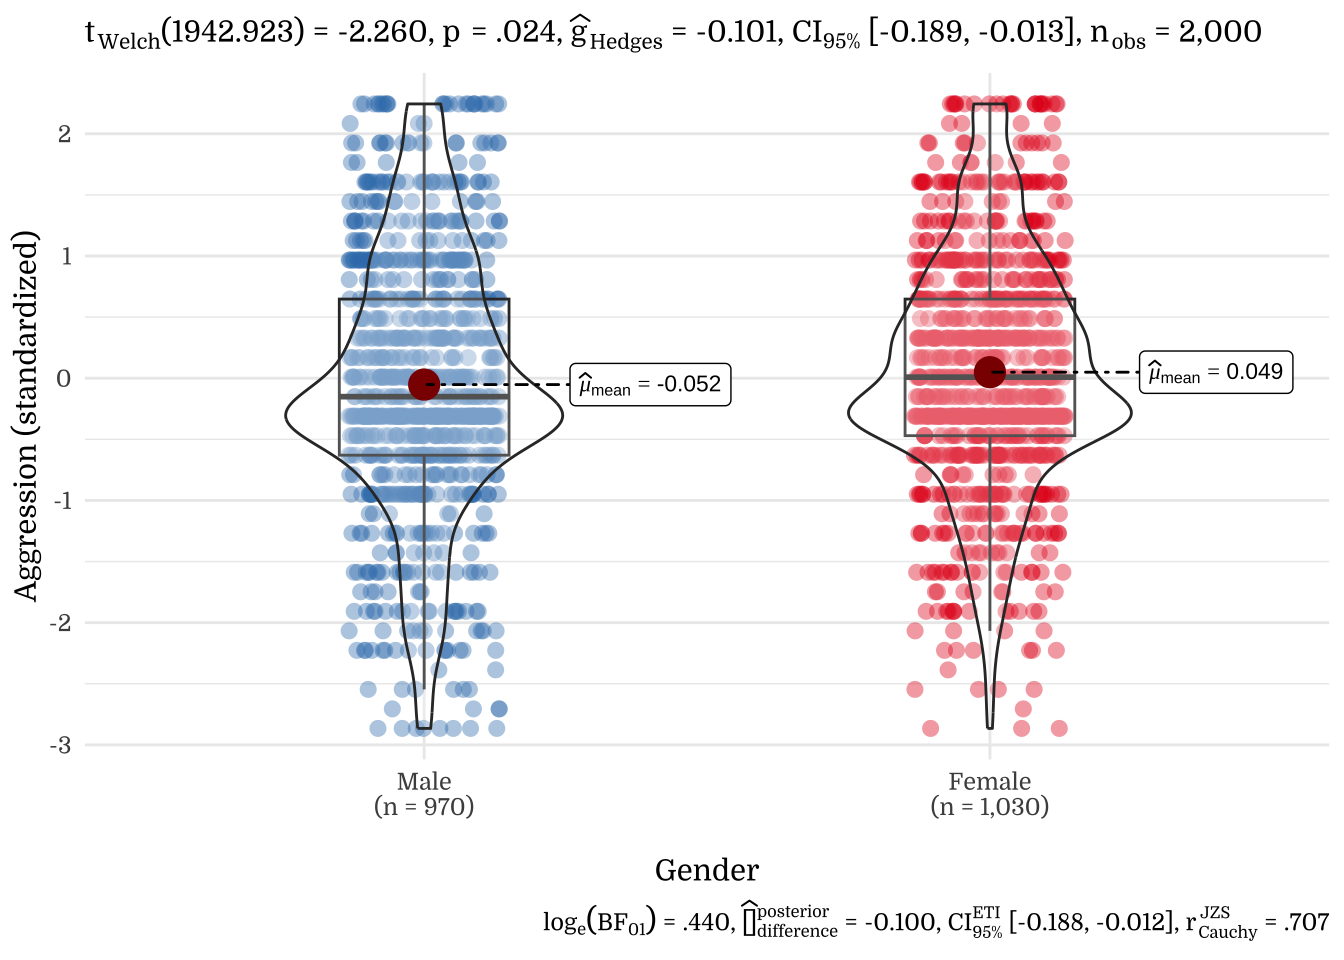
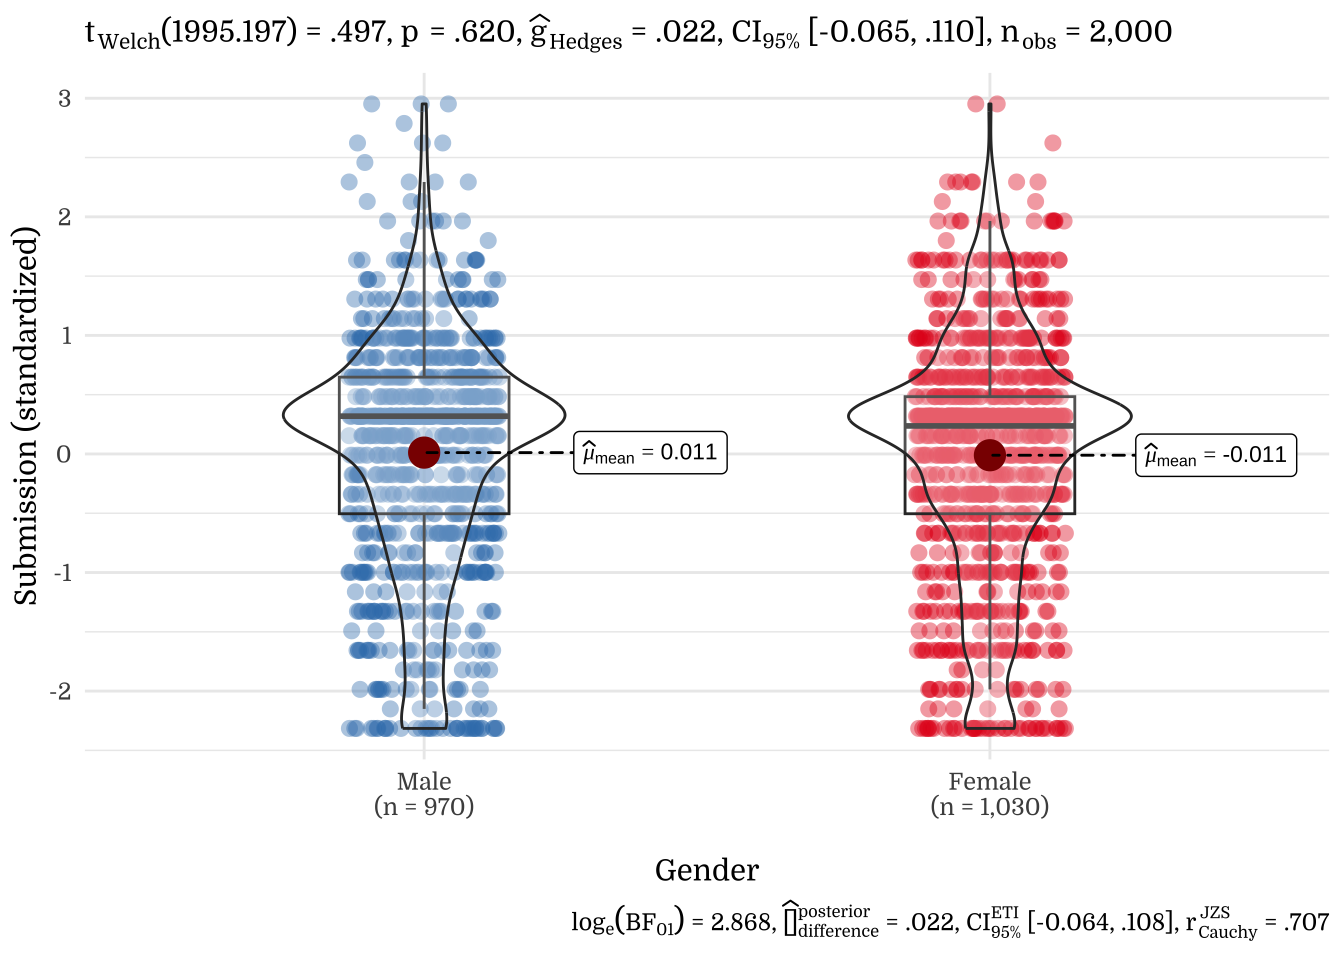
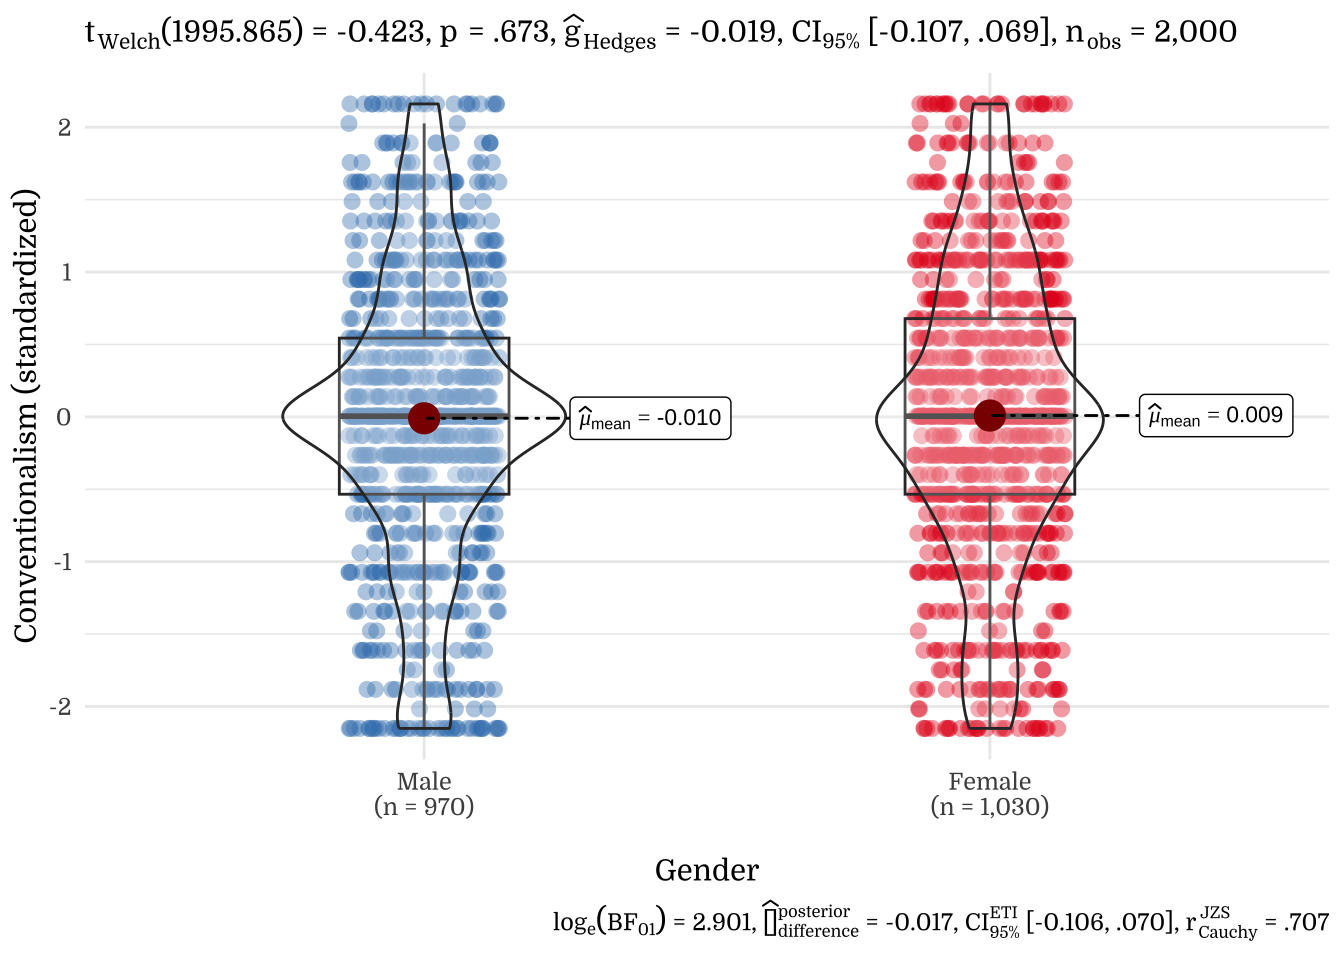
3.2 Gender
| Gender | N | Mean | SD |
|---|---|---|---|
| Female | 1030 | 0.05 | 0.94 |
| Male | 970 | -0.05 | 1.05 |
| Gender | N | Mean | SD |
|---|---|---|---|
| Female | 1030 | -0.01 | 1.01 |
| Male | 970 | 0.01 | 0.99 |
| Gender | N | Mean | SD |
|---|---|---|---|
| Female | 1030 | 0.01 | 1.01 |
| Male | 970 | -0.01 | 0.99 |
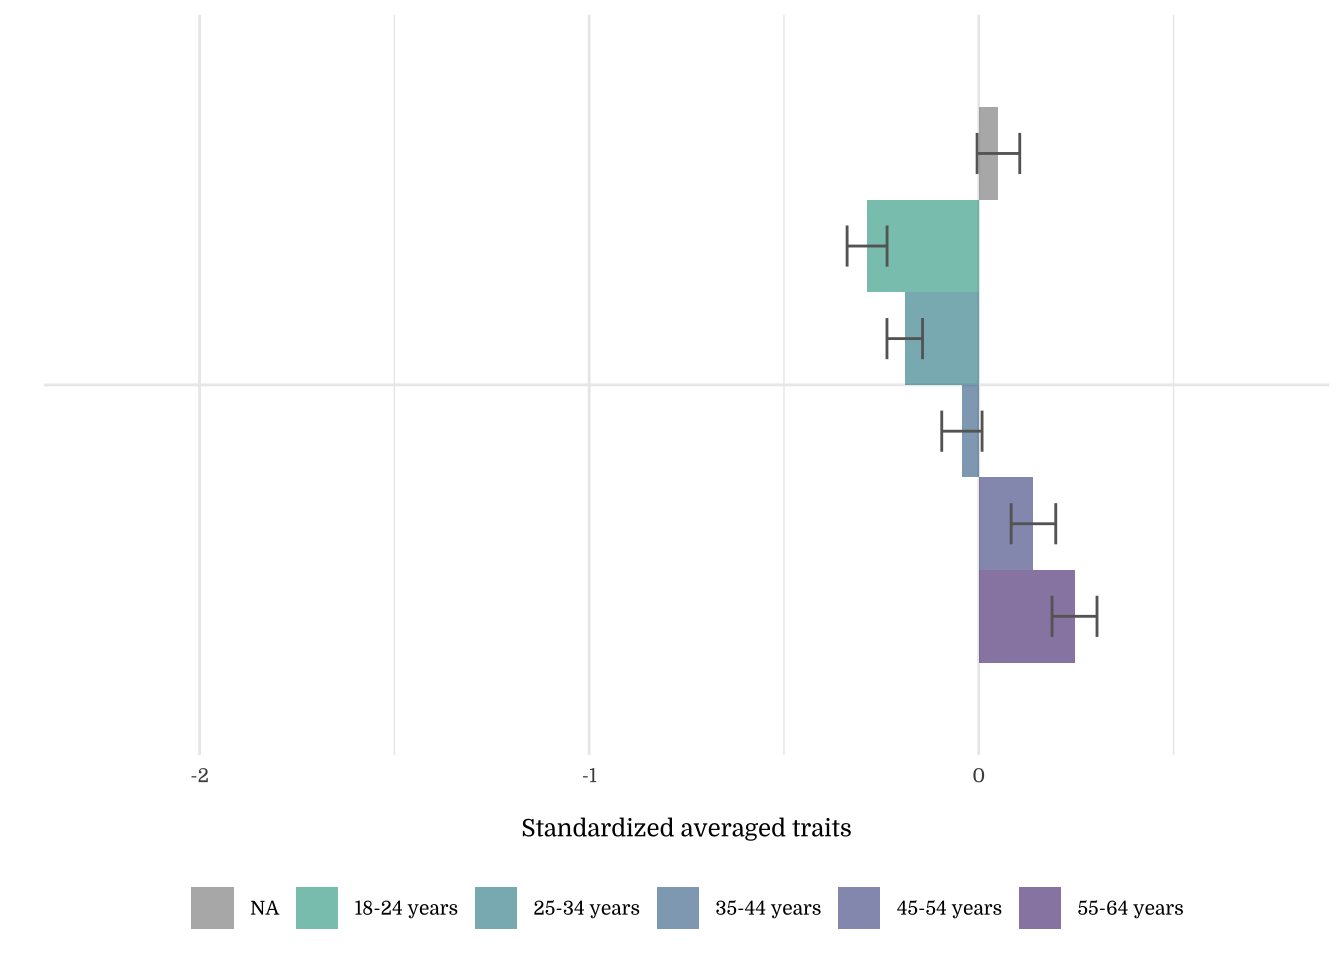
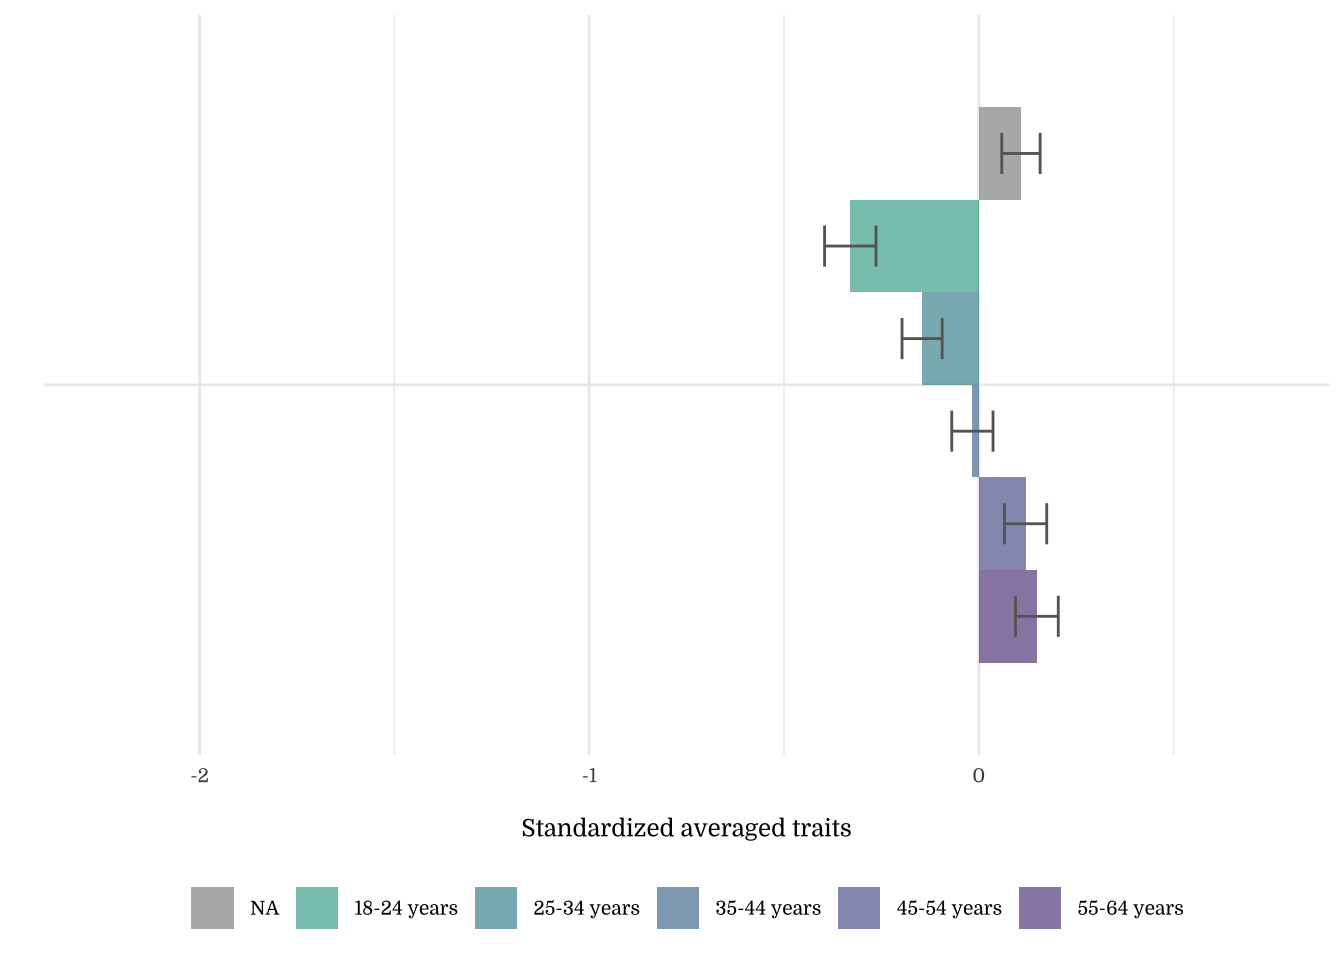
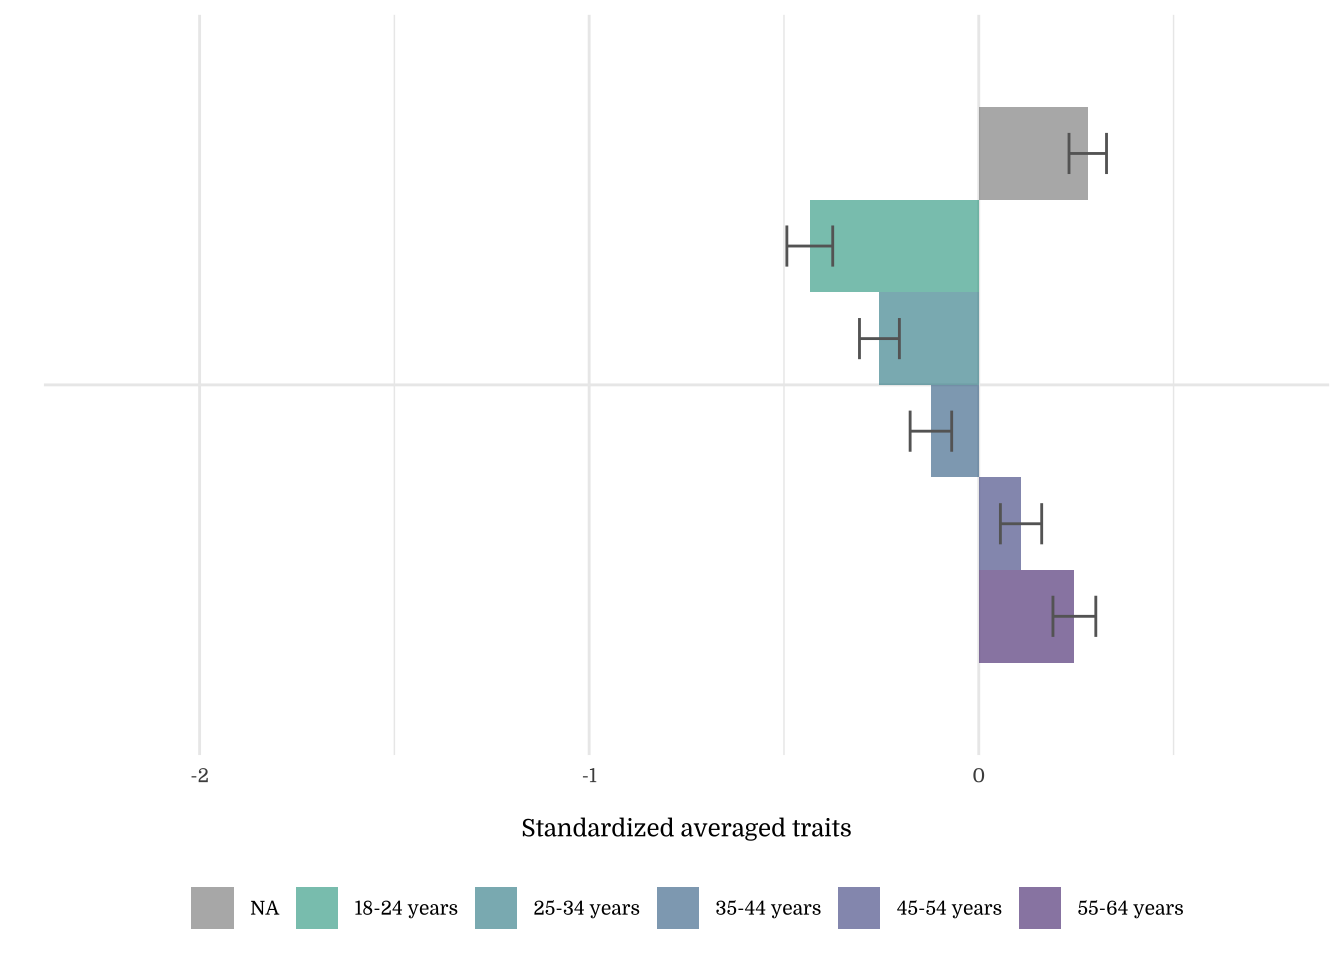
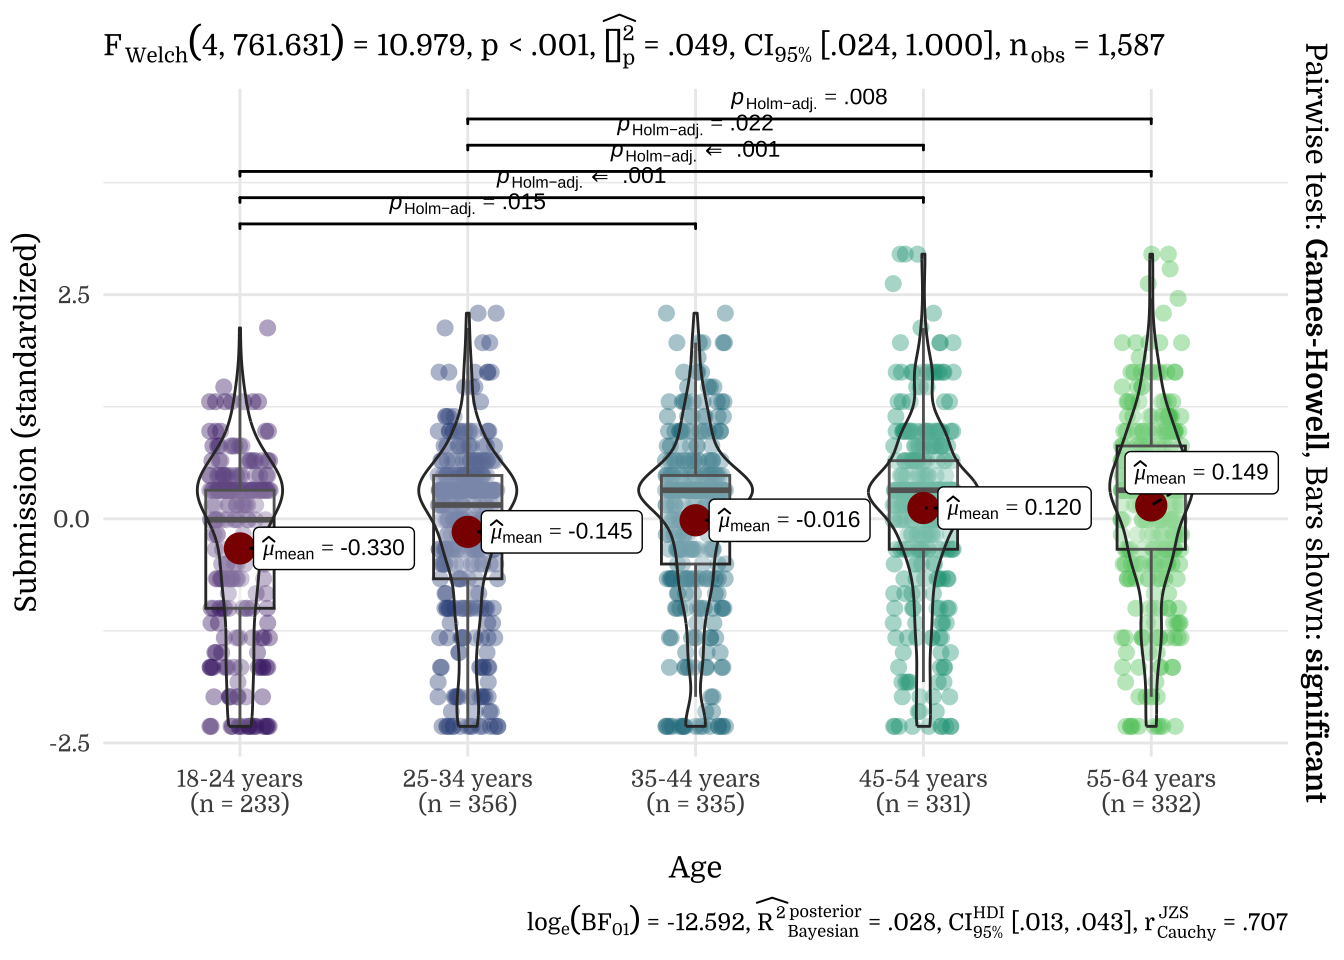
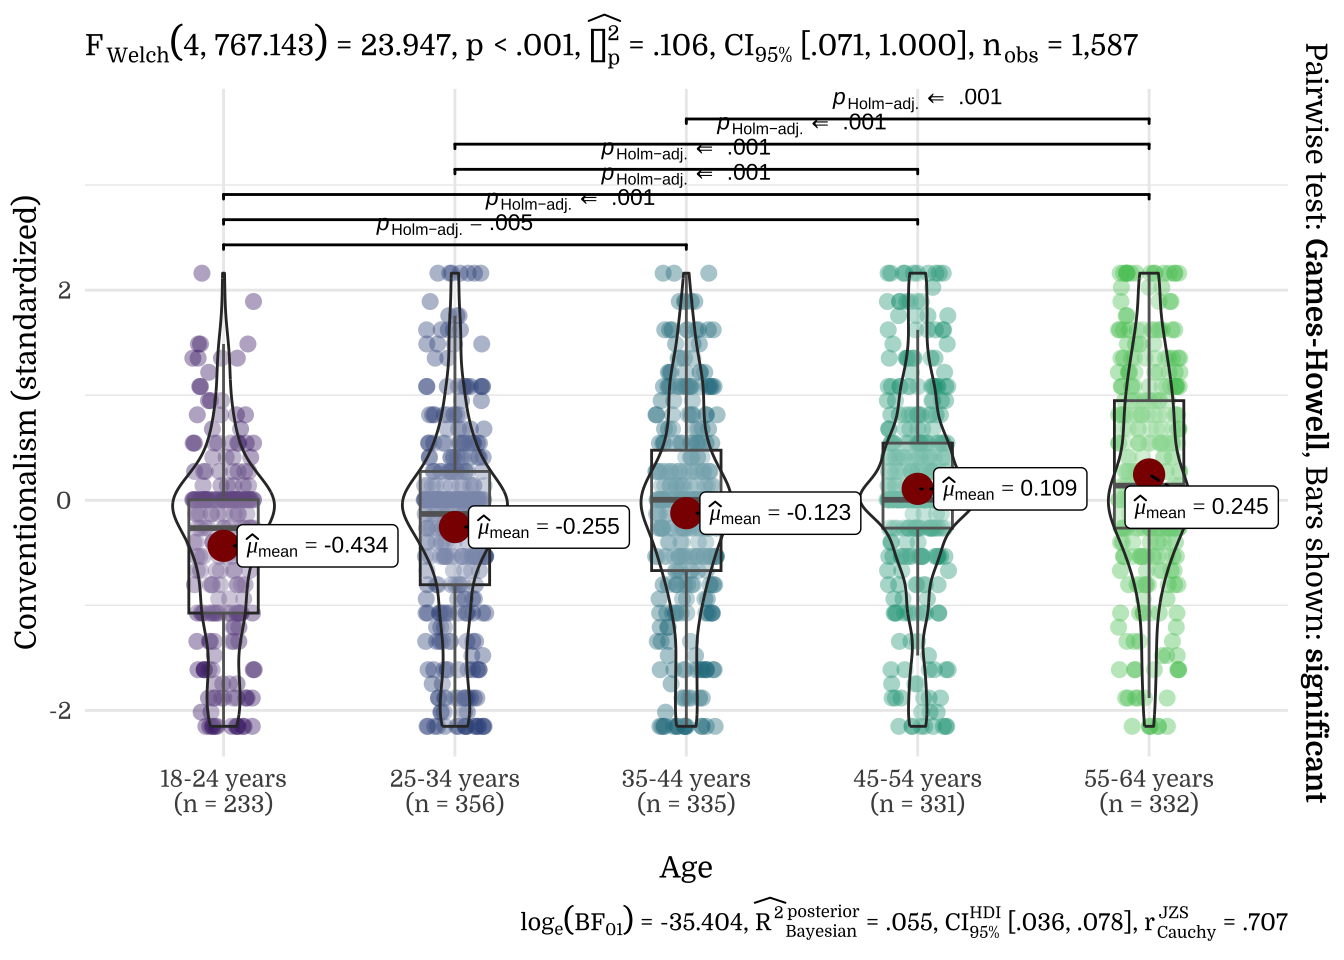
3.3 Age
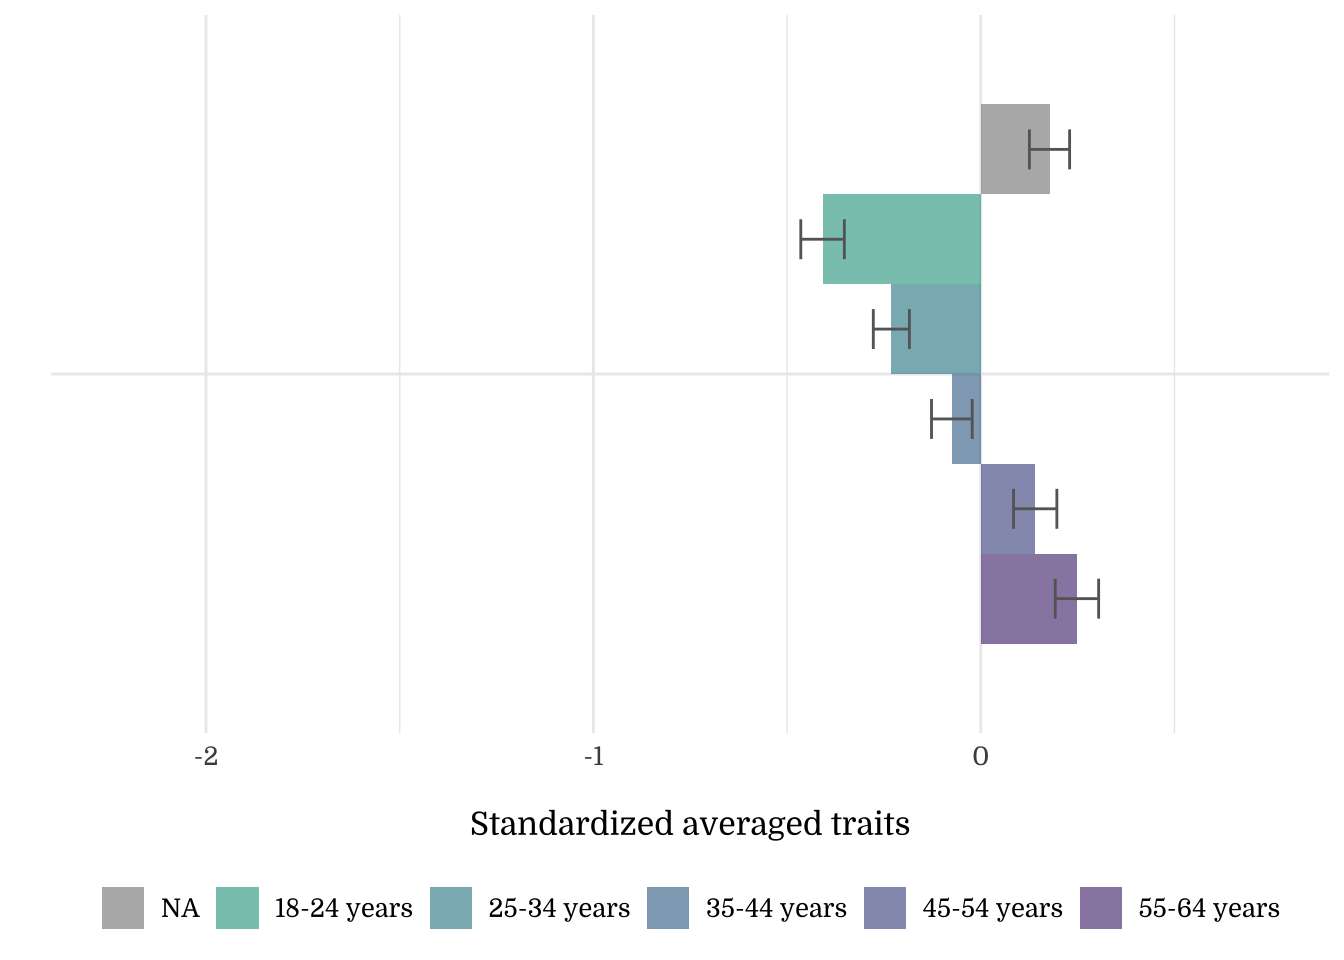

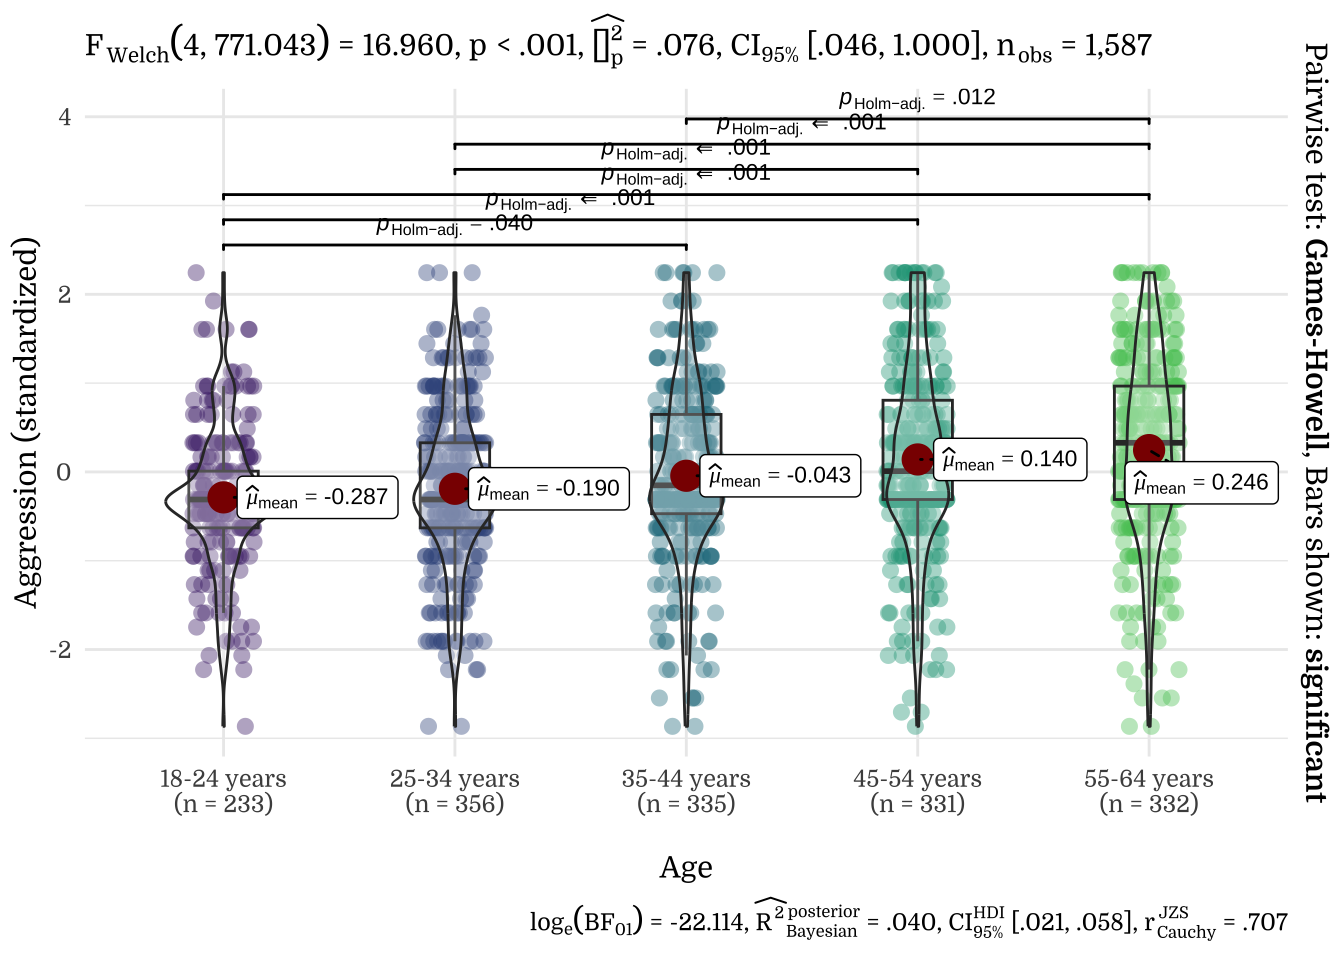
| Age | N | Mean | SD |
|---|---|---|---|
| 18-24 years | 233 | -0.29 | 0.78 |
| 25-34 years | 356 | -0.19 | 0.86 |
| 35-44 years | 335 | -0.04 | 0.95 |
| 45-54 years | 331 | 0.14 | 1.04 |
| 55-64 years | 332 | 0.25 | 1.05 |
| NA | 413 | 0.05 | 1.11 |
| Age | N | Mean | SD |
|---|---|---|---|
| 18-24 years | 233 | -0.33 | 1.01 |
| 25-34 years | 356 | -0.15 | 0.97 |
| 35-44 years | 335 | -0.02 | 0.97 |
| 45-54 years | 331 | 0.12 | 0.98 |
| 55-64 years | 332 | 0.15 | 1.00 |
| NA | 413 | 0.11 | 1.00 |
| Age | N | Mean | SD |
|---|---|---|---|
| 18-24 years | 233 | -0.43 | 0.90 |
| 25-34 years | 356 | -0.25 | 0.97 |
| 35-44 years | 335 | -0.12 | 0.98 |
| 45-54 years | 331 | 0.11 | 0.96 |
| 55-64 years | 332 | 0.25 | 1.00 |
| NA | 413 | 0.28 | 0.98 |
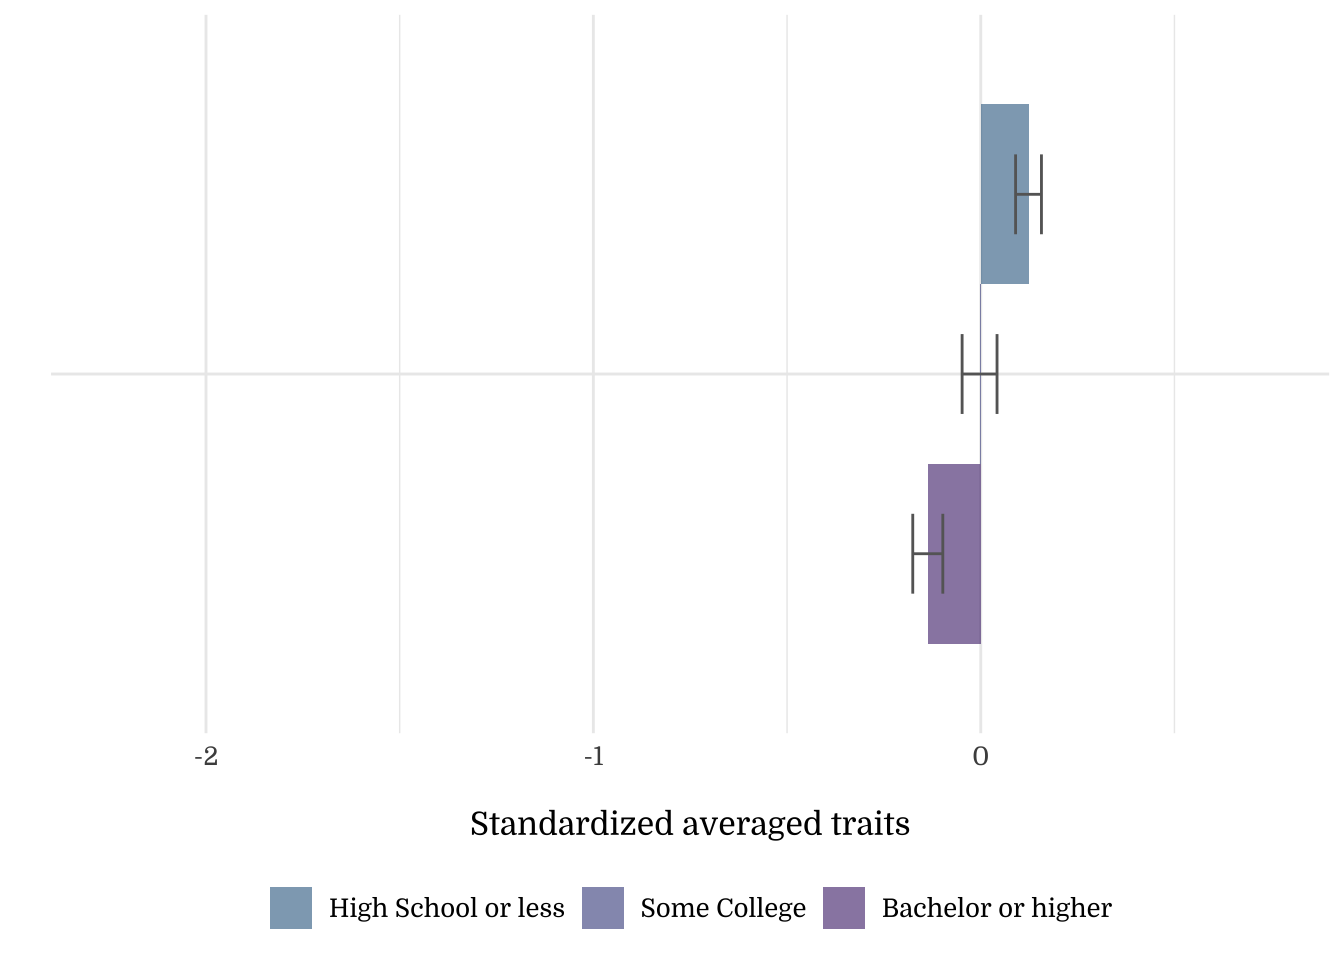
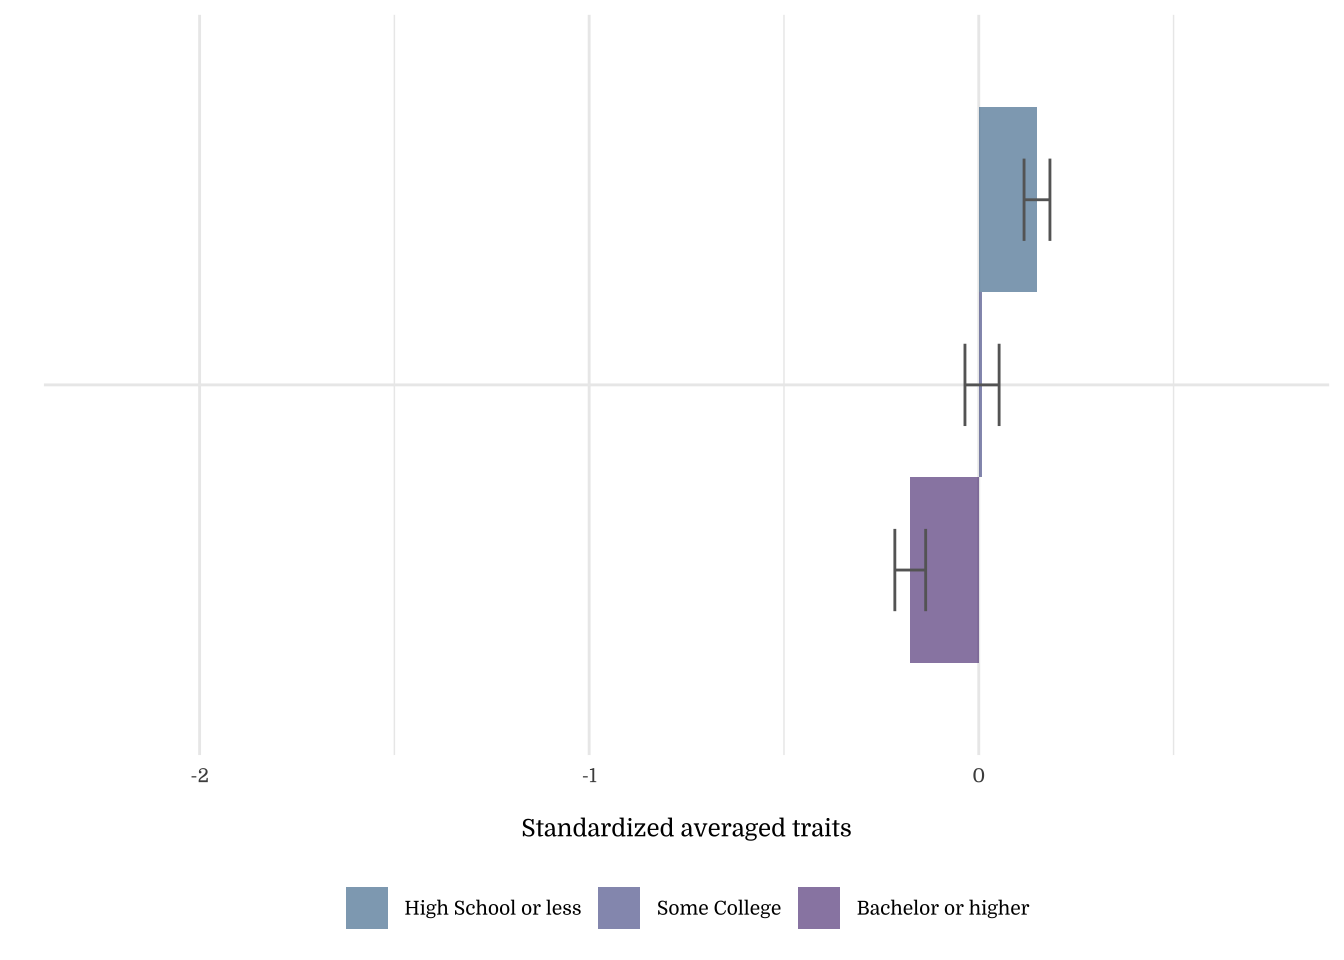
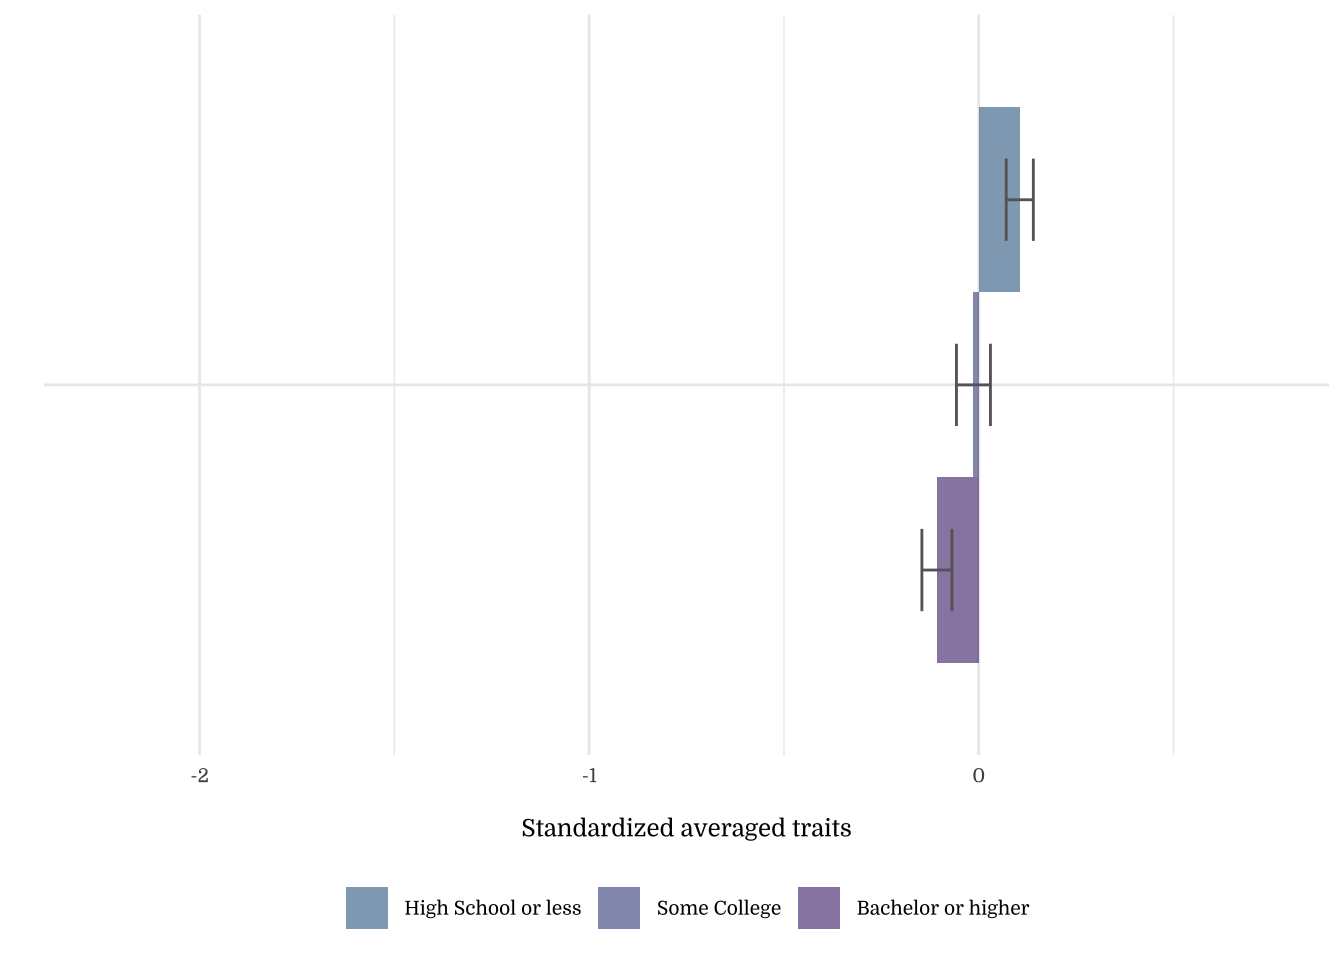
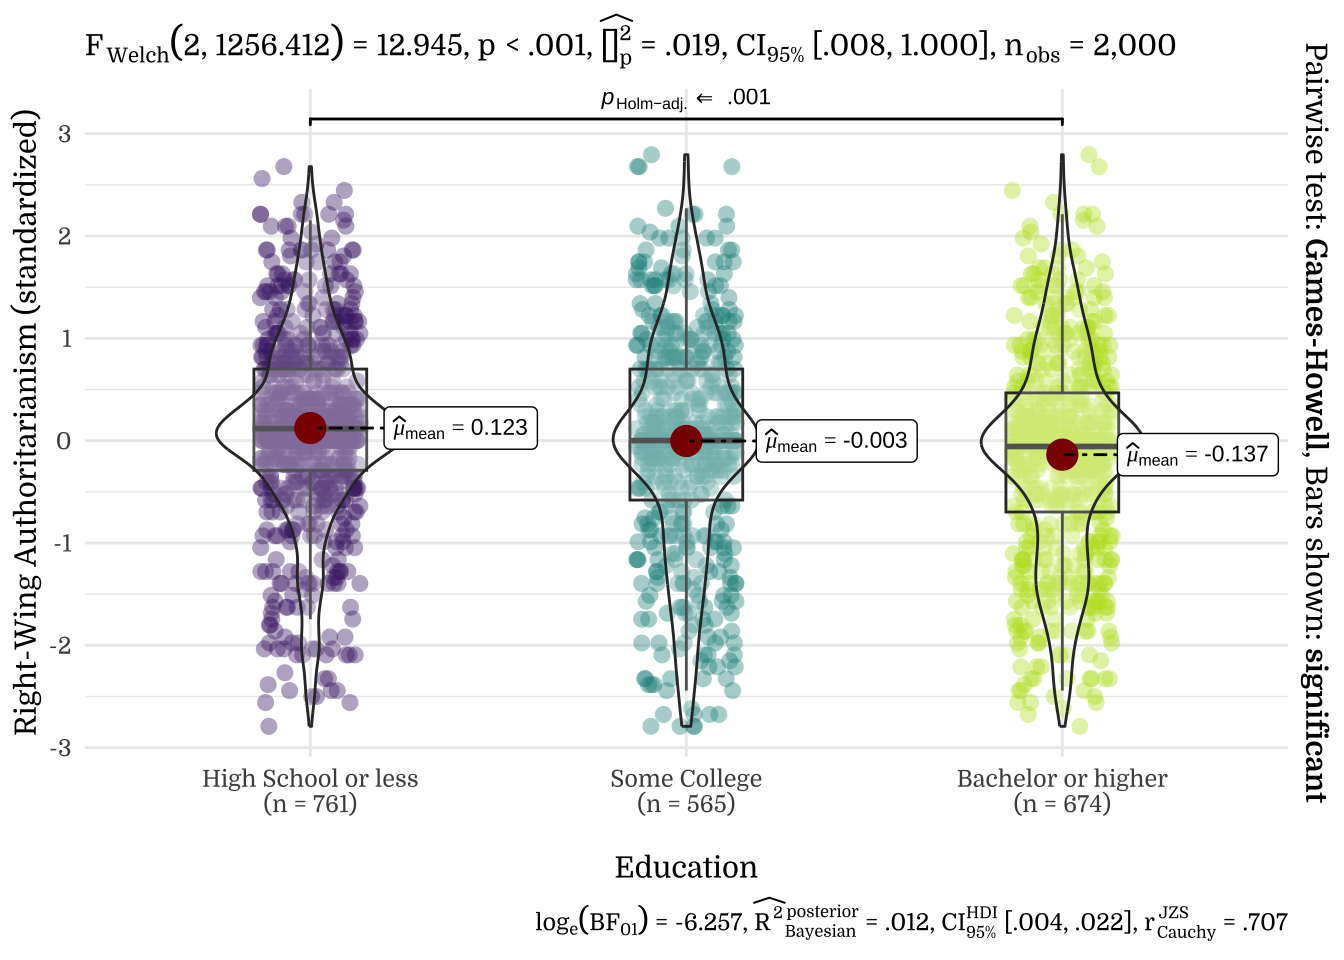
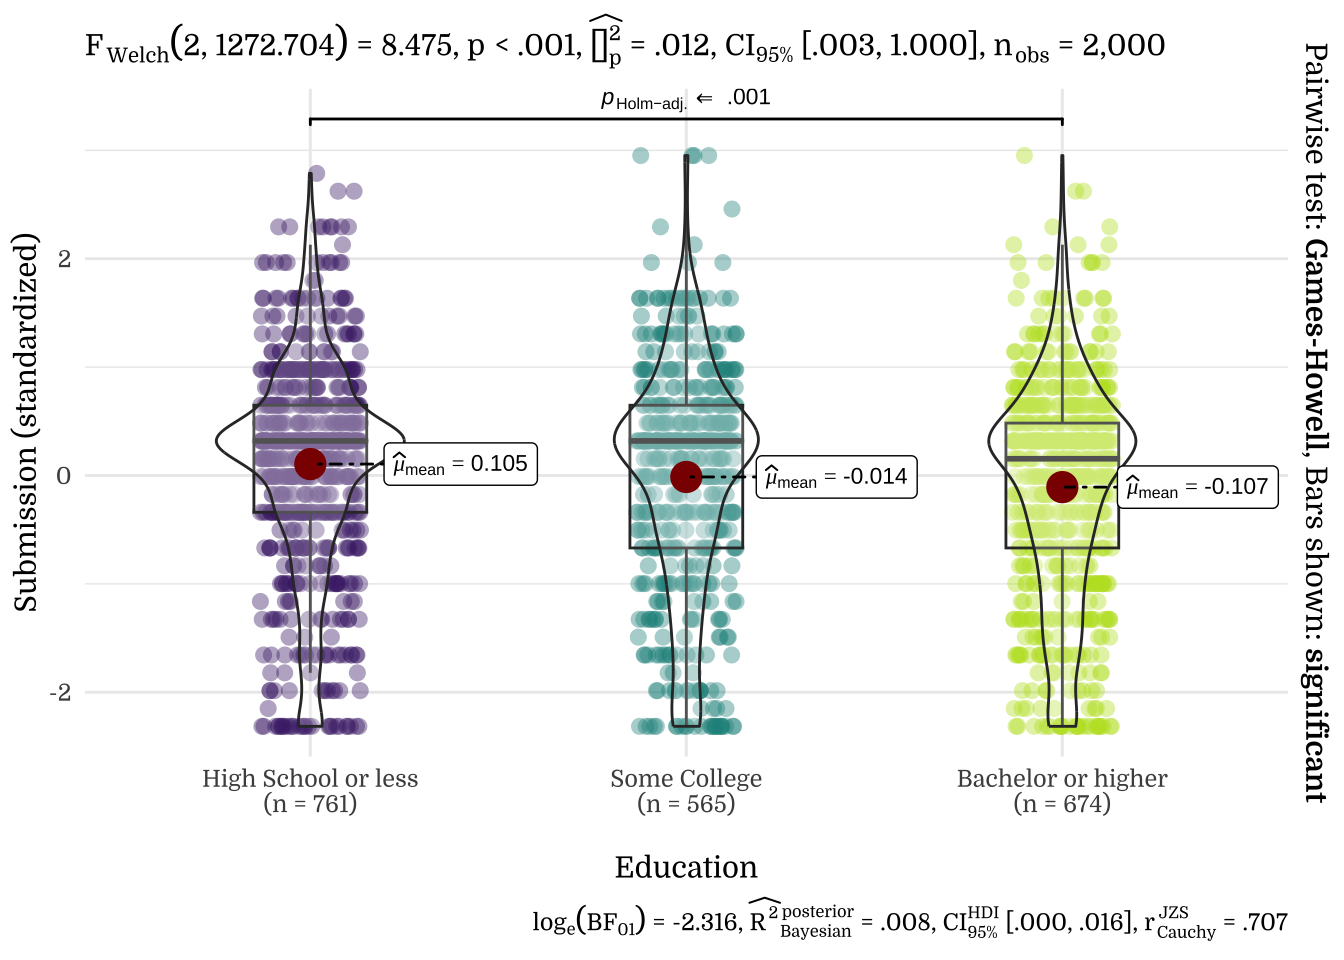
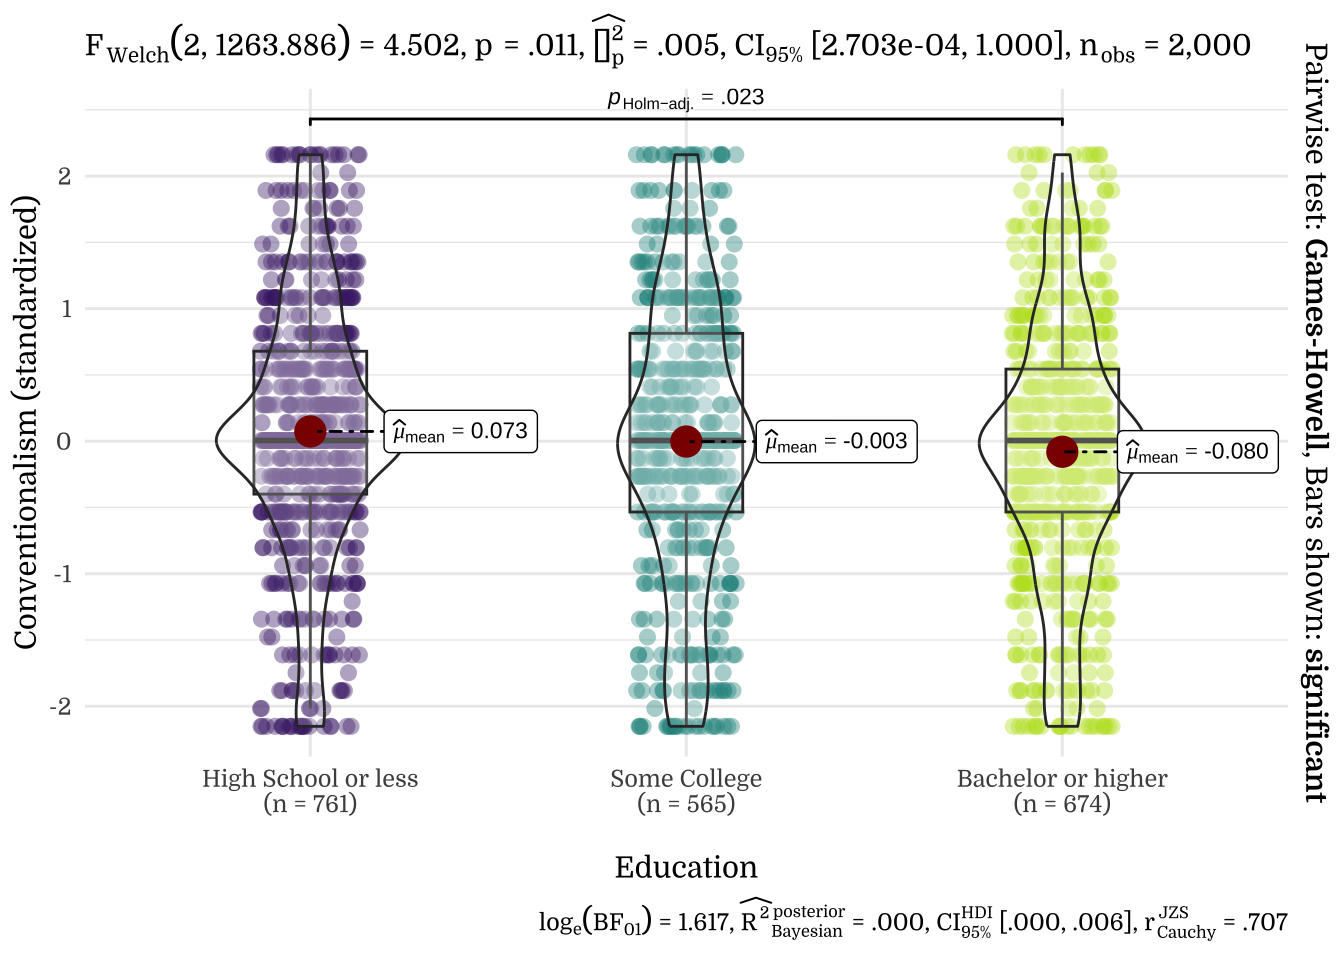
3.4 Education
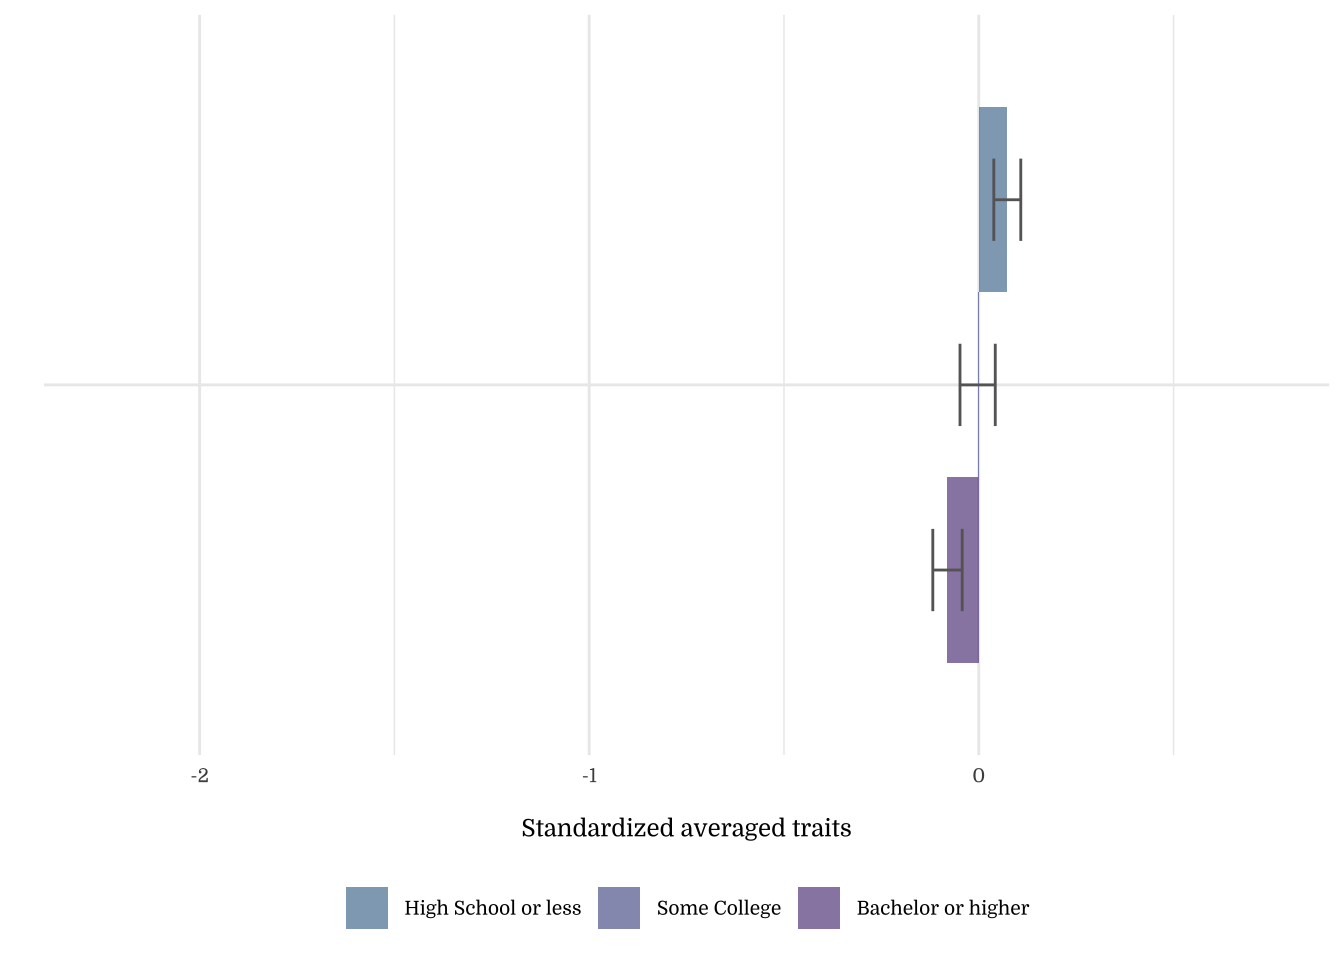
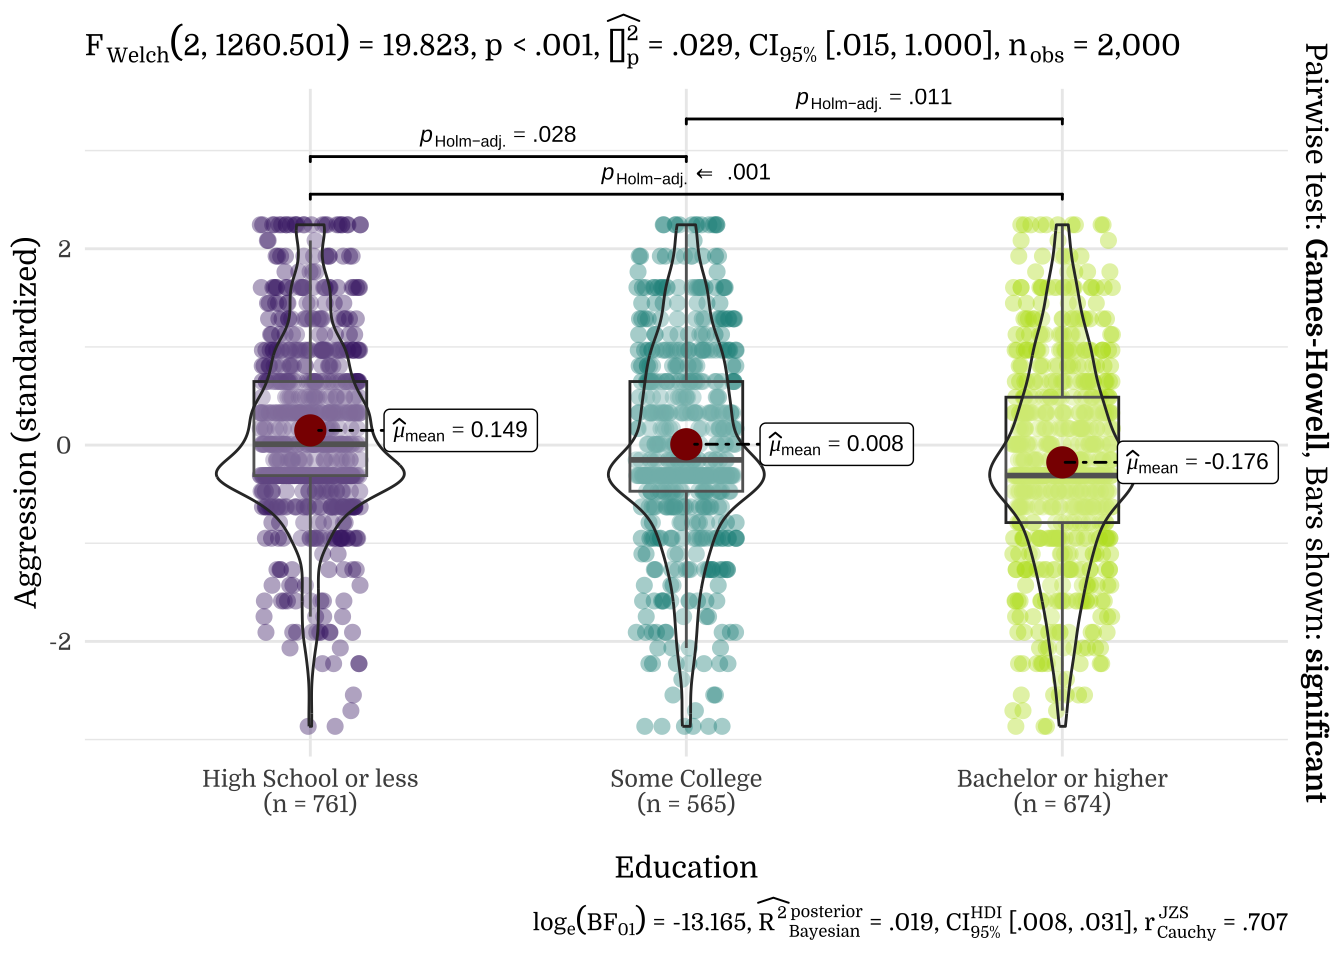
| Education | N | Mean | SD |
|---|---|---|---|
| High School or less | 761 | 0.15 | 0.92 |
| Some College | 565 | 0.01 | 1.04 |
| Bachelor or higher | 674 | -0.18 | 1.03 |
| Education | N | Mean | SD |
|---|---|---|---|
| High School or less | 761 | 0.11 | 0.96 |
| Some College | 565 | -0.01 | 1.04 |
| Bachelor or higher | 674 | -0.11 | 1.00 |
| Education | N | Mean | SD |
|---|---|---|---|
| High School or less | 761 | 0.07 | 0.96 |
| Some College | 565 | 0.00 | 1.08 |
| Bachelor or higher | 674 | -0.08 | 0.98 |
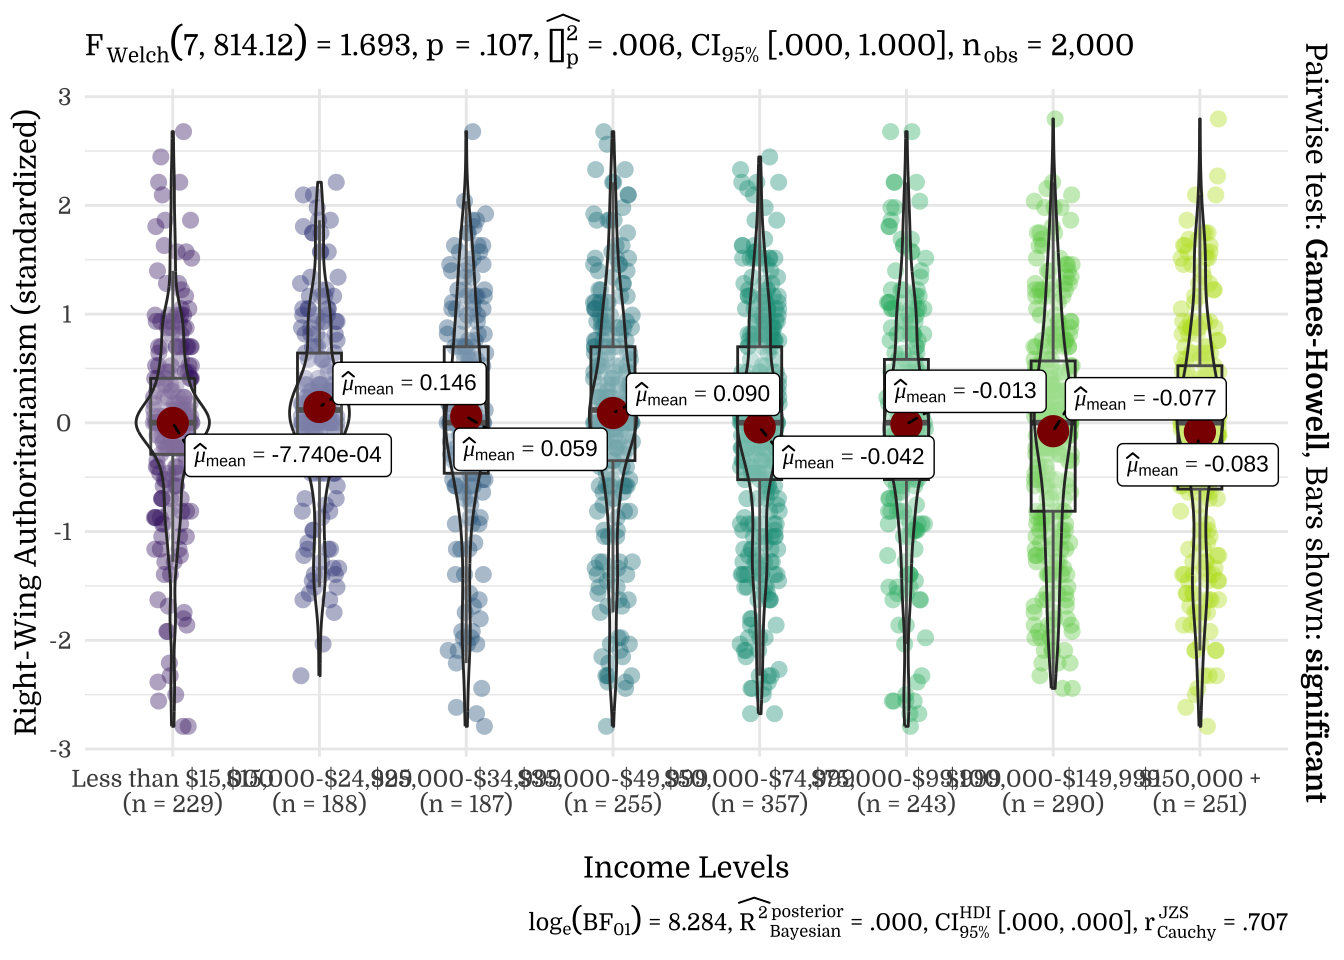
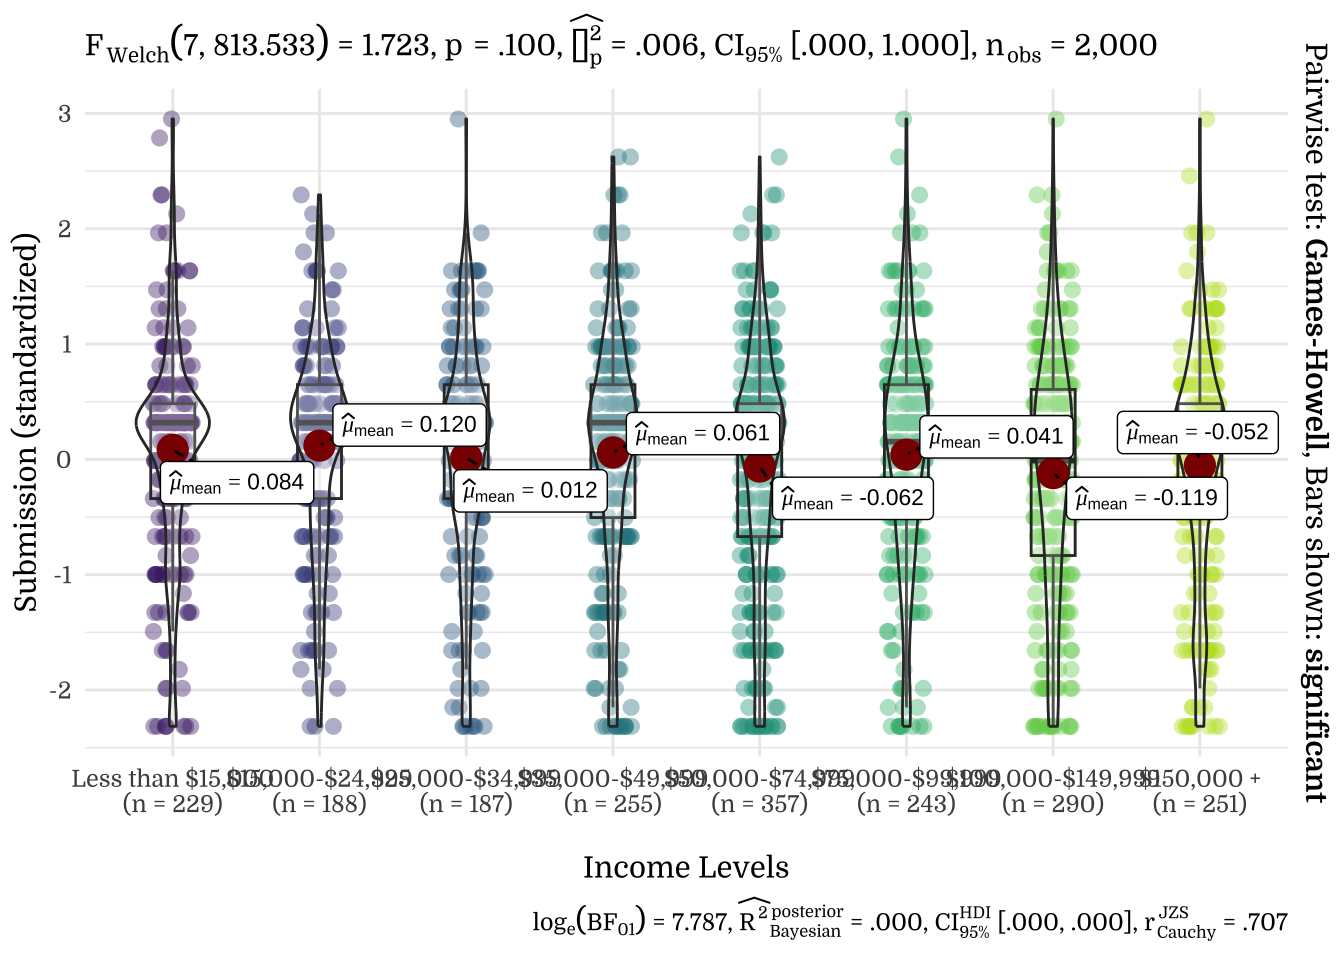
3.5 Income Levels
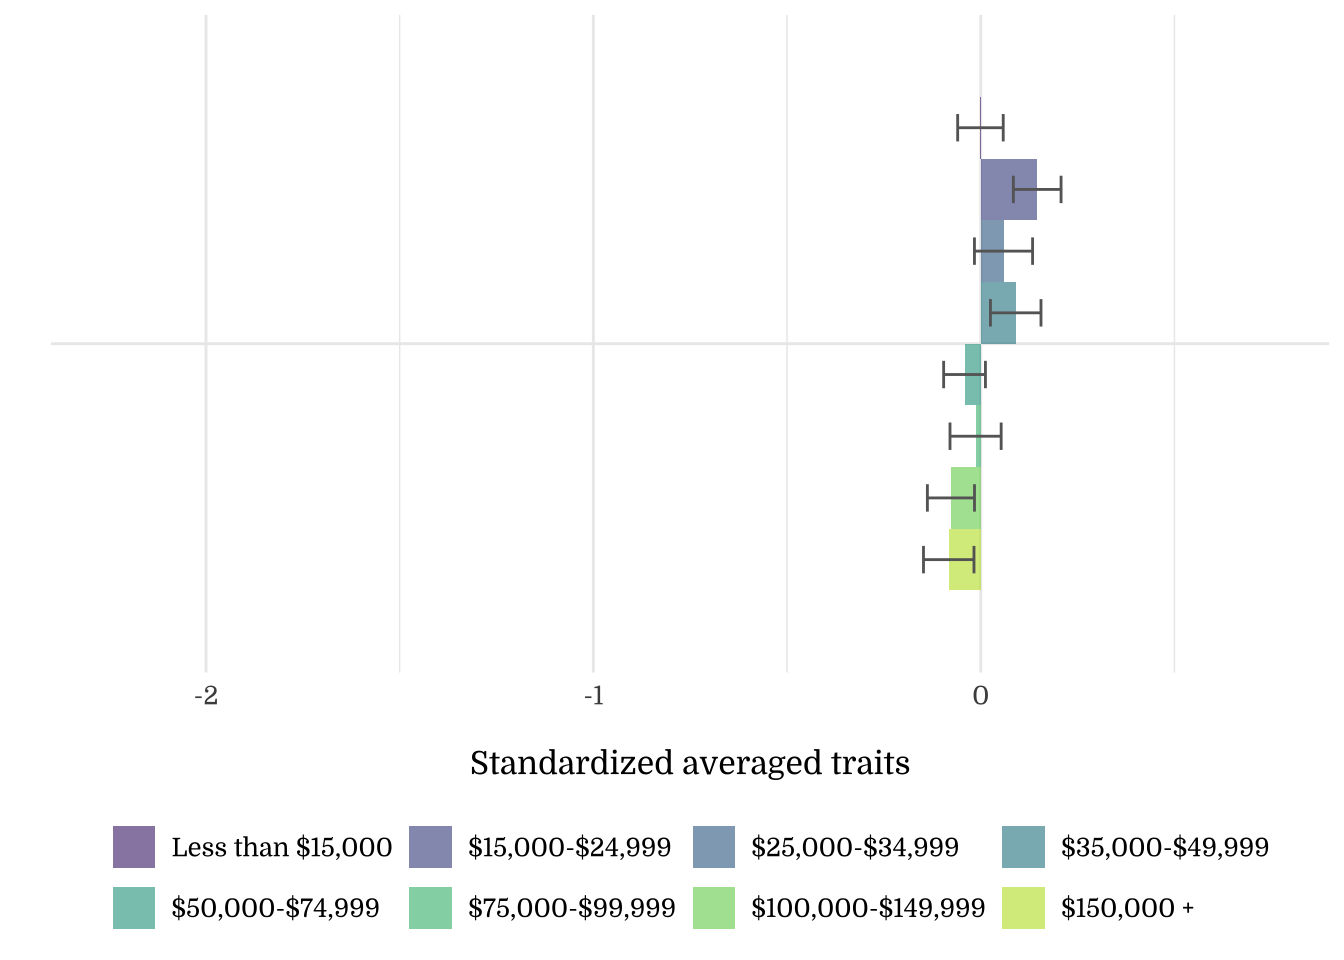
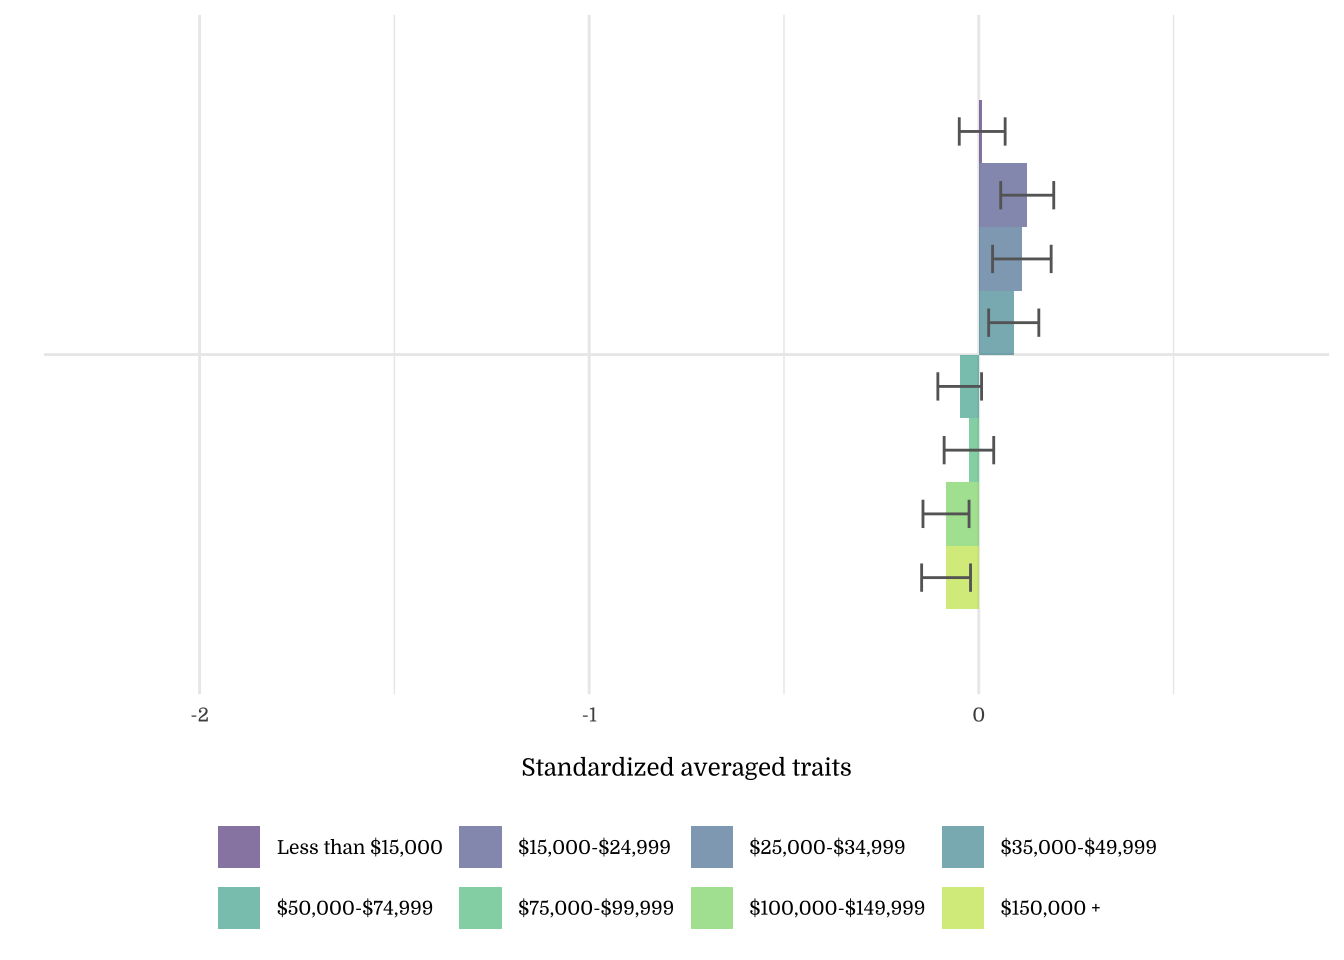
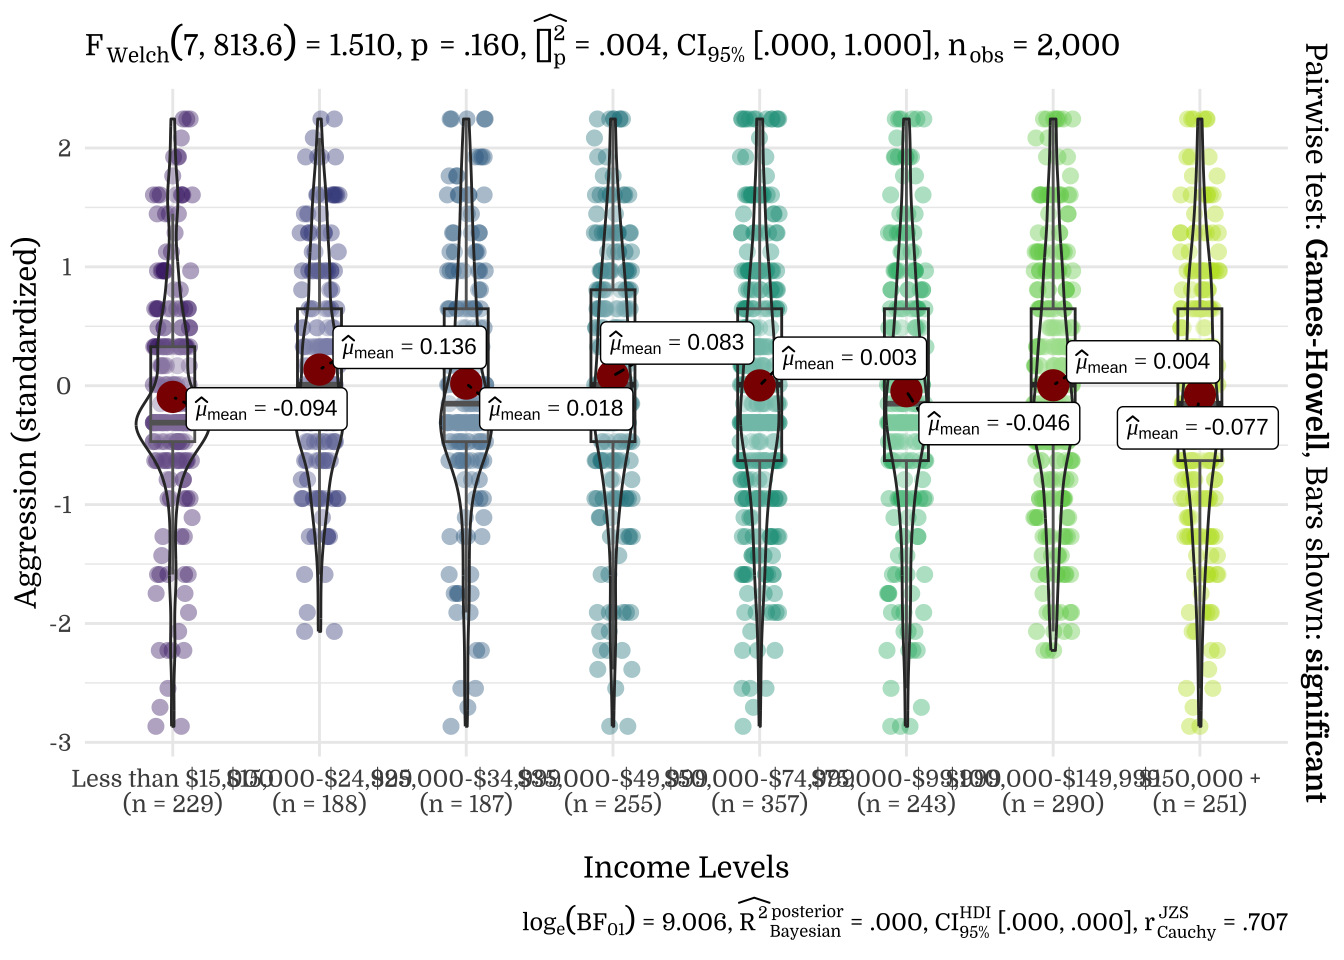
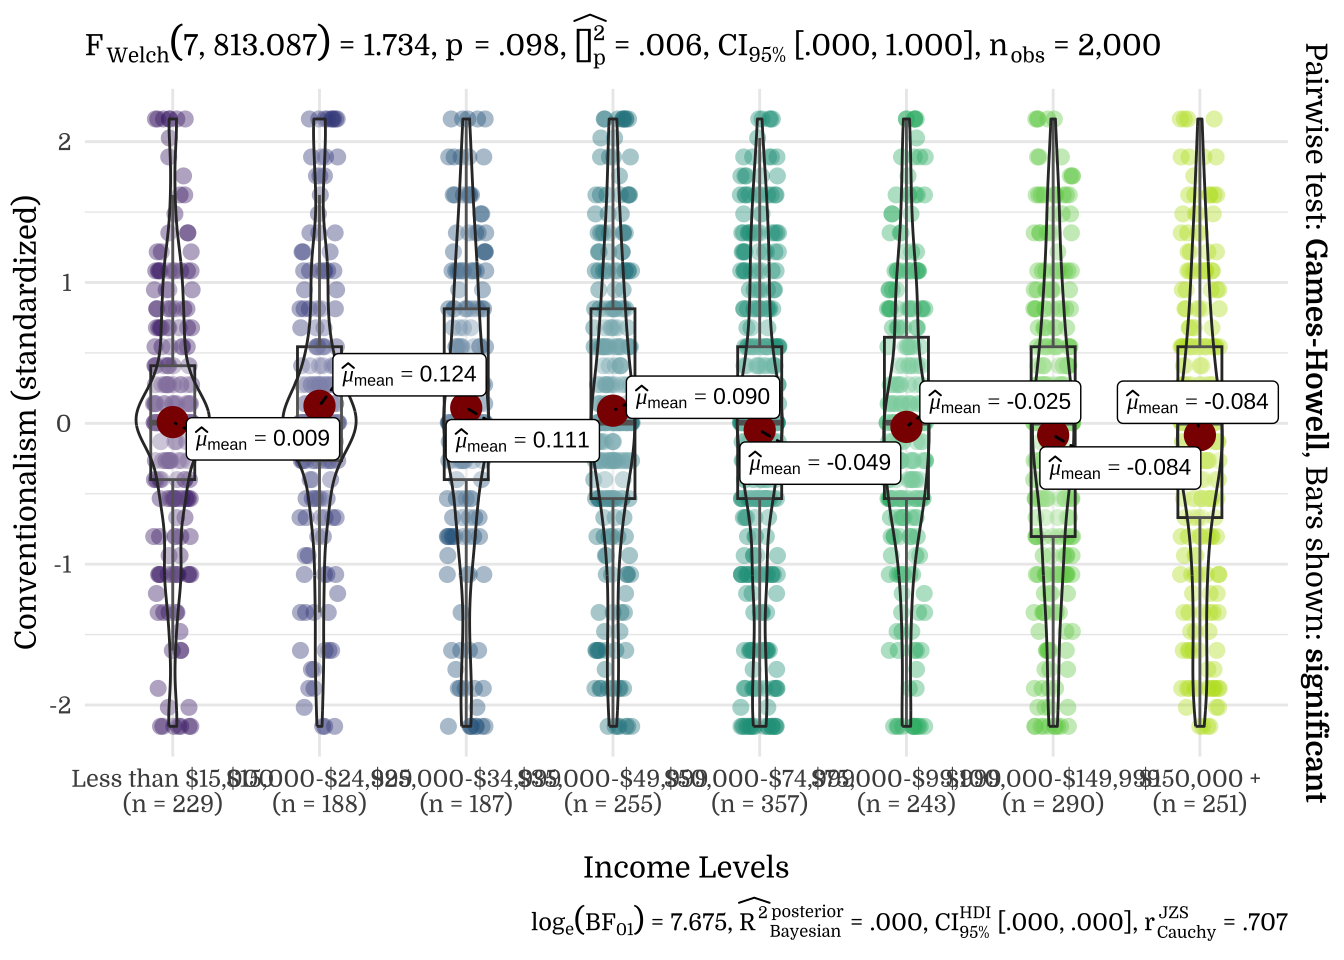
| Income Levels | N | Mean | SD |
|---|---|---|---|
| Less than $15,000 | 229 | -0.09 | 0.91 |
| $15,000-$24,999 | 188 | 0.14 | 0.87 |
| $25,000-$34,999 | 187 | 0.02 | 1.01 |
| $35,000-$49,999 | 255 | 0.08 | 1.01 |
| $50,000-$74,999 | 357 | 0.00 | 1.03 |
| $75,000-$99,999 | 243 | -0.05 | 1.06 |
| $100,000-$149,999 | 290 | 0.00 | 1.00 |
| $150,000 + | 251 | -0.08 | 1.04 |
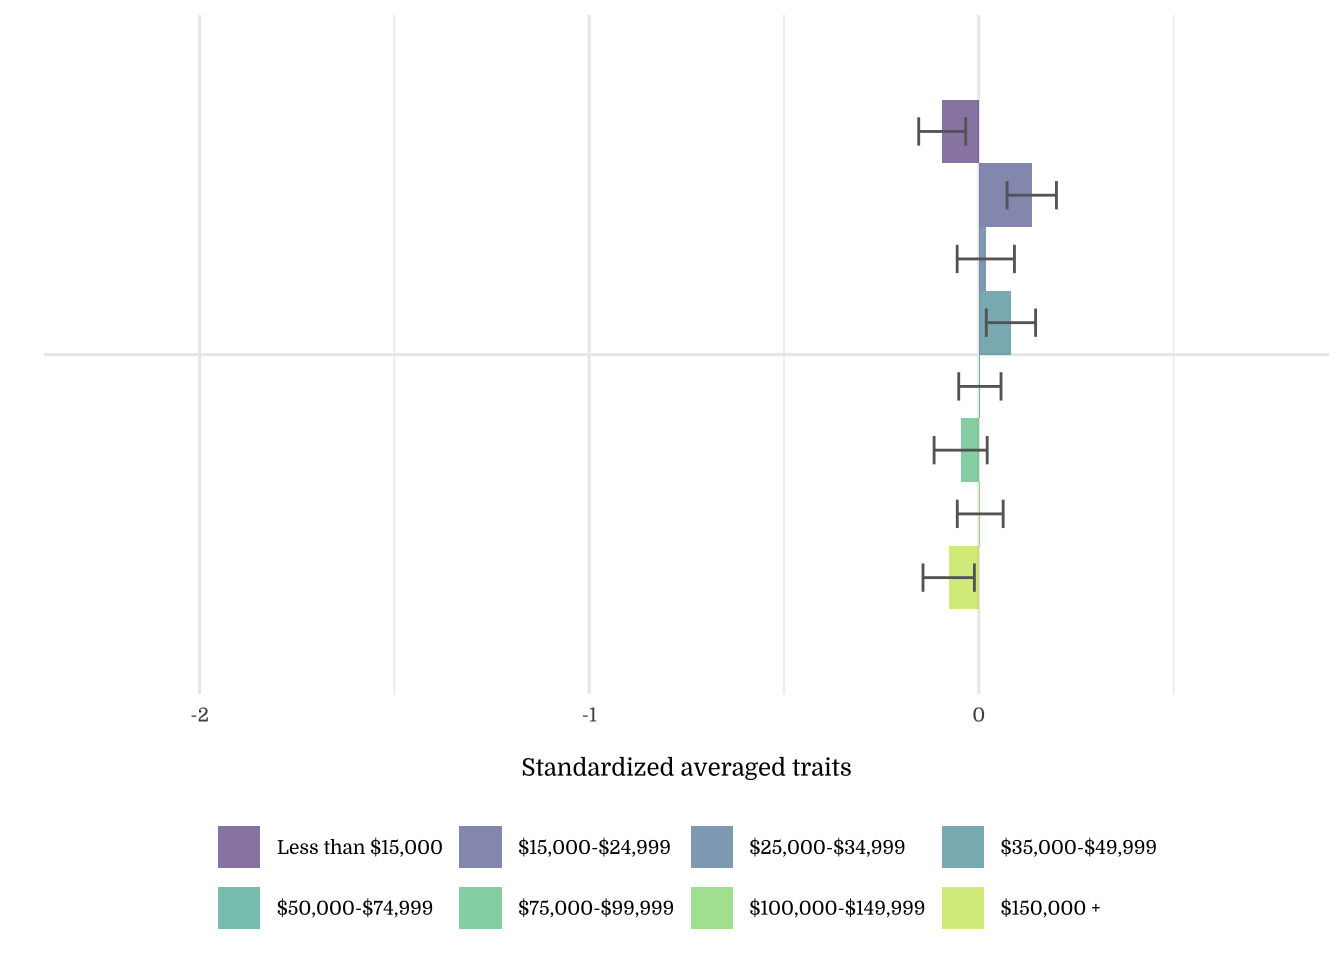
| Income Levels | N | Mean | SD |
|---|---|---|---|
| Less than $15,000 | 229 | 0.08 | 0.93 |
| $15,000-$24,999 | 188 | 0.12 | 0.90 |
| $25,000-$34,999 | 187 | 0.01 | 1.00 |
| $35,000-$49,999 | 255 | 0.06 | 1.03 |
| $50,000-$74,999 | 357 | -0.06 | 1.03 |
| $75,000-$99,999 | 243 | 0.04 | 1.00 |
| $100,000-$149,999 | 290 | -0.12 | 1.05 |
| $150,000 + | 251 | -0.05 | 0.99 |
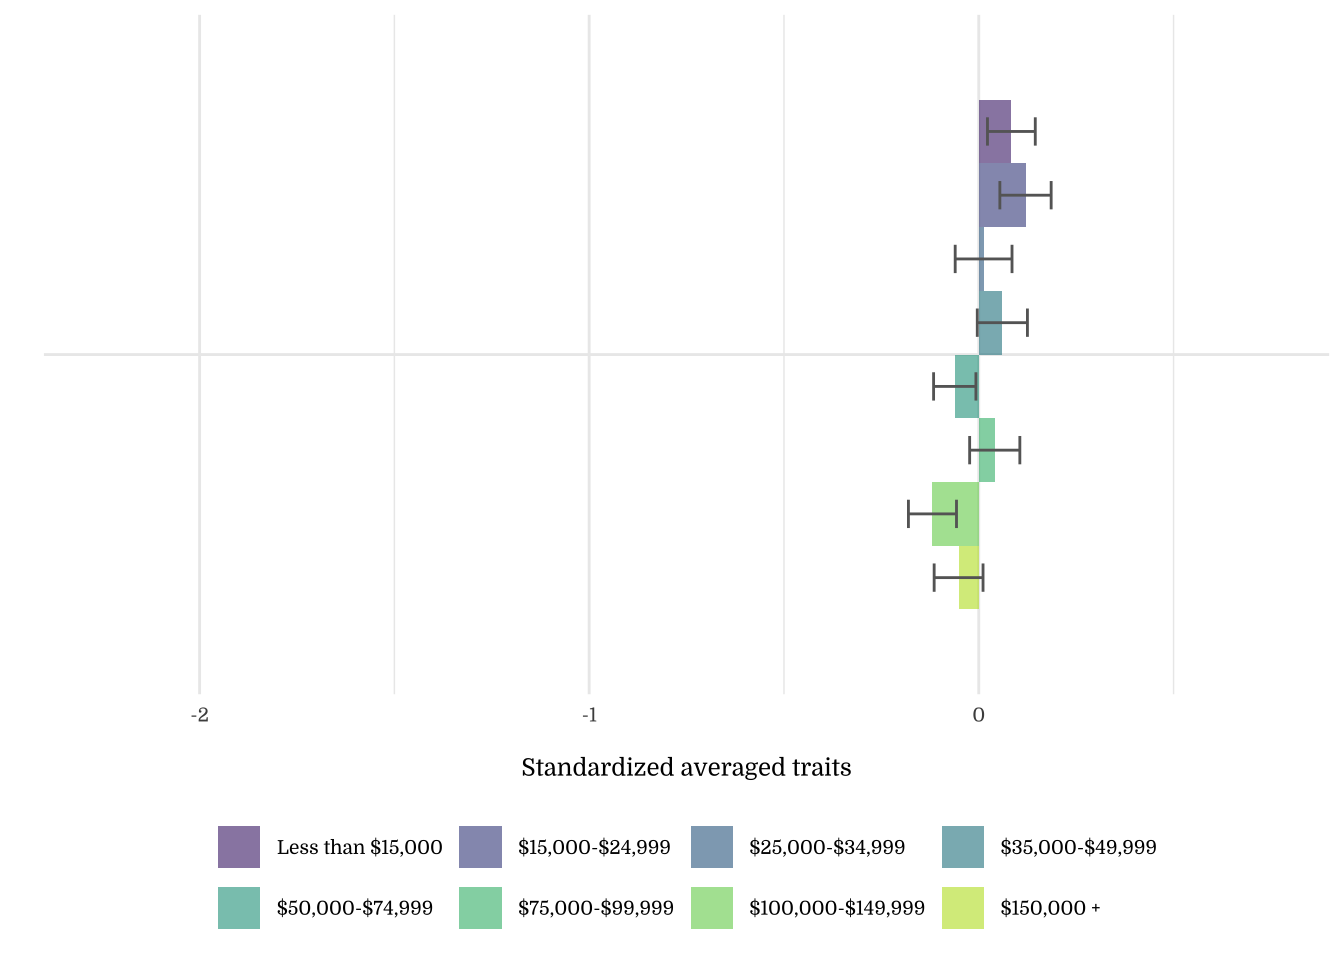
| Income Levels | N | Mean | SD |
|---|---|---|---|
| Less than $15,000 | 229 | 0.01 | 0.89 |
| $15,000-$24,999 | 188 | 0.12 | 0.93 |
| $25,000-$34,999 | 187 | 0.11 | 1.03 |
| $35,000-$49,999 | 255 | 0.09 | 1.03 |
| $50,000-$74,999 | 357 | -0.05 | 1.06 |
| $75,000-$99,999 | 243 | -0.03 | 0.99 |
| $100,000-$149,999 | 290 | -0.08 | 1.01 |
| $150,000 + | 251 | -0.08 | 0.99 |
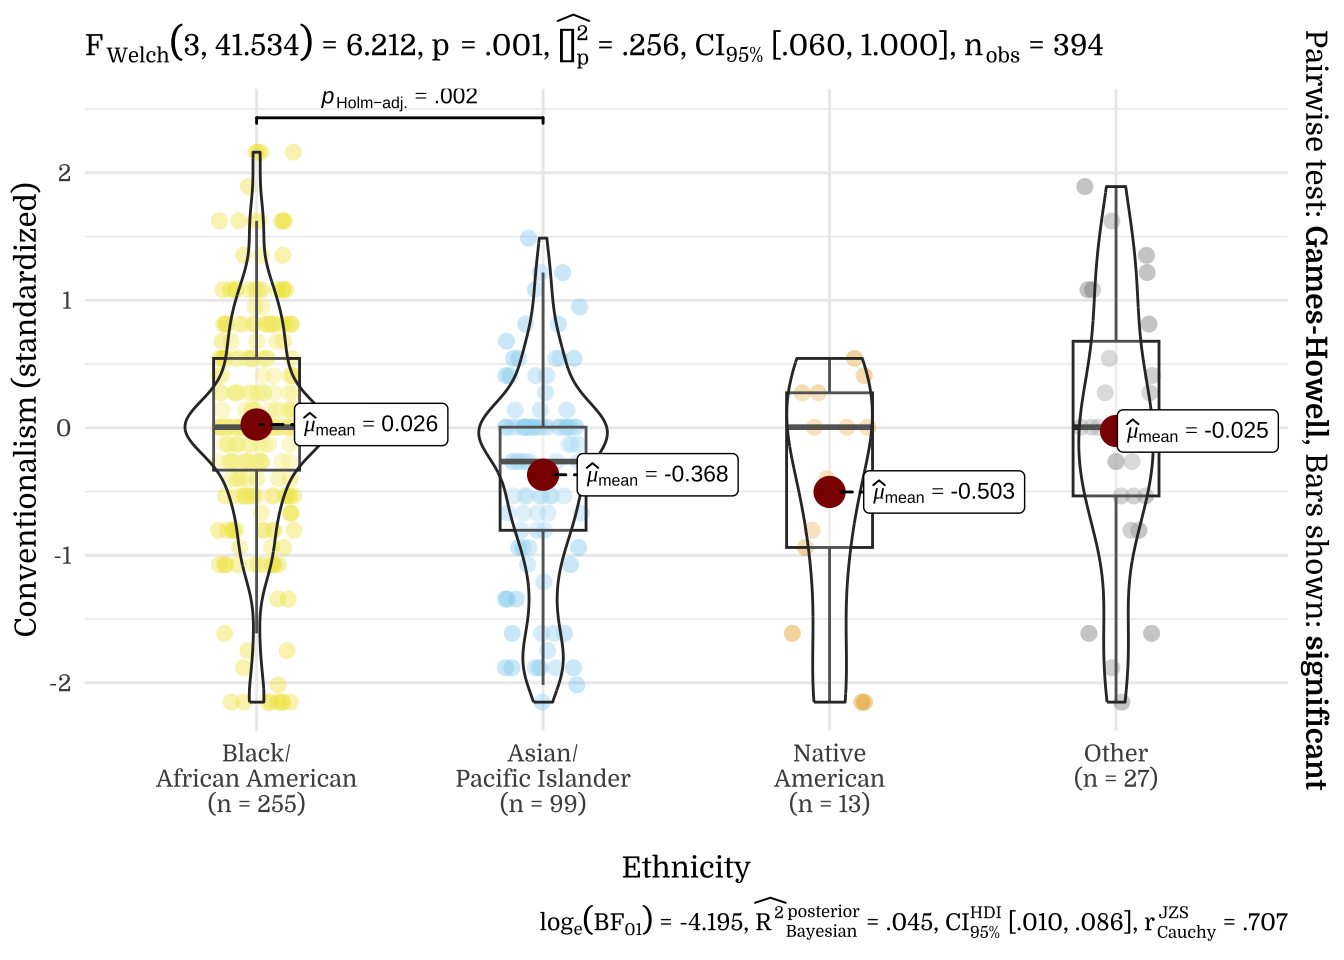
3.6 Ethnicity
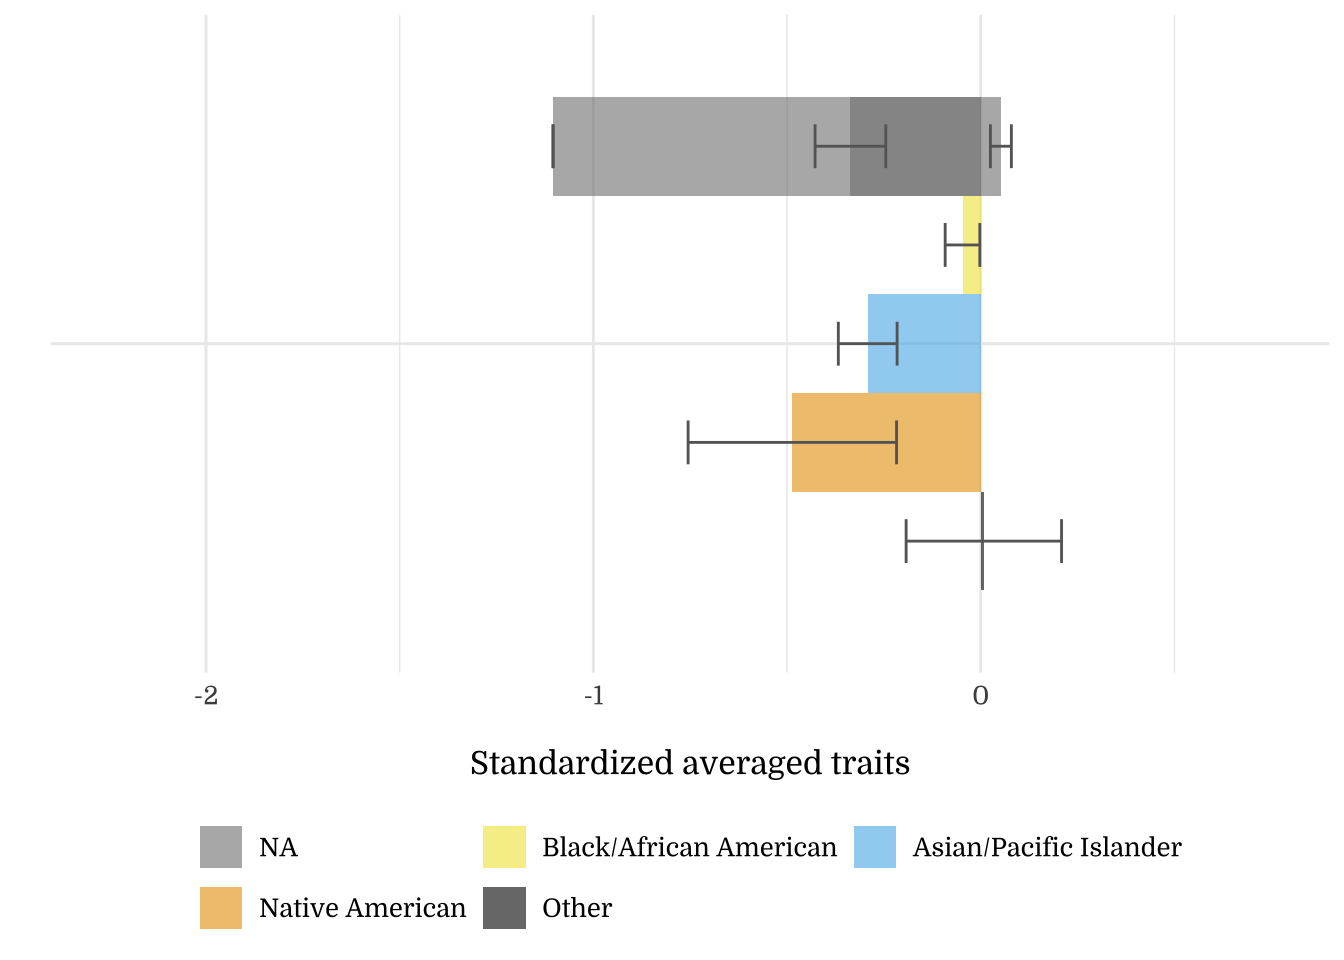
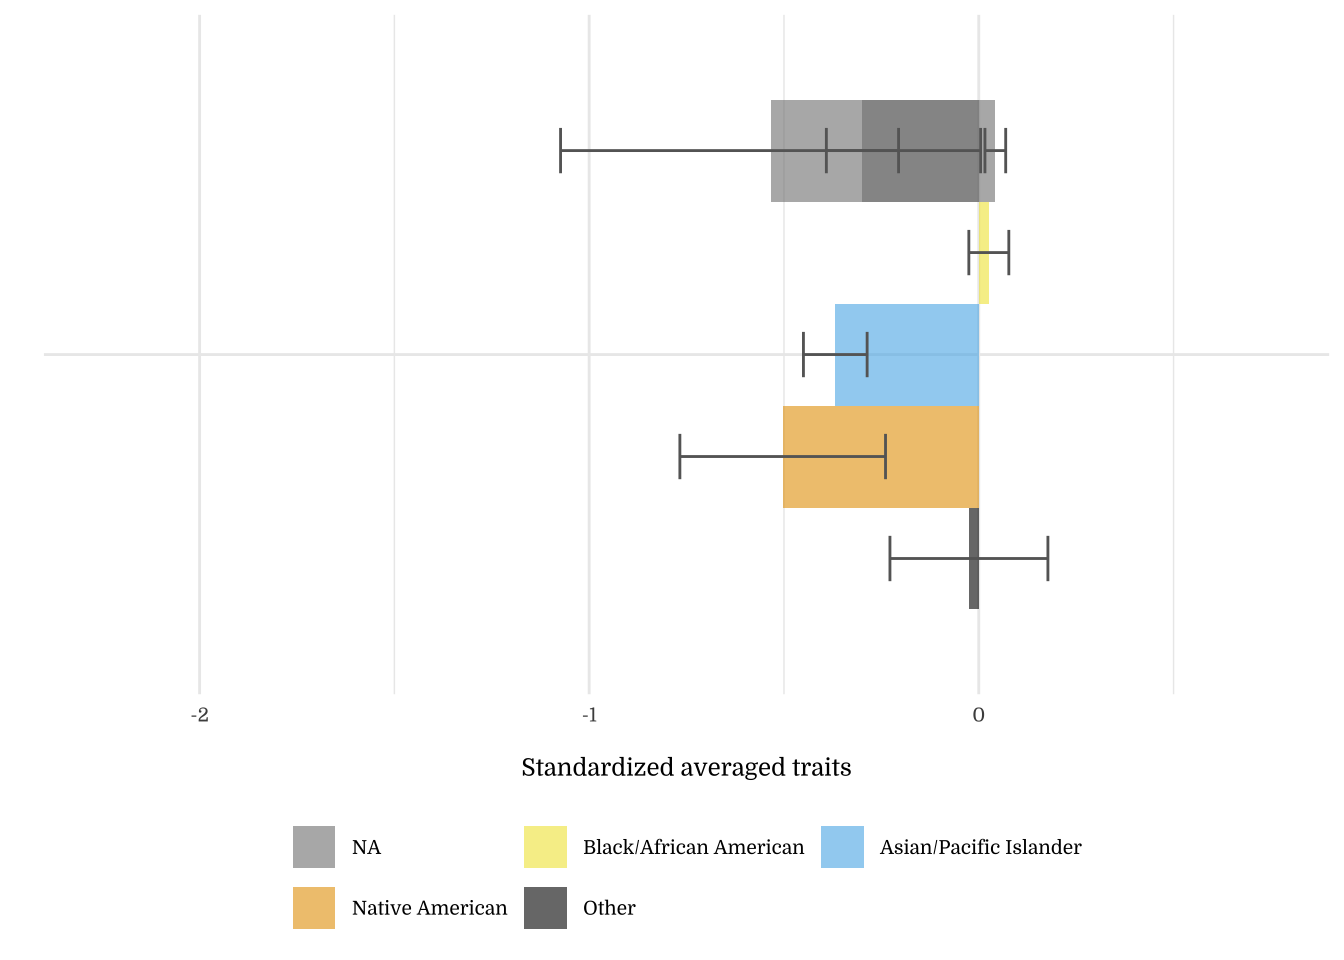
Note on the Okabe-Ito color palette. The Okabe-Ito color palette (seen above) is a set of colorblind-friendly categorical colors available in R. We are using this palette for graphs with non-ordered variables (e.g., groups, categories) for accessibility.
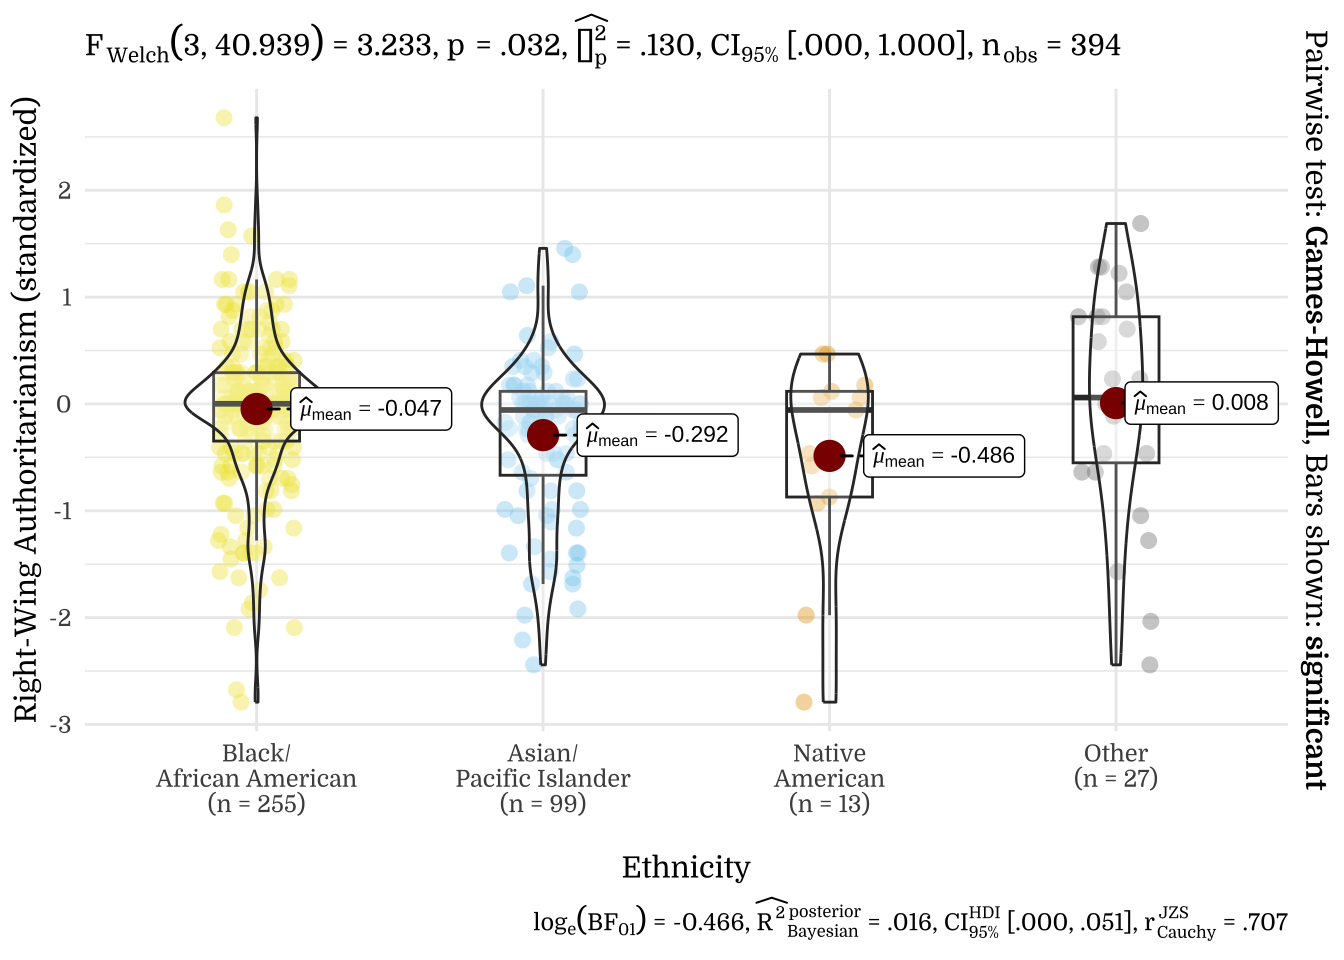
| Ethnicity | N | Mean | SD |
|---|---|---|---|
| Black/African American | 255 | -0.17 | 0.75 |
| Asian/Pacific Islander | 99 | -0.22 | 0.77 |
| Native American | 13 | -0.35 | 0.92 |
| Other | 27 | 0.10 | 1.01 |
| NA | 1516 | 0.06 | 1.05 |
| NA | 88 | -0.26 | 0.80 |
| NA | 2 | -0.79 | 0.45 |
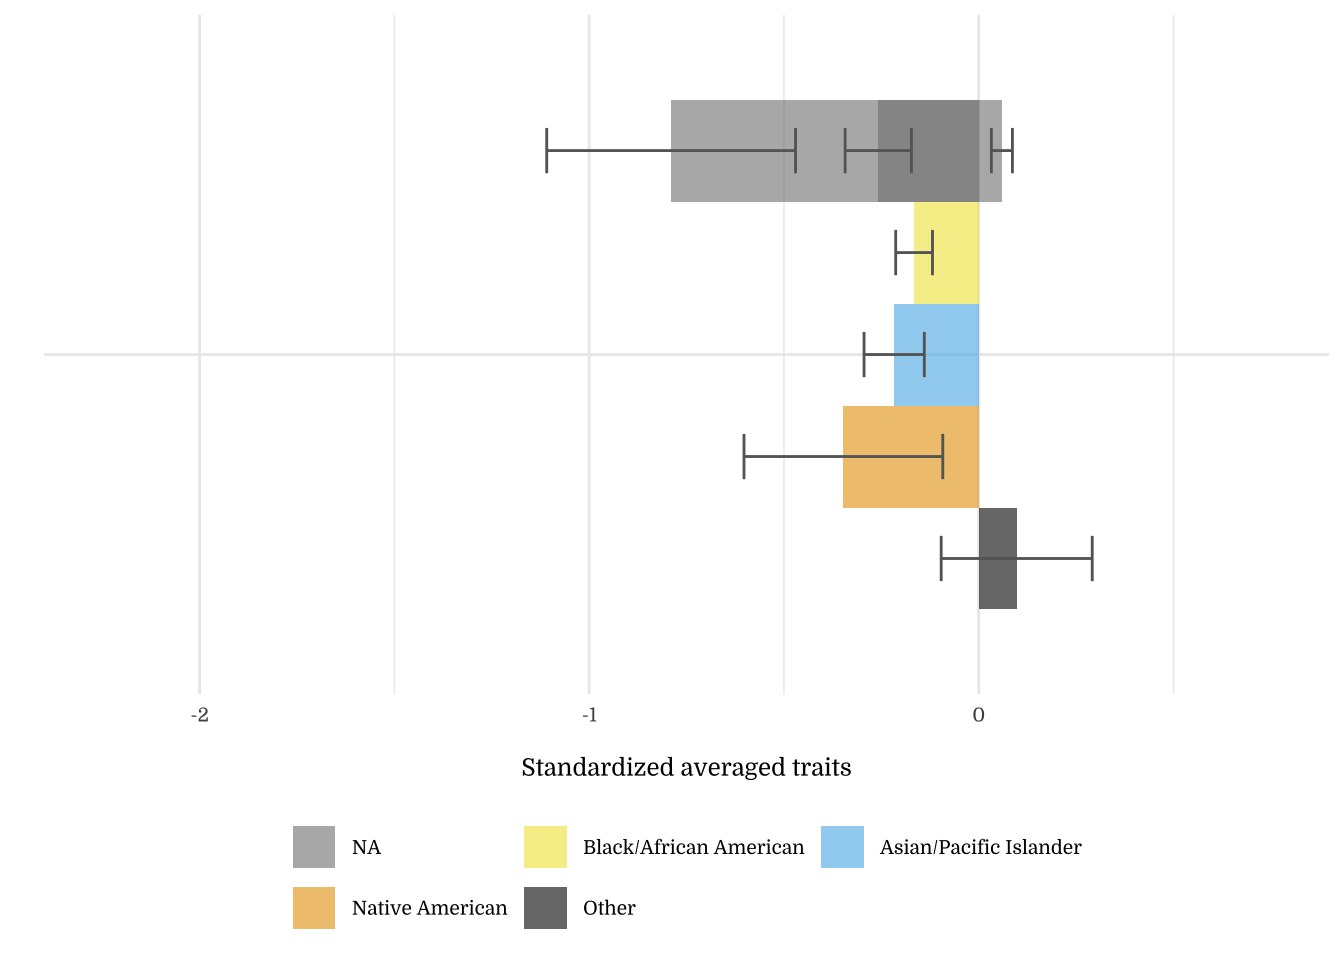
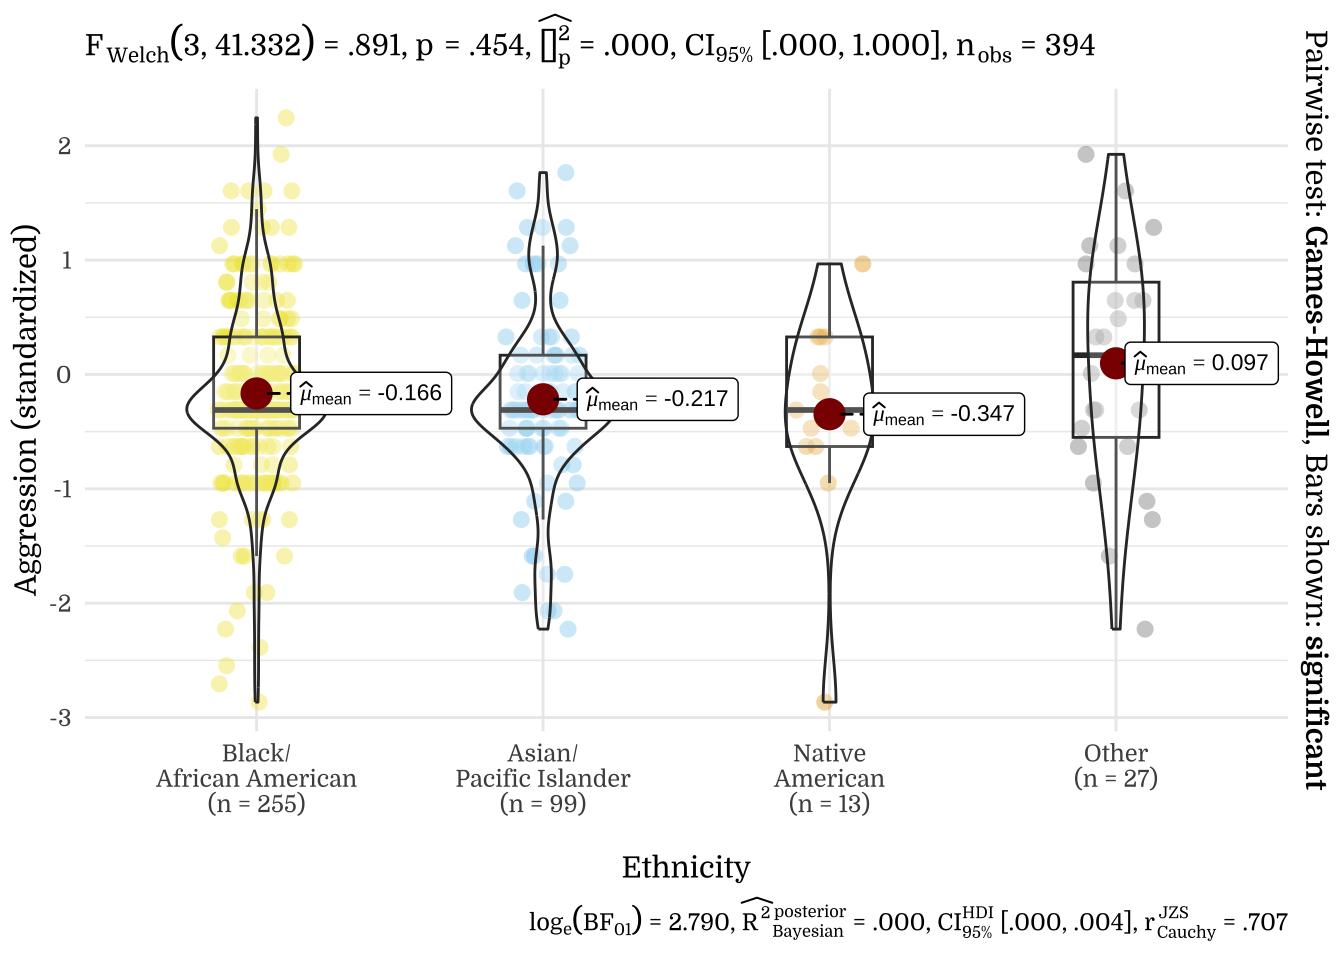
| Ethnicity | N | Mean | SD |
|---|---|---|---|
| Black/African American | 255 | 0.01 | 0.88 |
| Asian/Pacific Islander | 99 | -0.15 | 0.81 |
| Native American | 13 | -0.40 | 0.93 |
| Other | 27 | -0.05 | 1.00 |
| NA | 1516 | 0.03 | 1.03 |
| NA | 88 | -0.32 | 1.02 |
| NA | 2 | -1.66 | 0.47 |
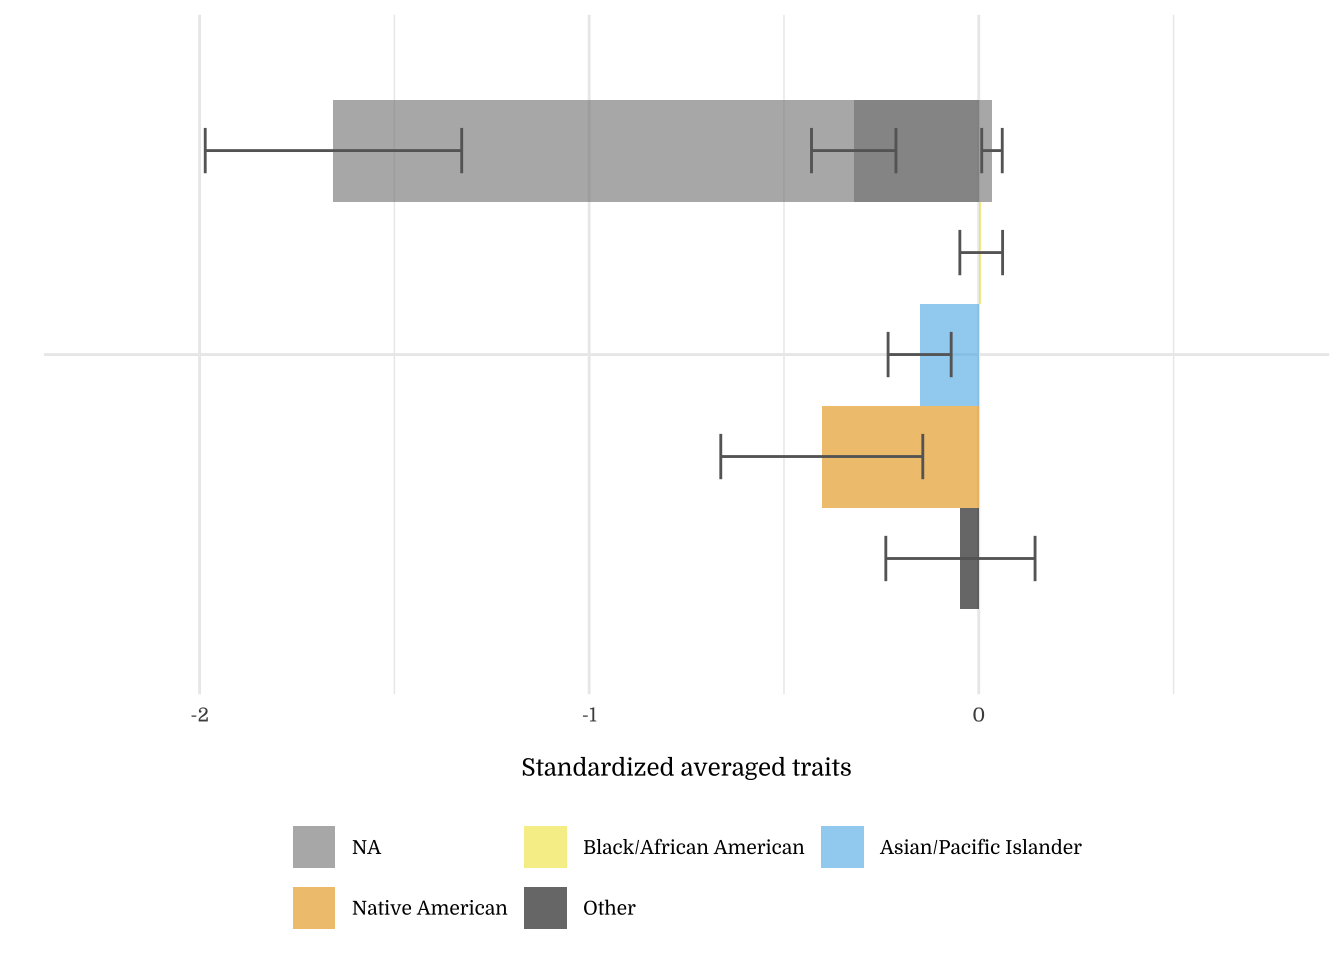
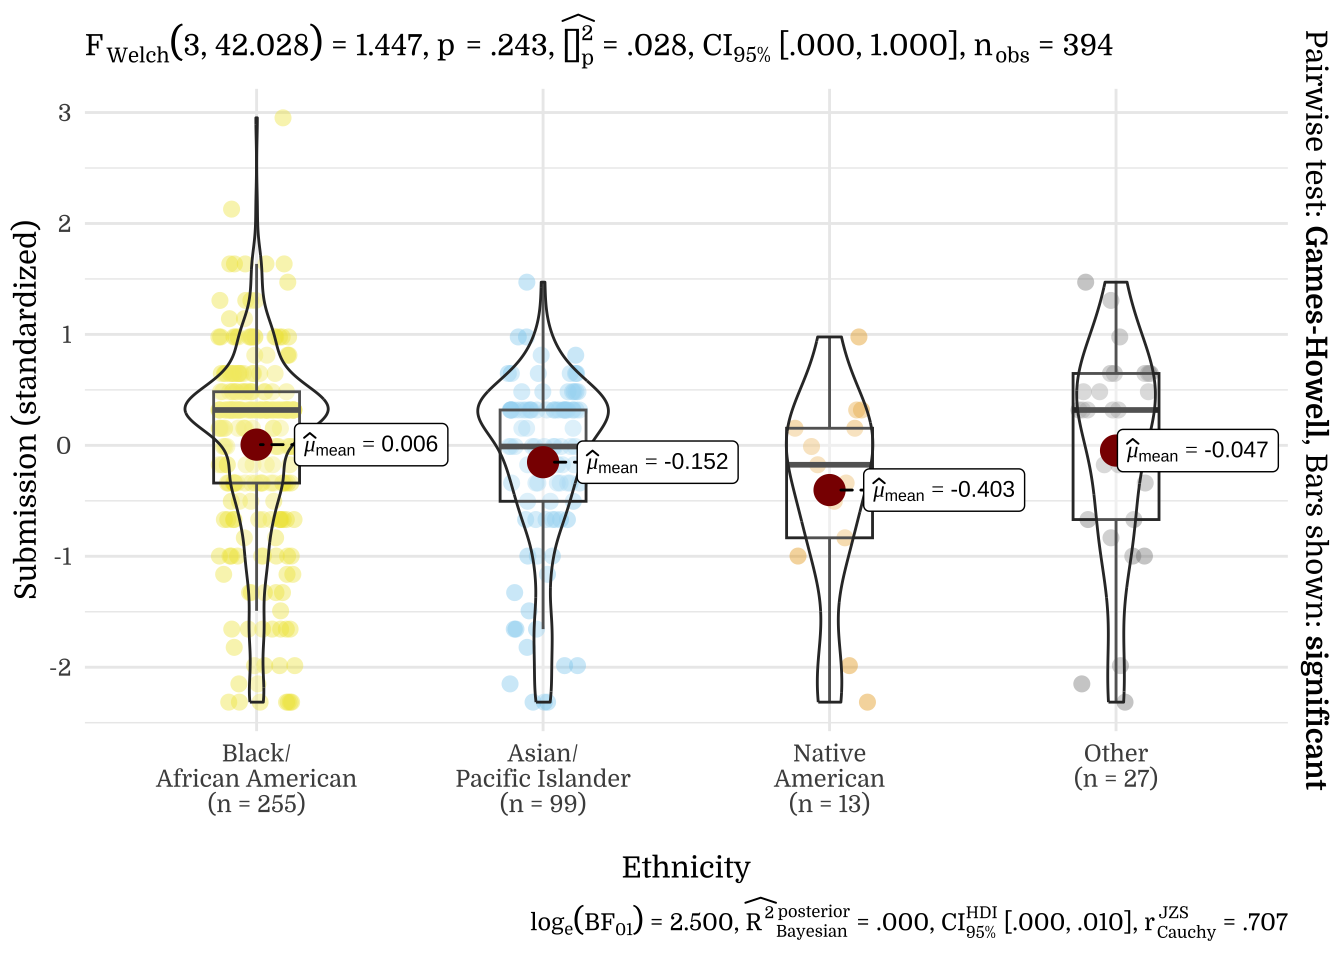
| Ethnicity | N | Mean | SD |
|---|---|---|---|
| Black/African American | 255 | 0.03 | 0.82 |
| Asian/Pacific Islander | 99 | -0.37 | 0.81 |
| Native American | 13 | -0.50 | 0.95 |
| Other | 27 | -0.03 | 1.05 |
| NA | 1516 | 0.04 | 1.04 |
| NA | 88 | -0.30 | 0.87 |
| NA | 2 | -0.53 | 0.76 |
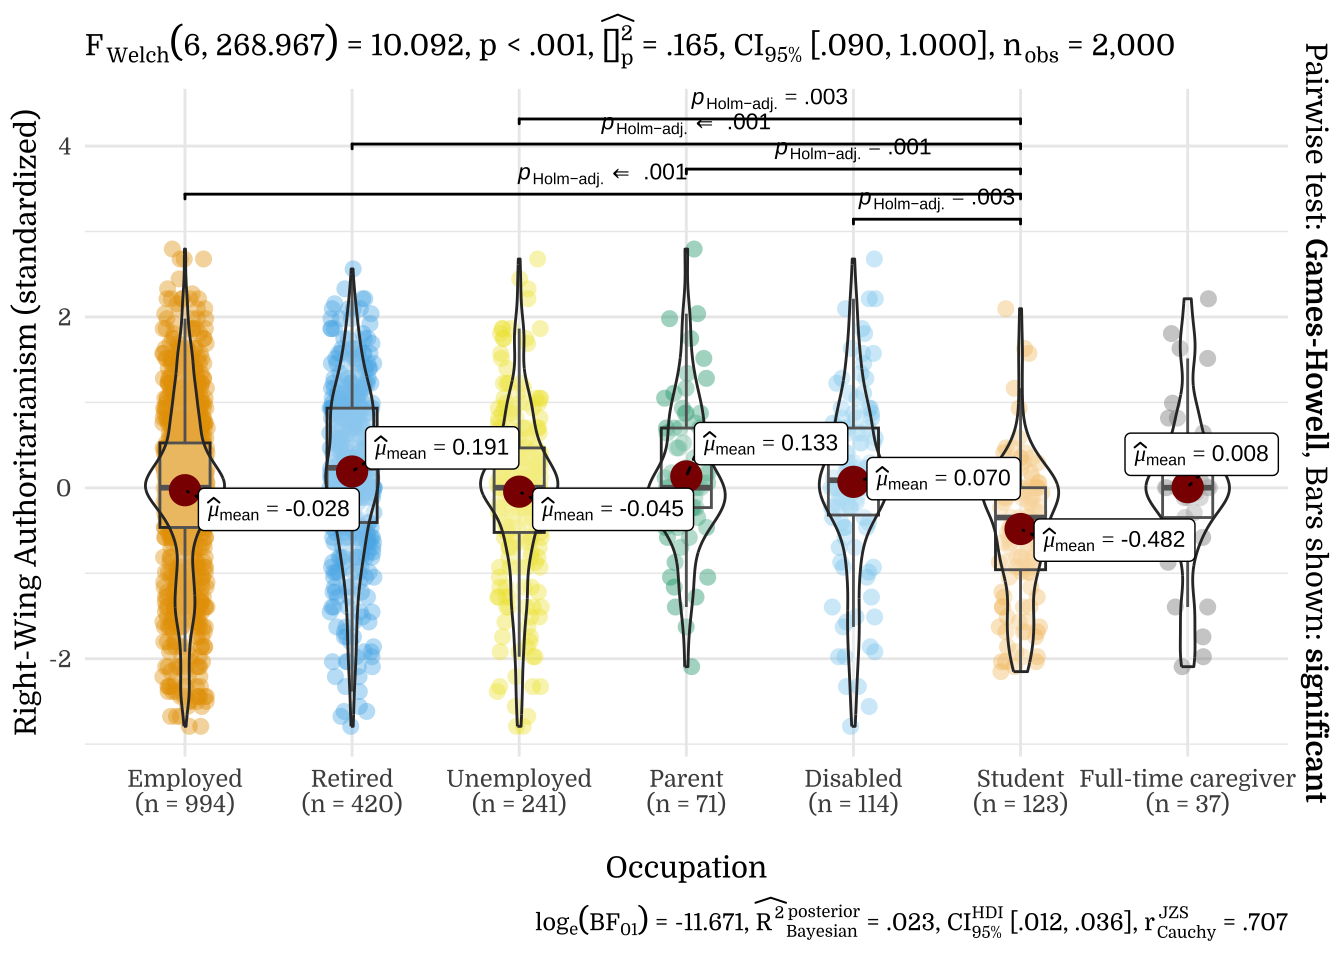
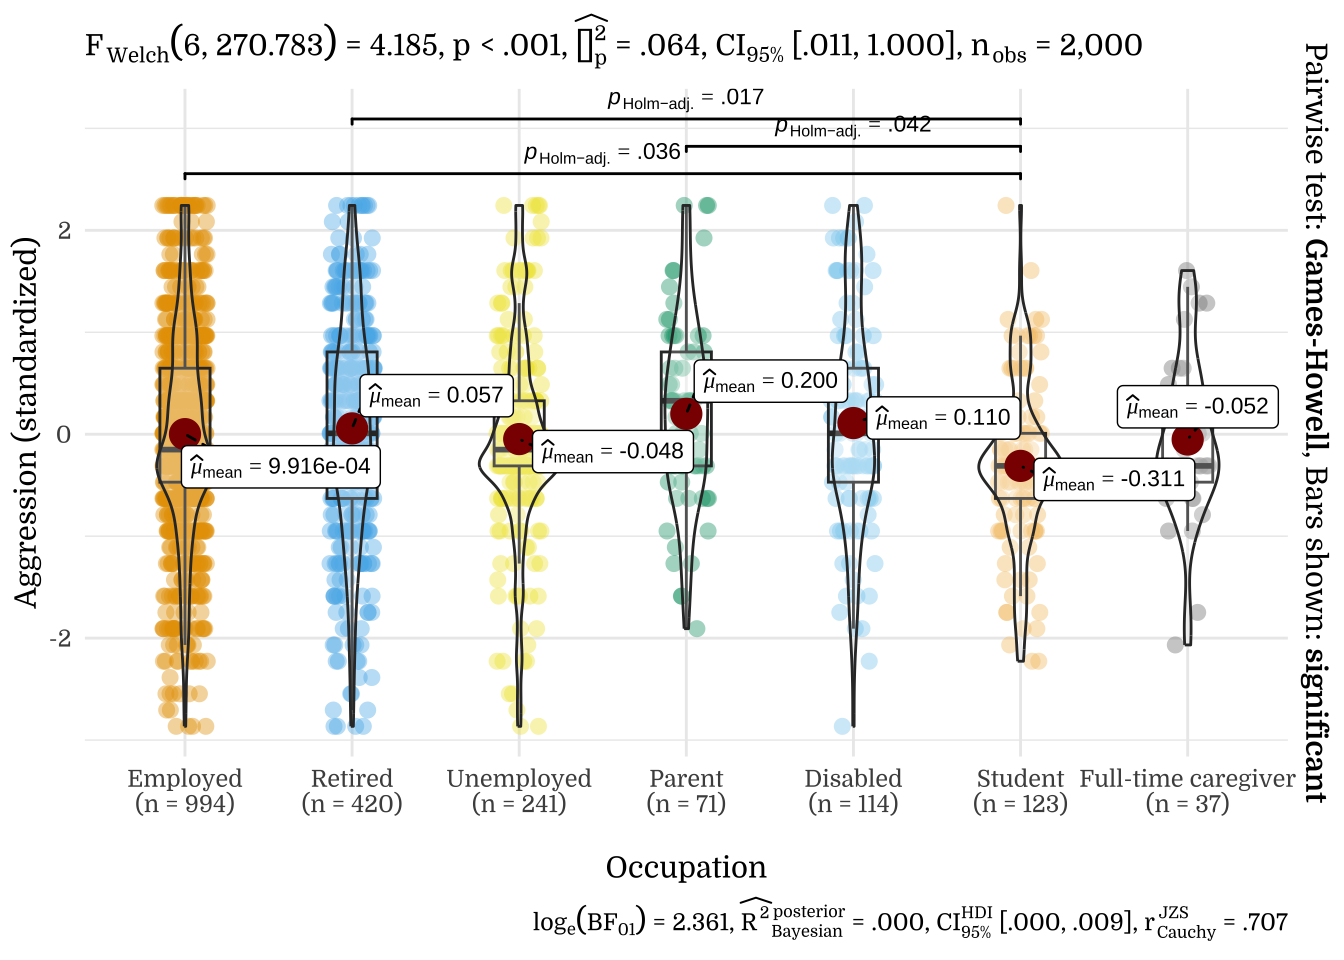
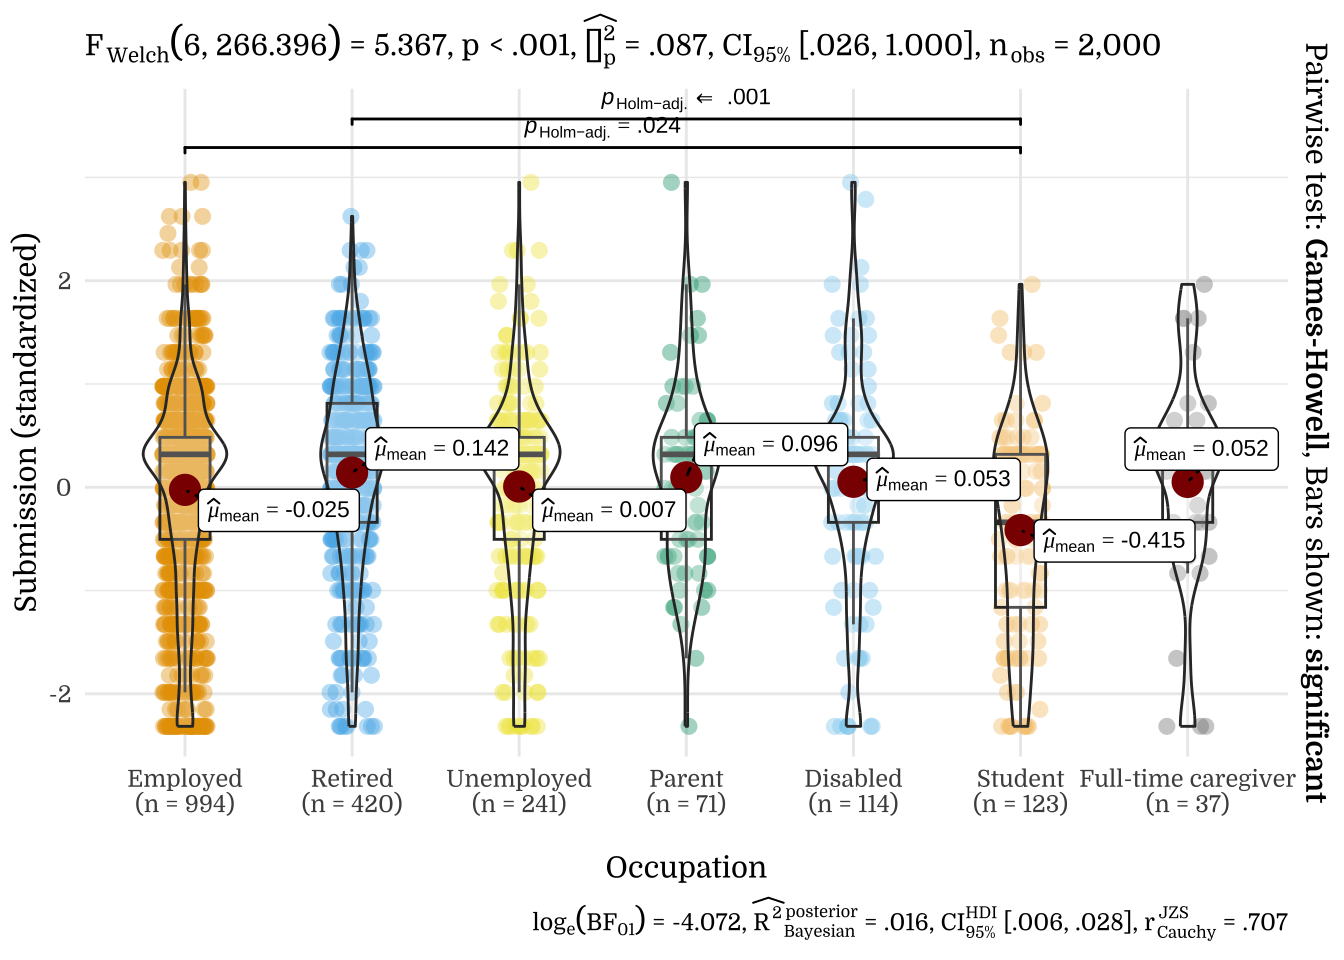
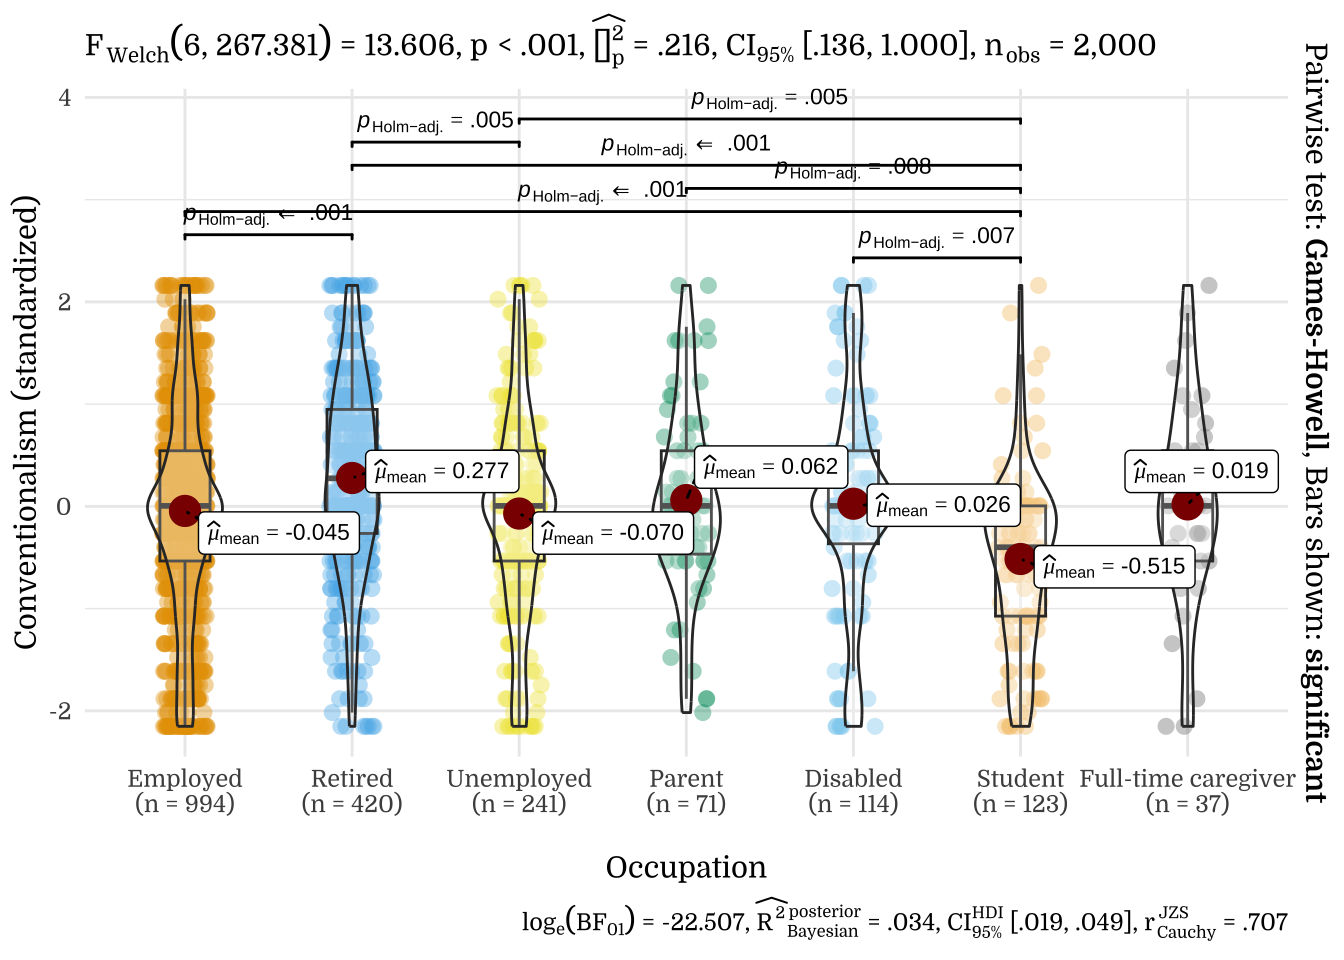
3.7 Occupation
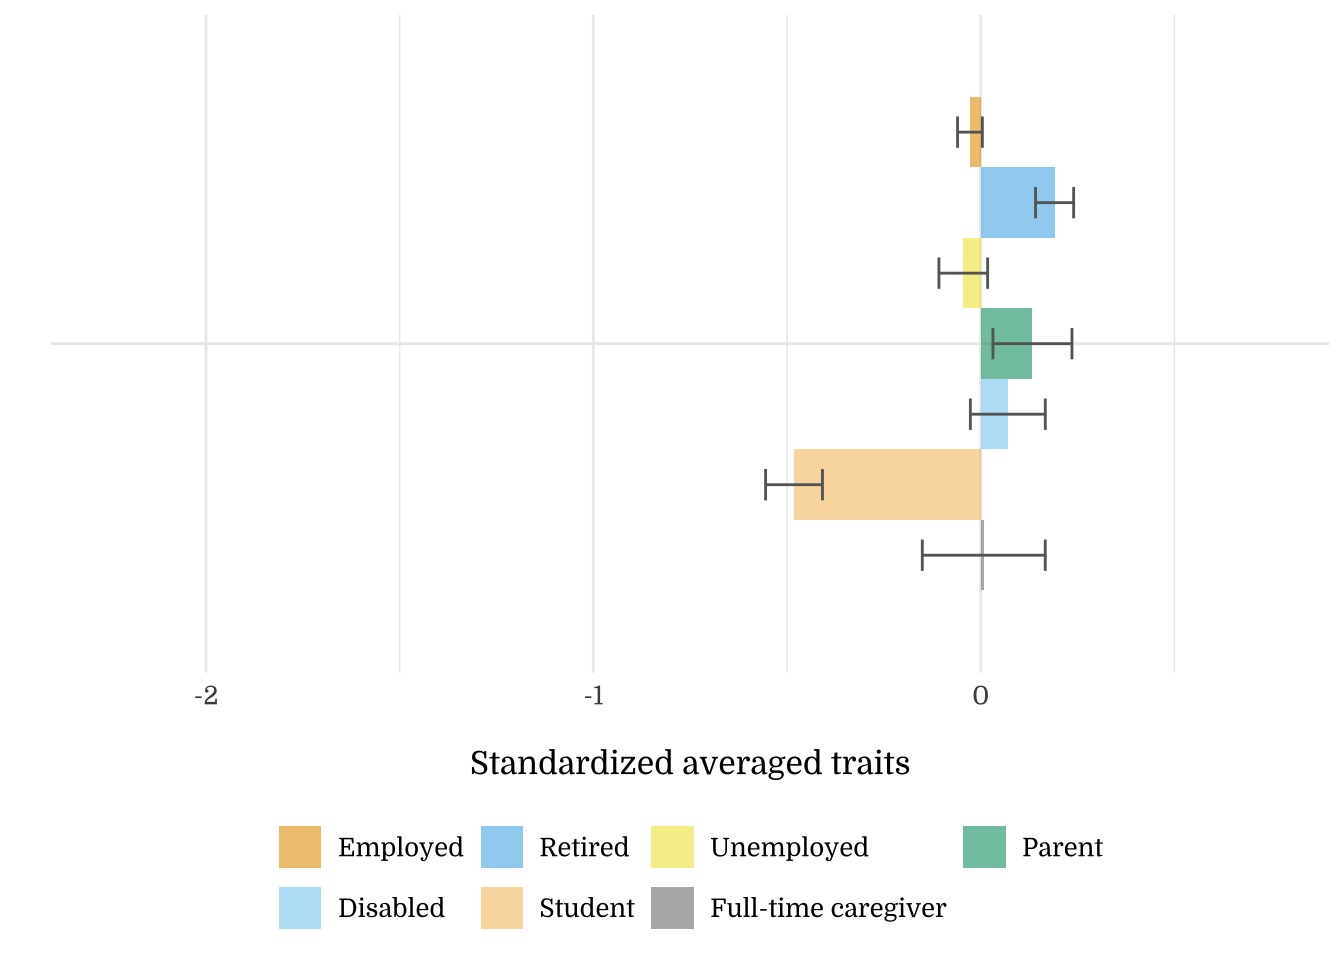
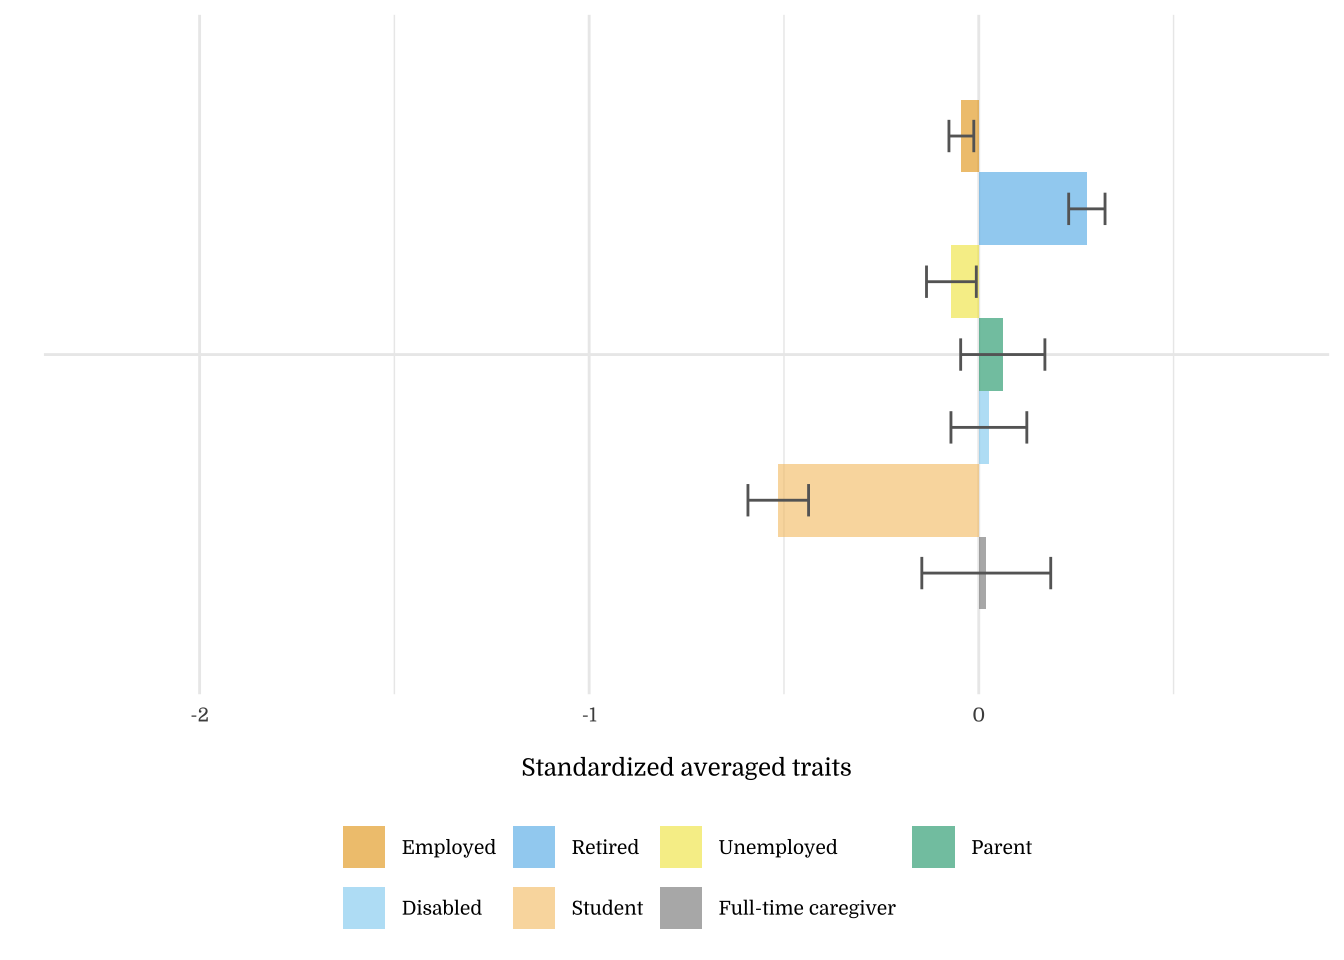
| Occupation | N | Mean | SD |
|---|---|---|---|
| Employed | 994 | 0.00 | 1.00 |
| Retired | 420 | 0.06 | 1.07 |
| Unemployed | 241 | -0.05 | 0.96 |
| Parent | 71 | 0.20 | 0.90 |
| Disabled | 114 | 0.11 | 1.04 |
| Student | 123 | -0.31 | 0.79 |
| Full-time caregiver | 37 | -0.05 | 0.80 |
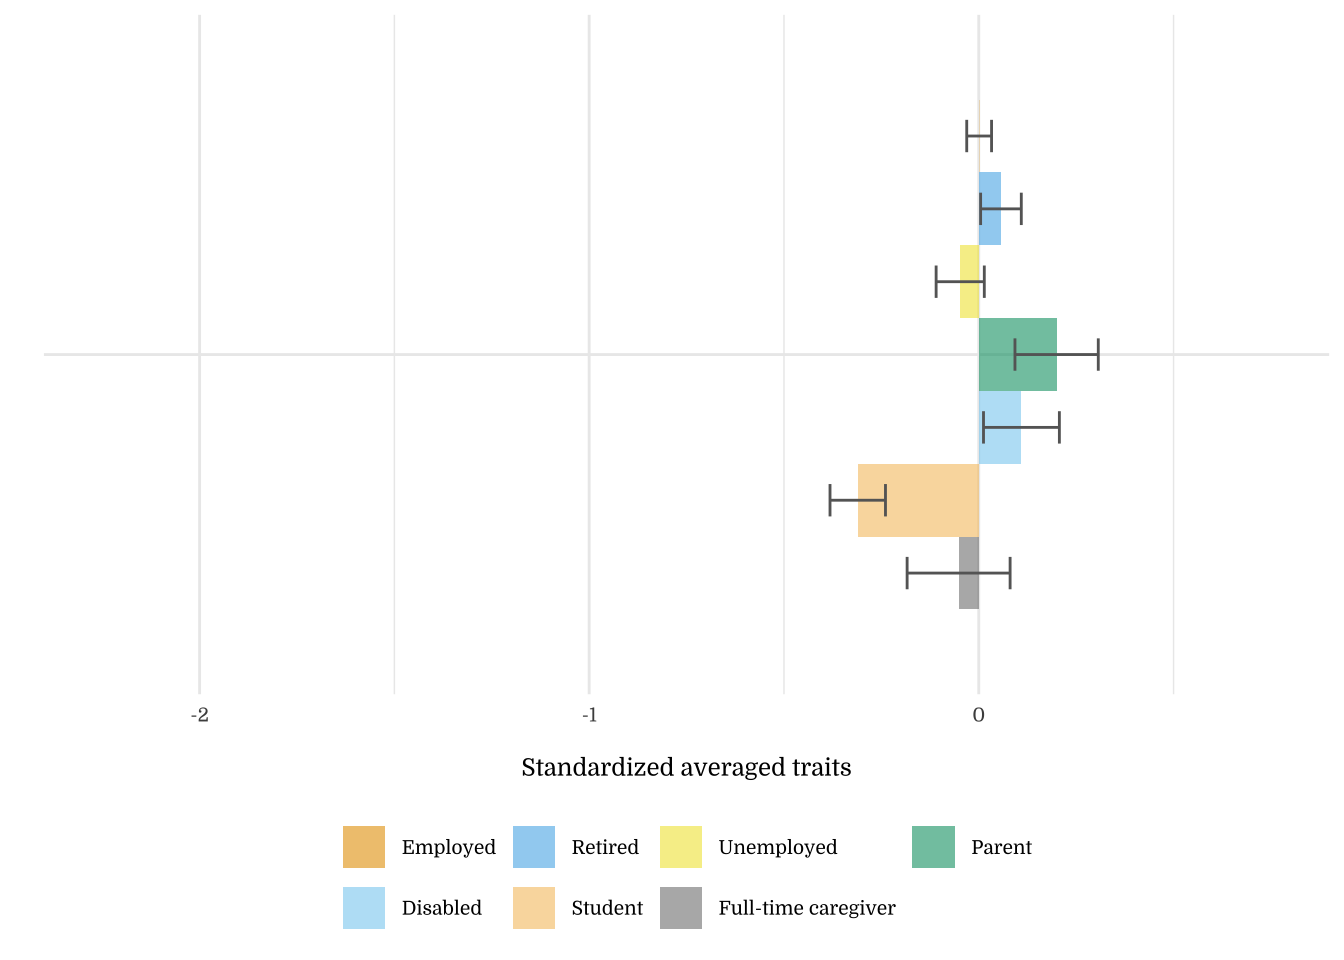
| Occupation | N | Mean | SD |
|---|---|---|---|
| Employed | 994 | -0.03 | 1.01 |
| Retired | 420 | 0.14 | 0.96 |
| Unemployed | 241 | 0.01 | 0.99 |
| Parent | 71 | 0.10 | 0.90 |
| Disabled | 114 | 0.05 | 1.07 |
| Student | 123 | -0.41 | 0.99 |
| Full-time caregiver | 37 | 0.05 | 1.04 |
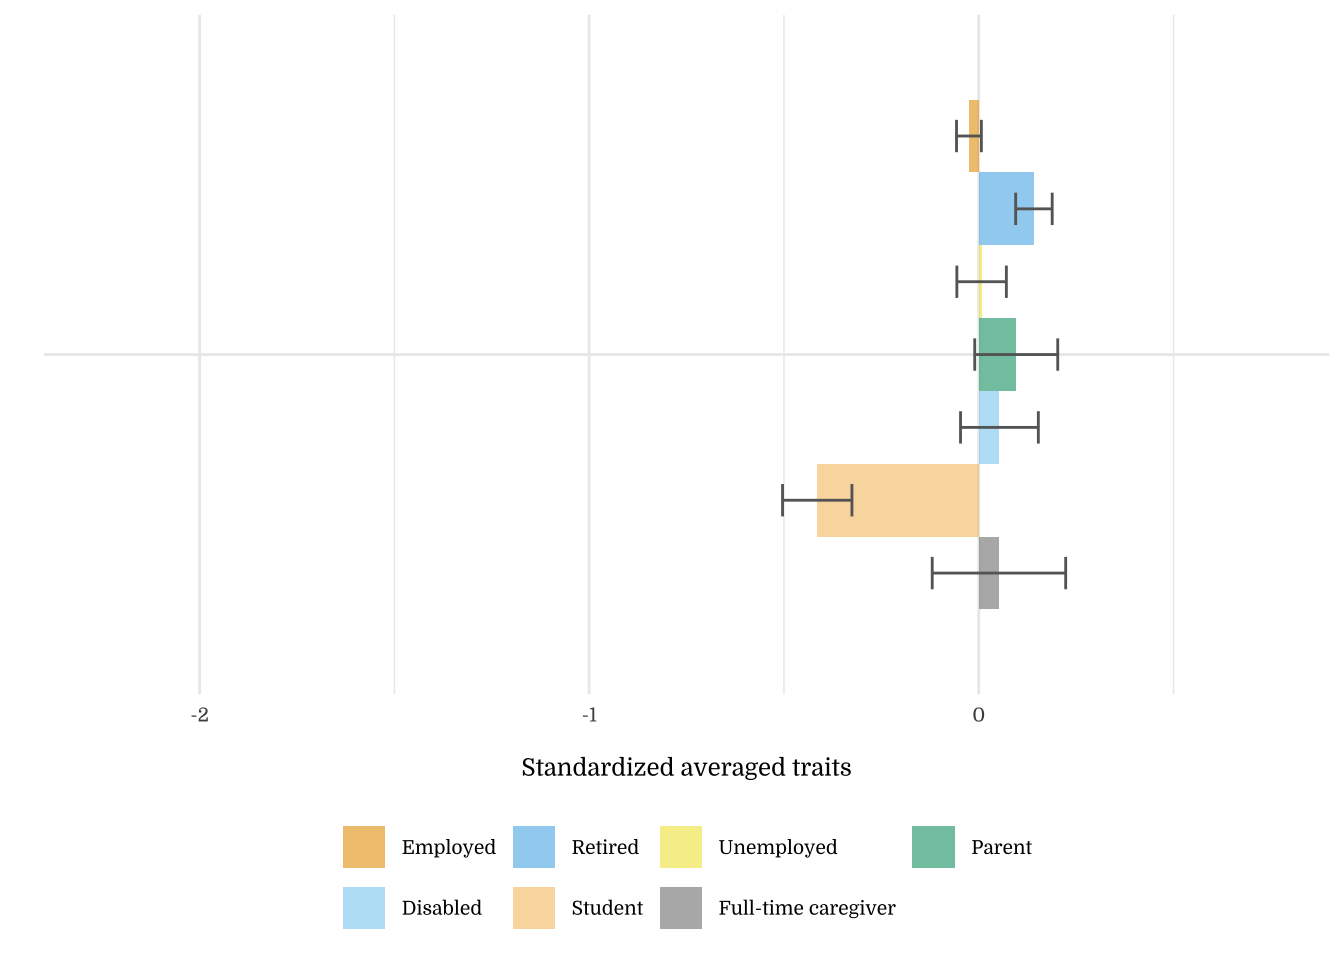
| Occupation | N | Mean | SD |
|---|---|---|---|
| Employed | 994 | -0.04 | 1.01 |
| Retired | 420 | 0.28 | 0.96 |
| Unemployed | 241 | -0.07 | 0.99 |
| Parent | 71 | 0.06 | 0.91 |
| Disabled | 114 | 0.03 | 1.04 |
| Student | 123 | -0.51 | 0.86 |
| Full-time caregiver | 37 | 0.02 | 1.01 |
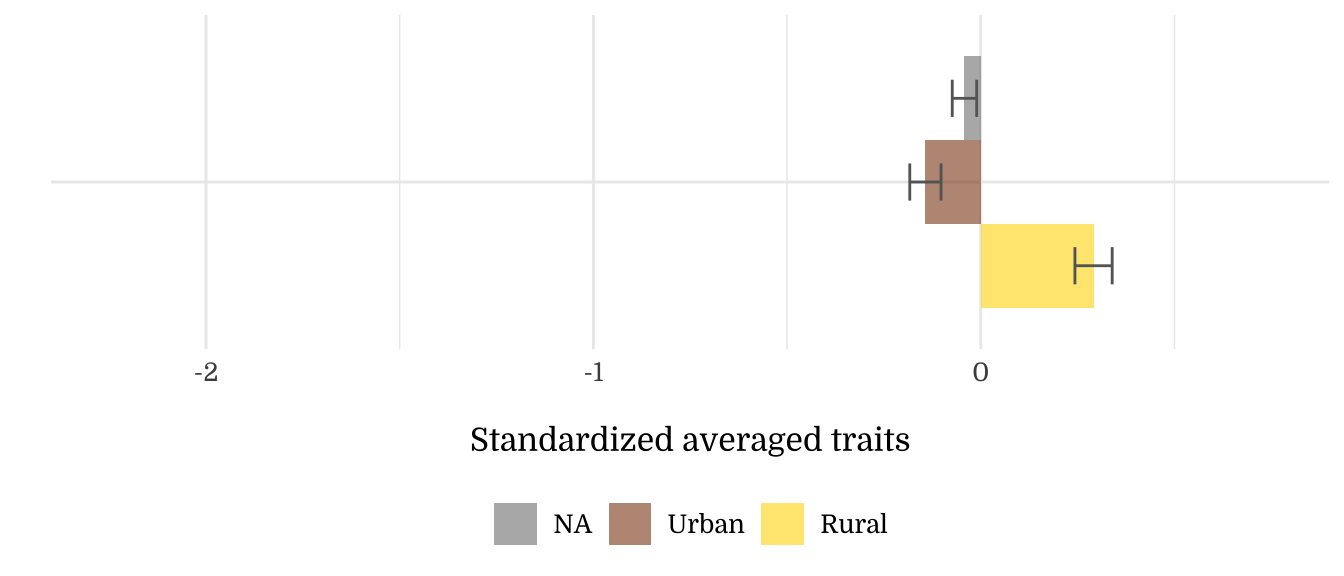
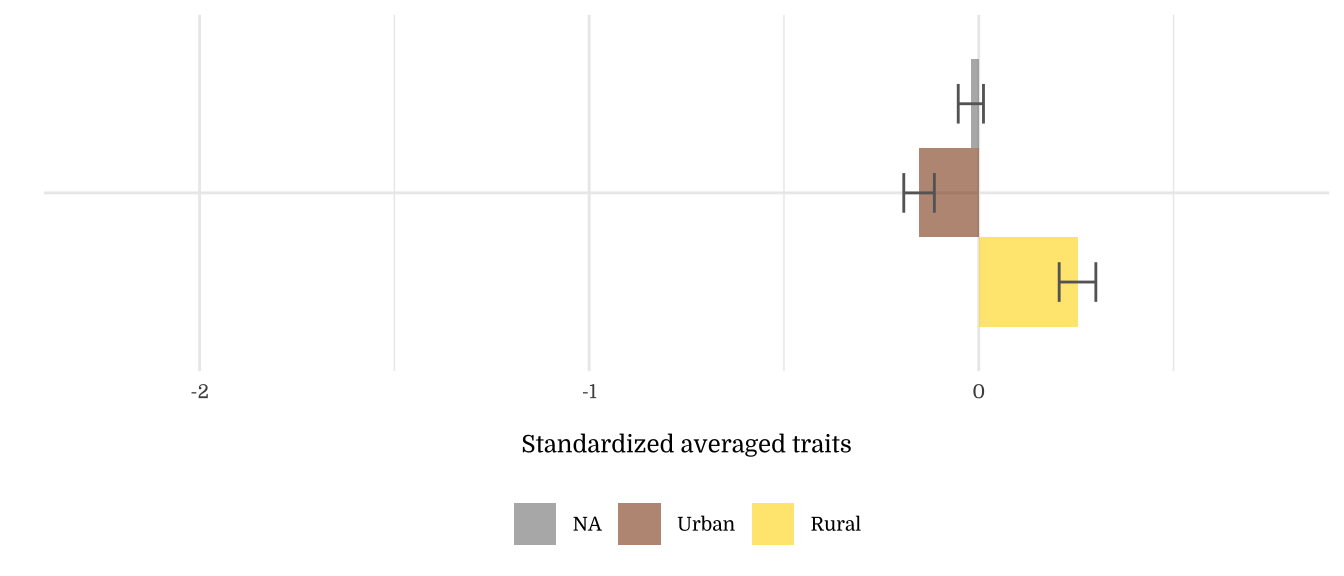
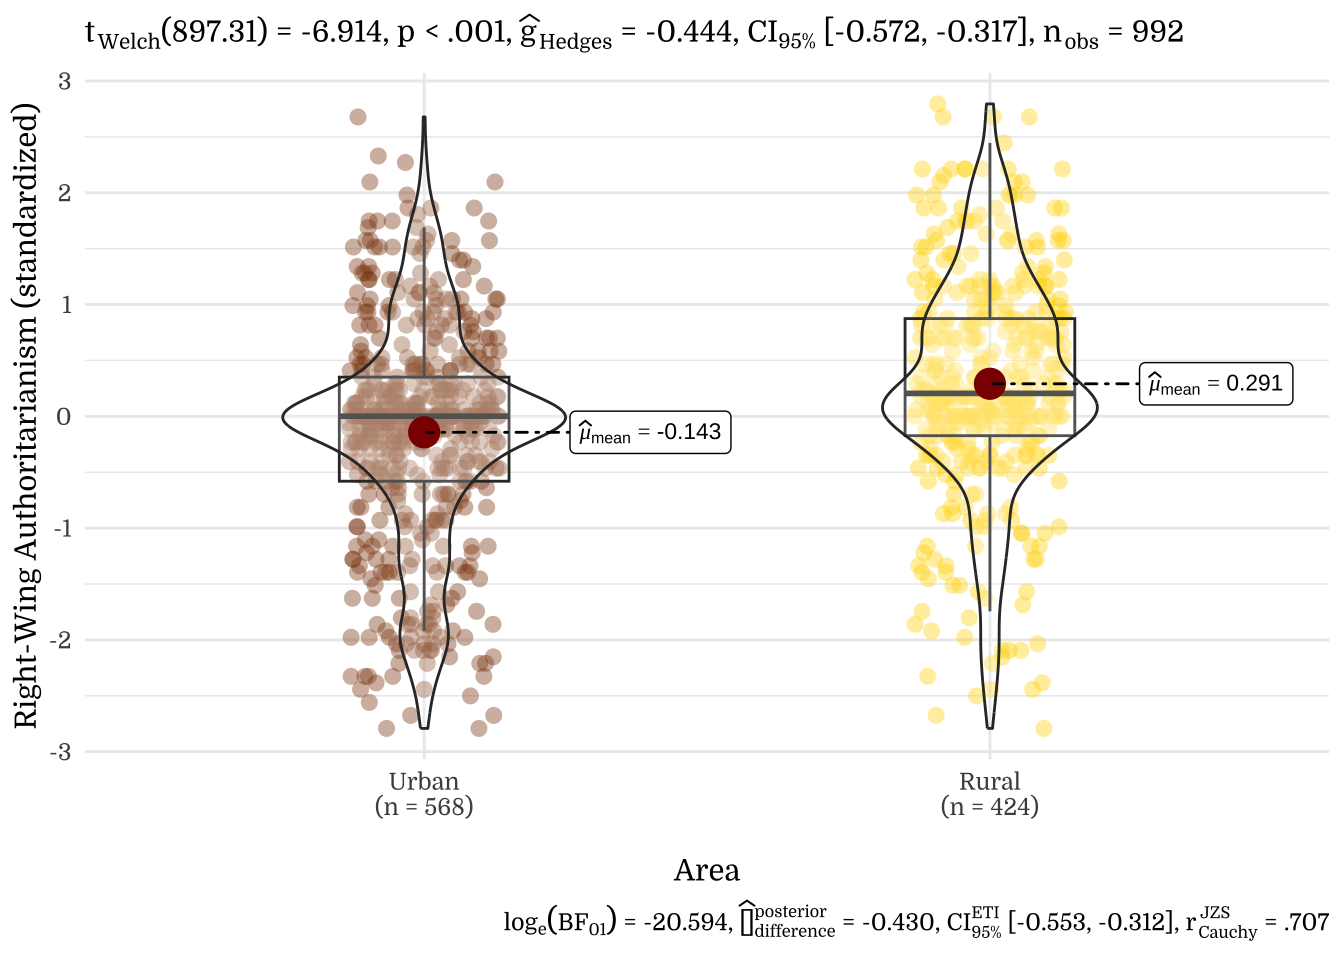
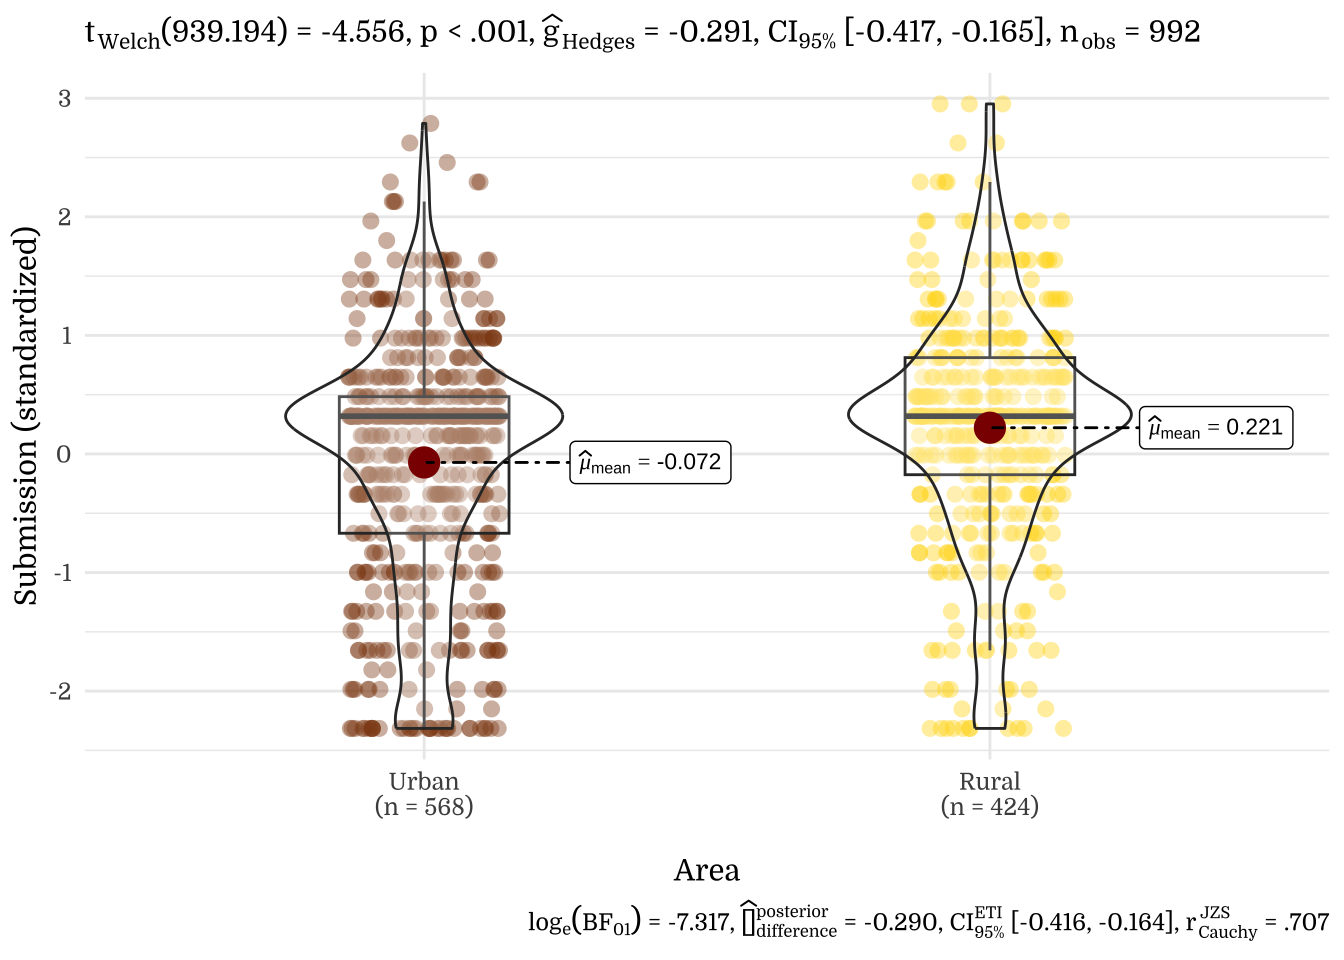
3.8 Area
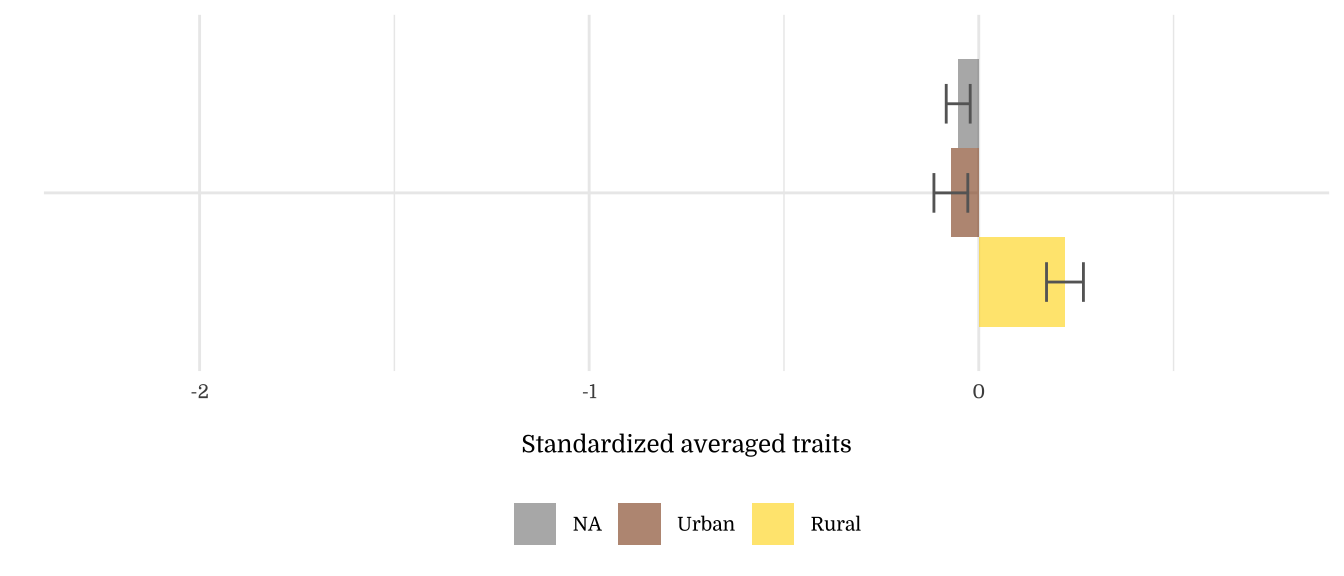
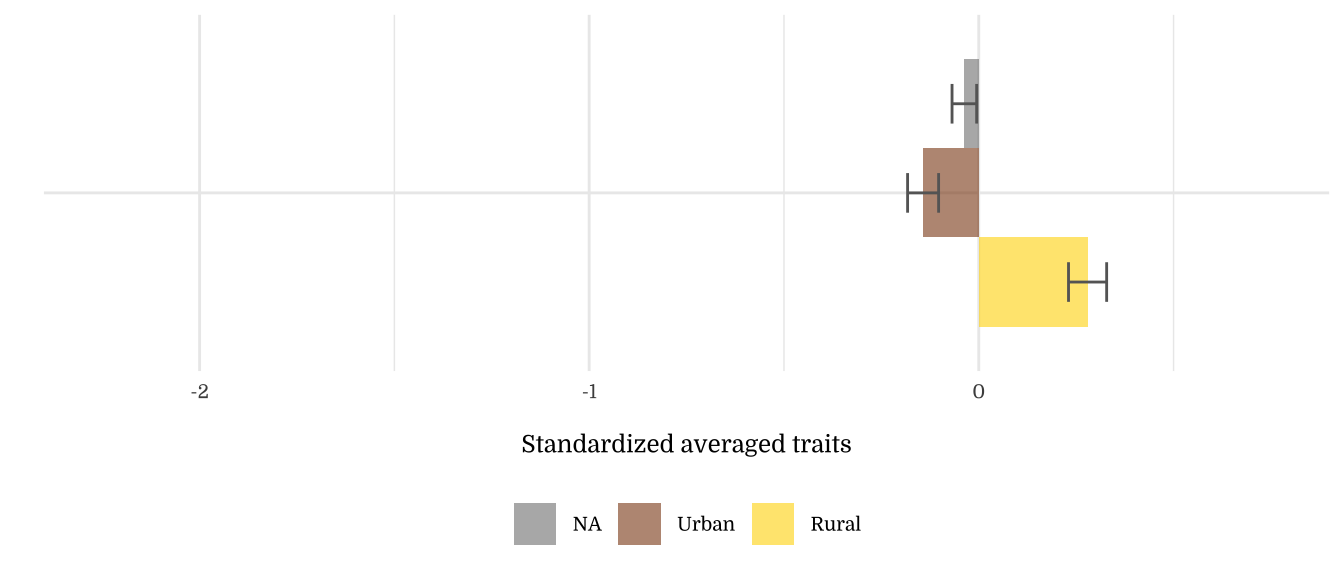
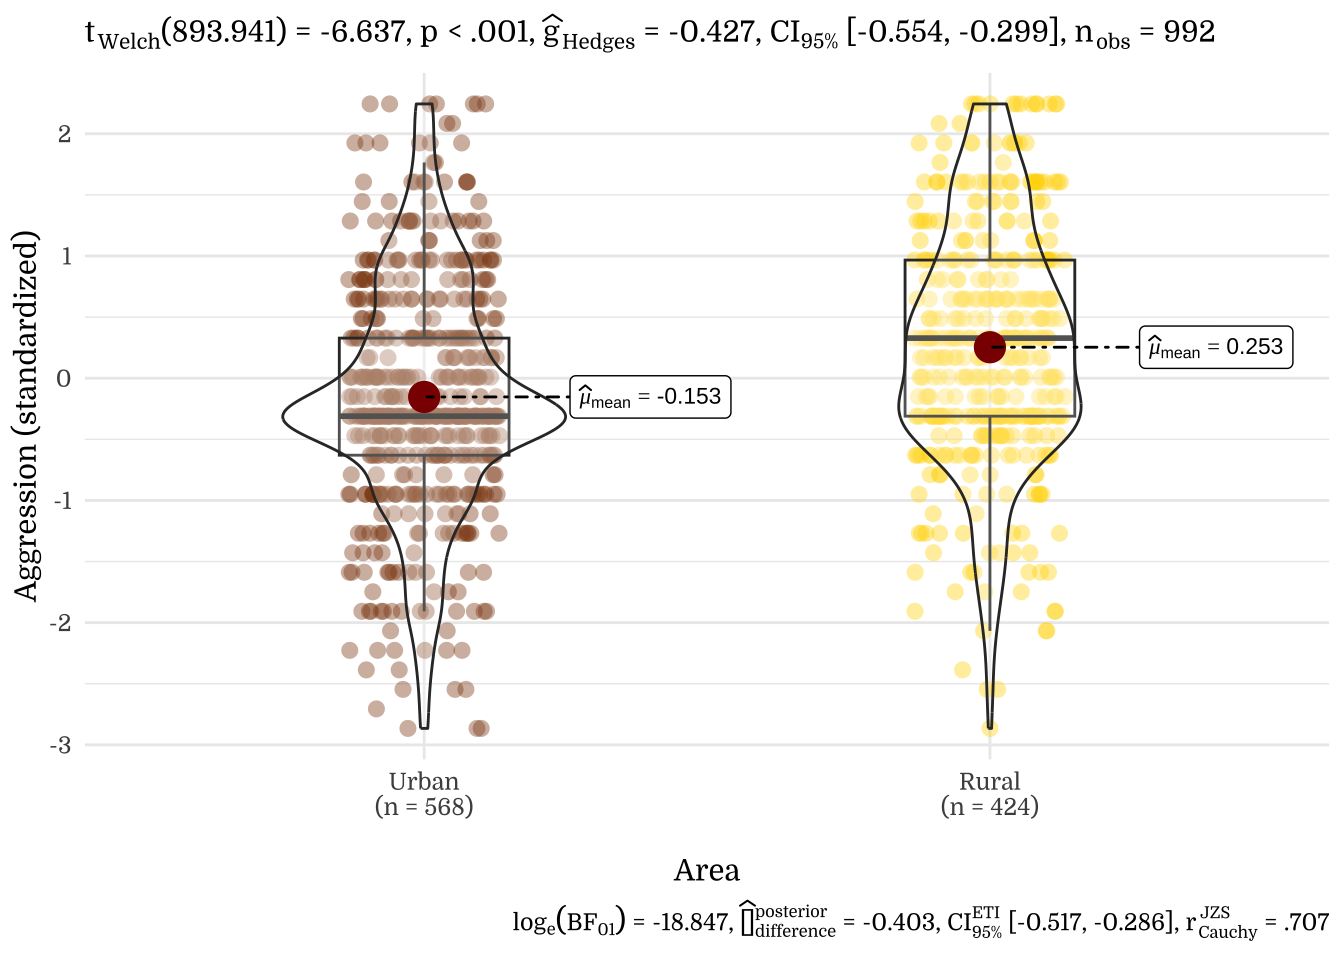
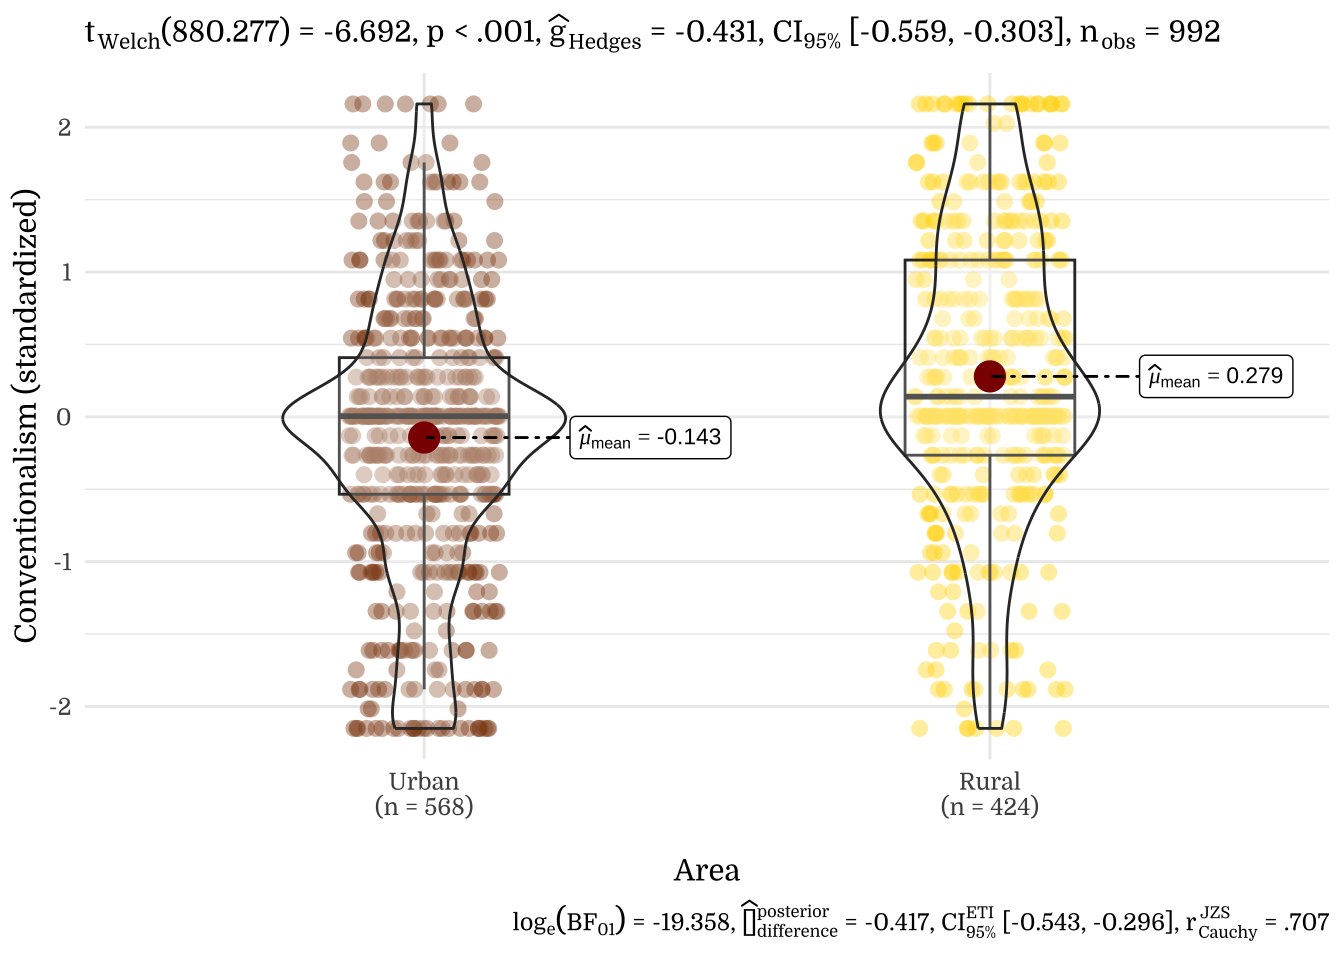
| Area | N | Mean | SD |
|---|---|---|---|
| Urban | 568 | -0.15 | 0.94 |
| Rural | 424 | 0.25 | 0.97 |
| NA | 1008 | -0.02 | 1.03 |
| Area | N | Mean | SD |
|---|---|---|---|
| Urban | 568 | -0.07 | 1.04 |
| Rural | 424 | 0.22 | 0.97 |
| NA | 1008 | -0.05 | 0.98 |
| Area | N | Mean | SD |
|---|---|---|---|
| Urban | 568 | -0.14 | 0.95 |
| Rural | 424 | 0.28 | 1.01 |
| NA | 1008 | -0.04 | 1.00 |
3.9 Religious Affiliation
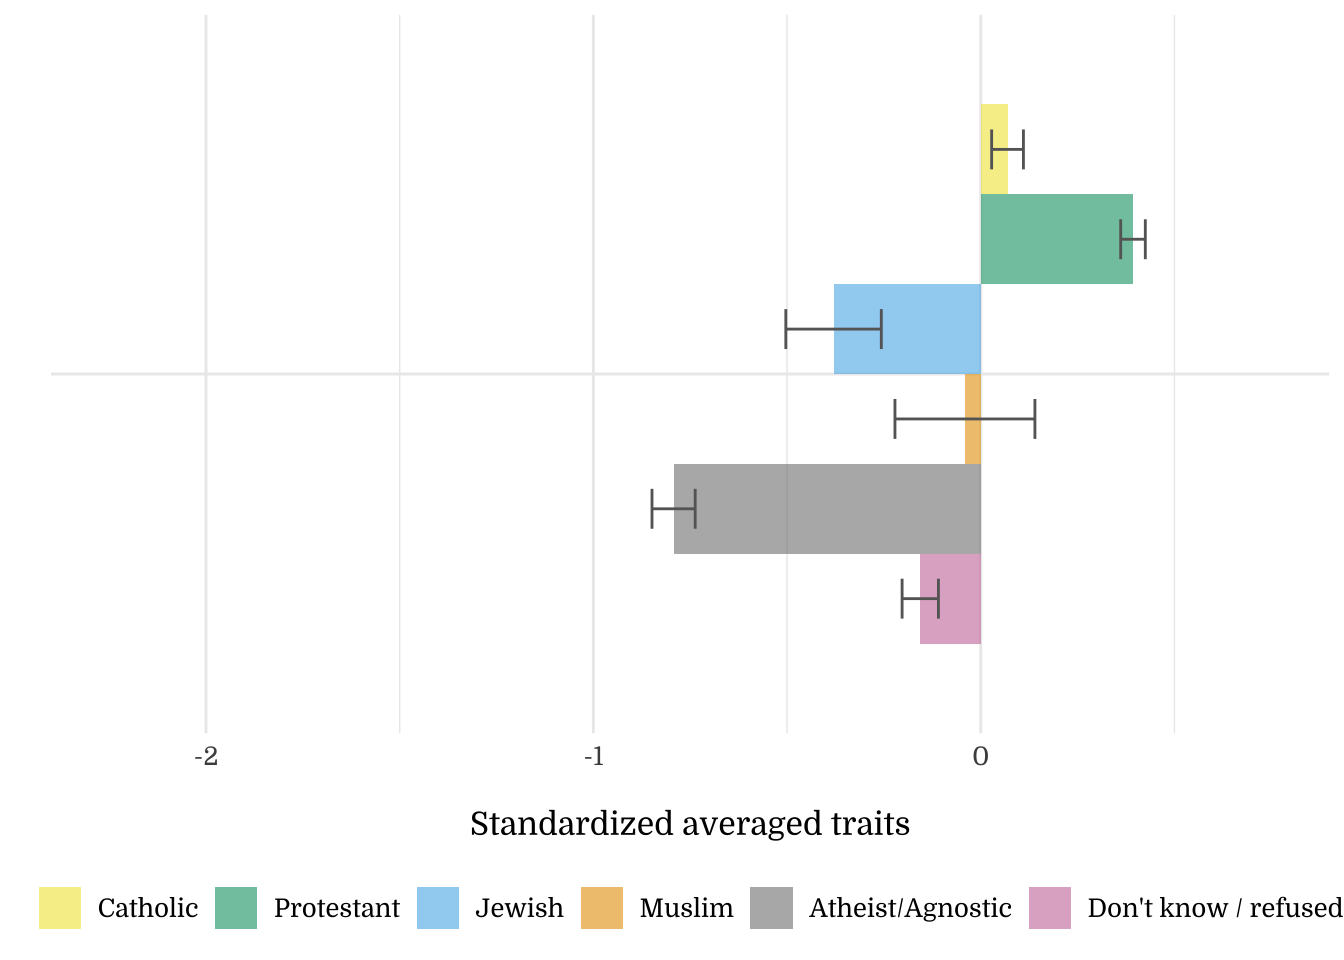
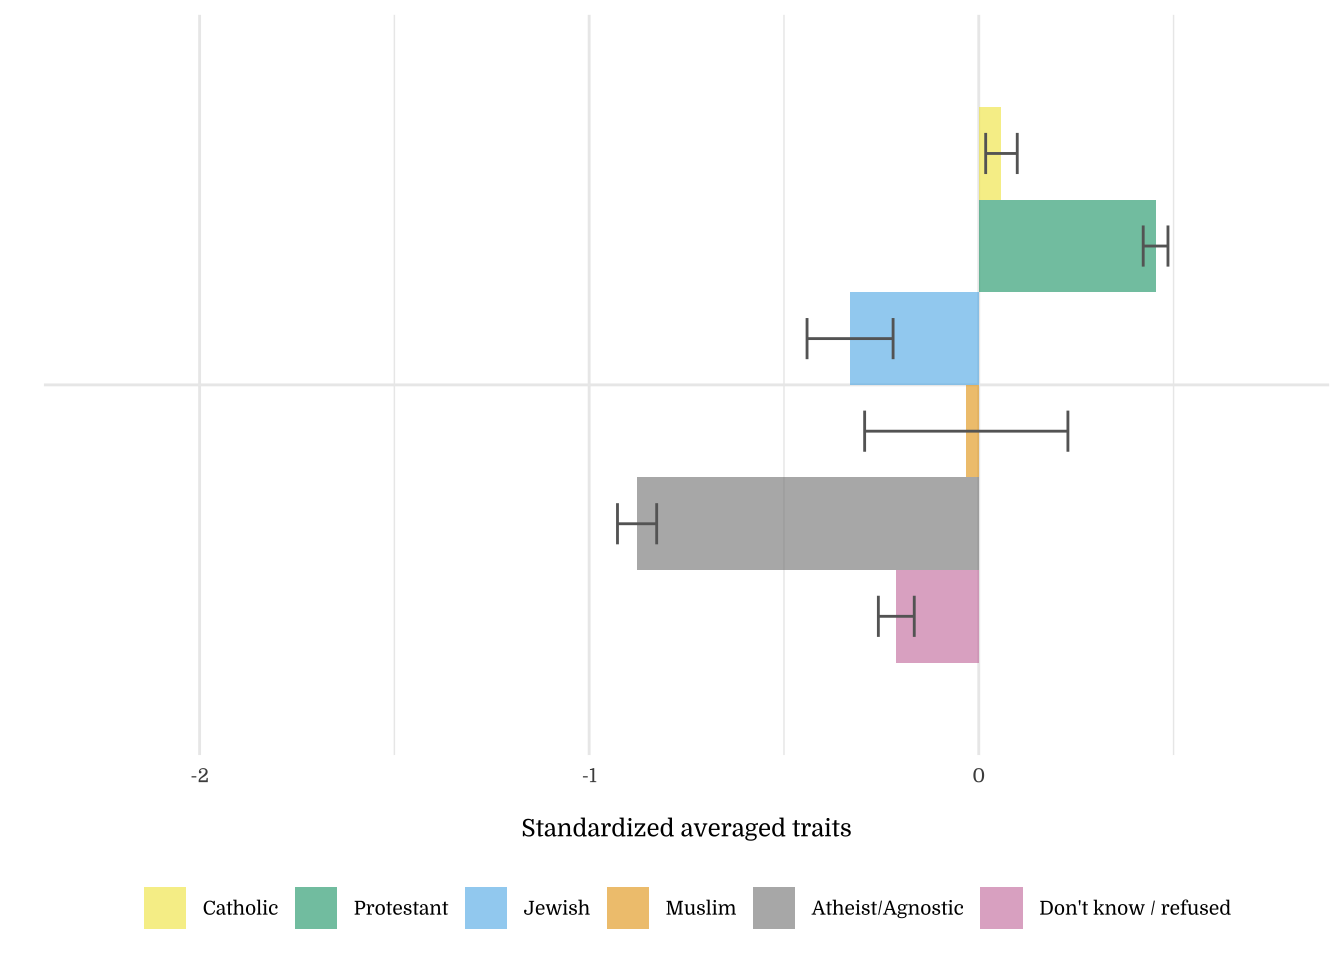
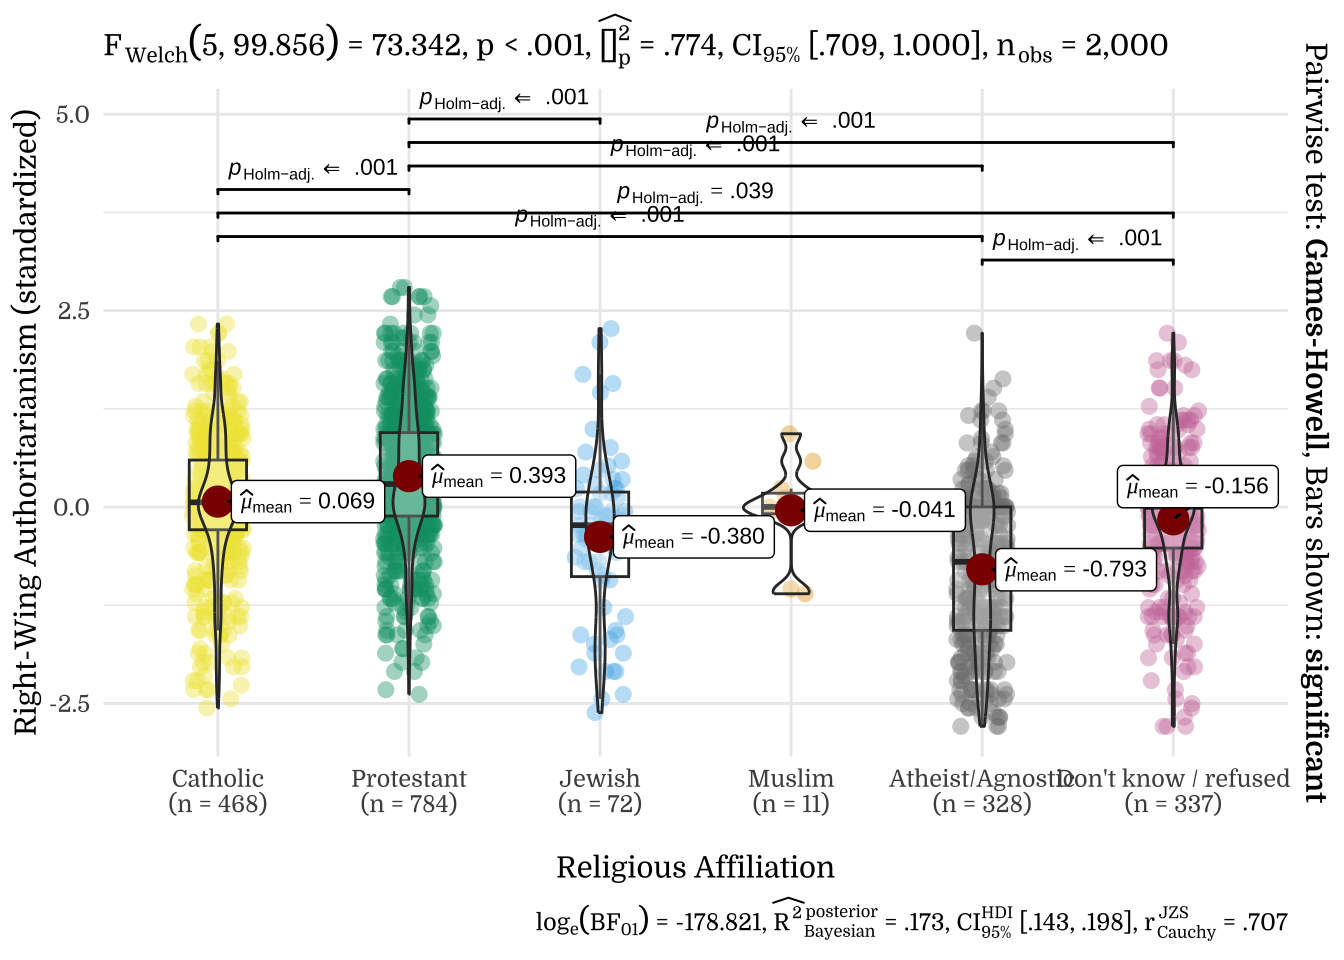
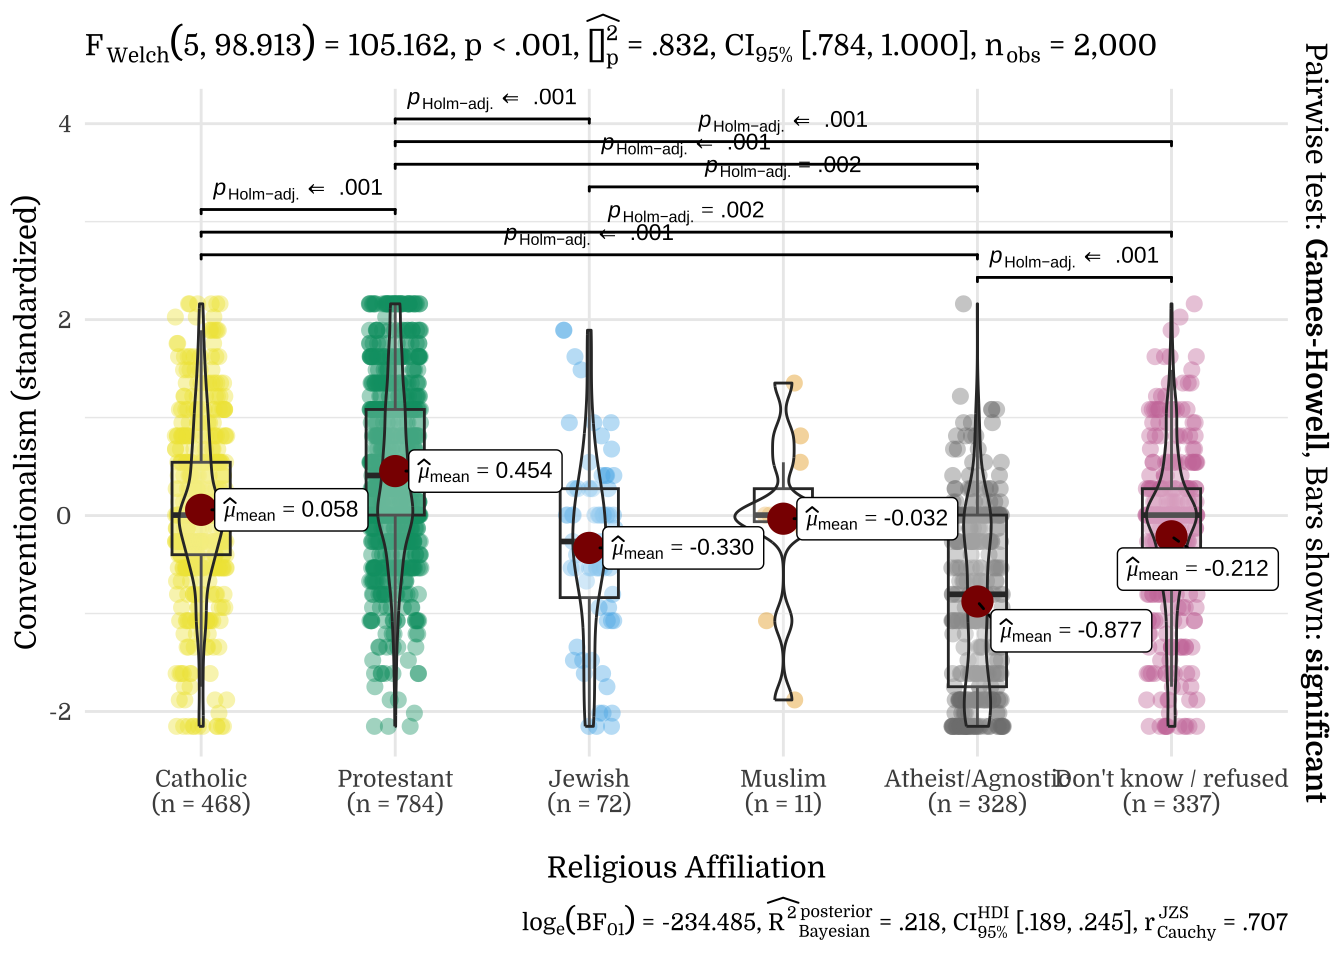
| Religious Affiliation | N | Mean | SD |
|---|---|---|---|
| Catholic | 468 | 0.05 | 0.94 |
| Protestant | 784 | 0.23 | 0.98 |
| Jewish | 72 | -0.29 | 1.11 |
| Muslim | 11 | -0.22 | 0.31 |
| Atheist/Agnostic | 328 | -0.46 | 1.04 |
| Don't know / refused | 337 | -0.08 | 0.90 |
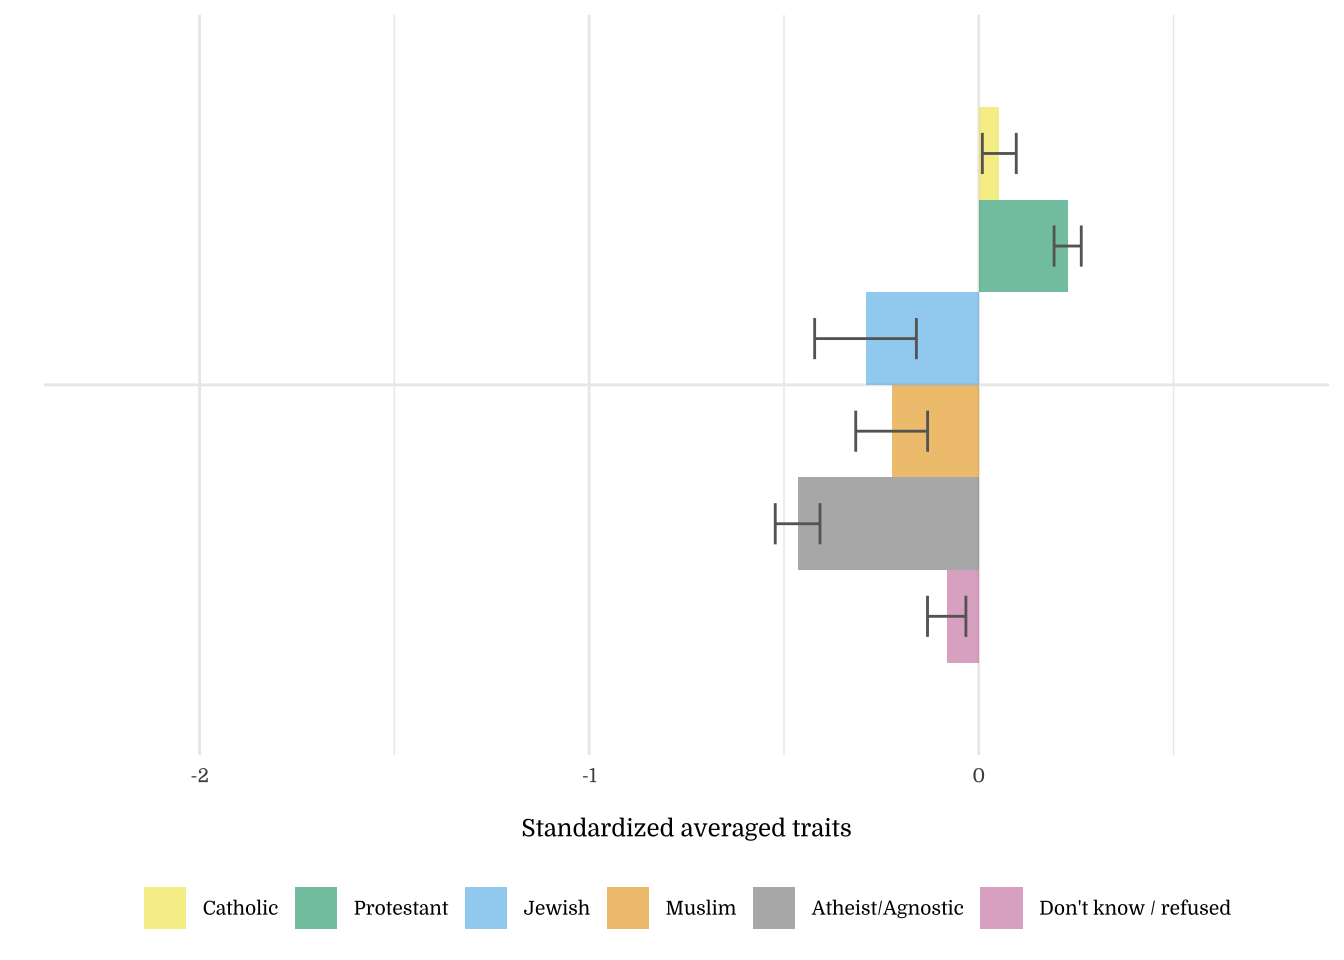
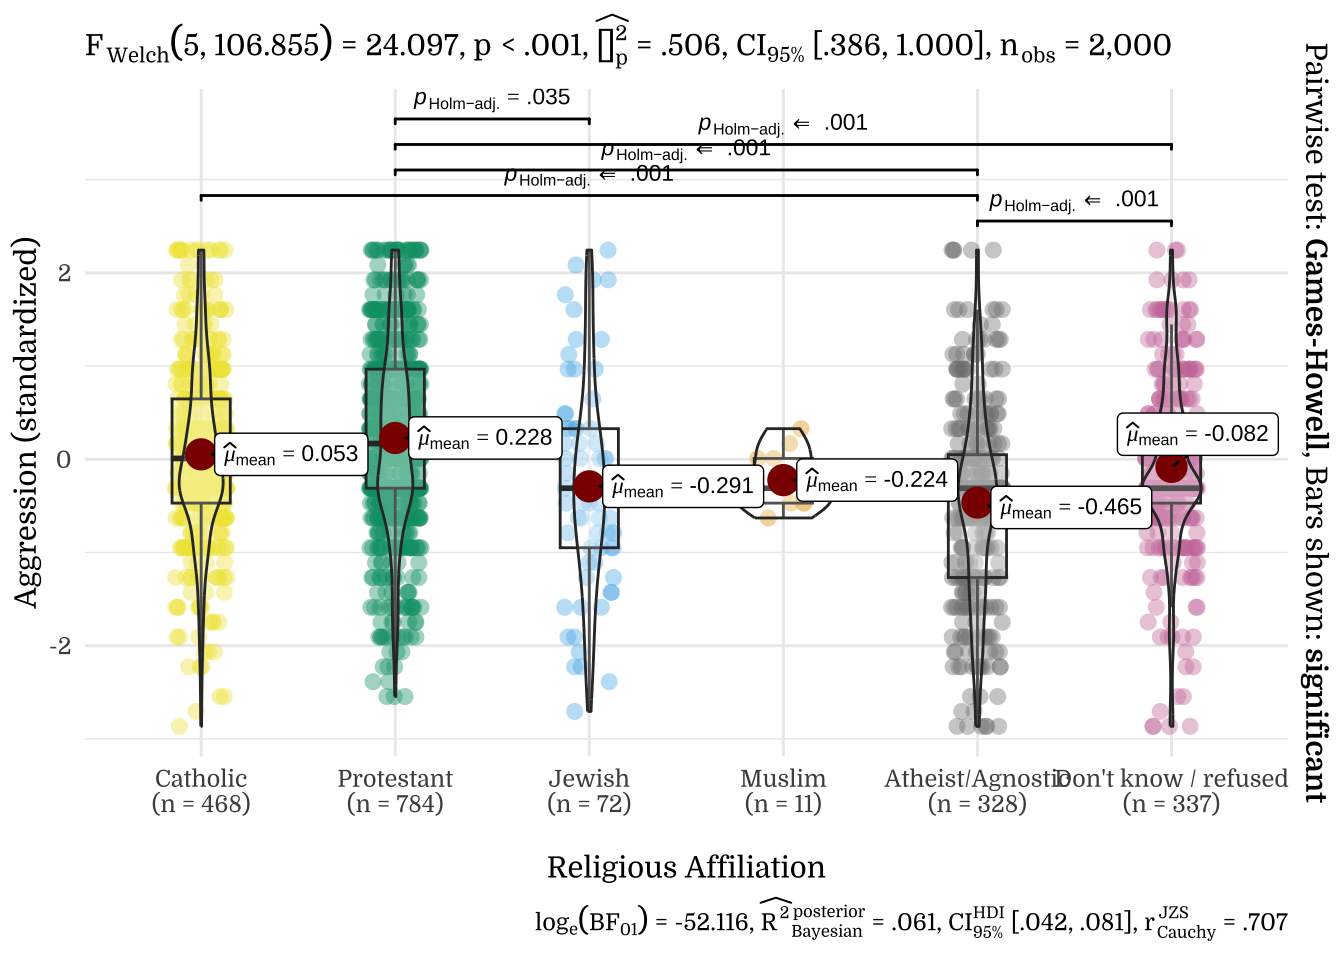
| Religious Affiliation | N | Mean | SD |
|---|---|---|---|
| Catholic | 468 | 0.07 | 0.91 |
| Protestant | 784 | 0.32 | 0.88 |
| Jewish | 72 | -0.37 | 1.06 |
| Muslim | 11 | 0.15 | 0.61 |
| Atheist/Agnostic | 328 | -0.69 | 1.08 |
| Don't know / refused | 337 | -0.10 | 0.91 |
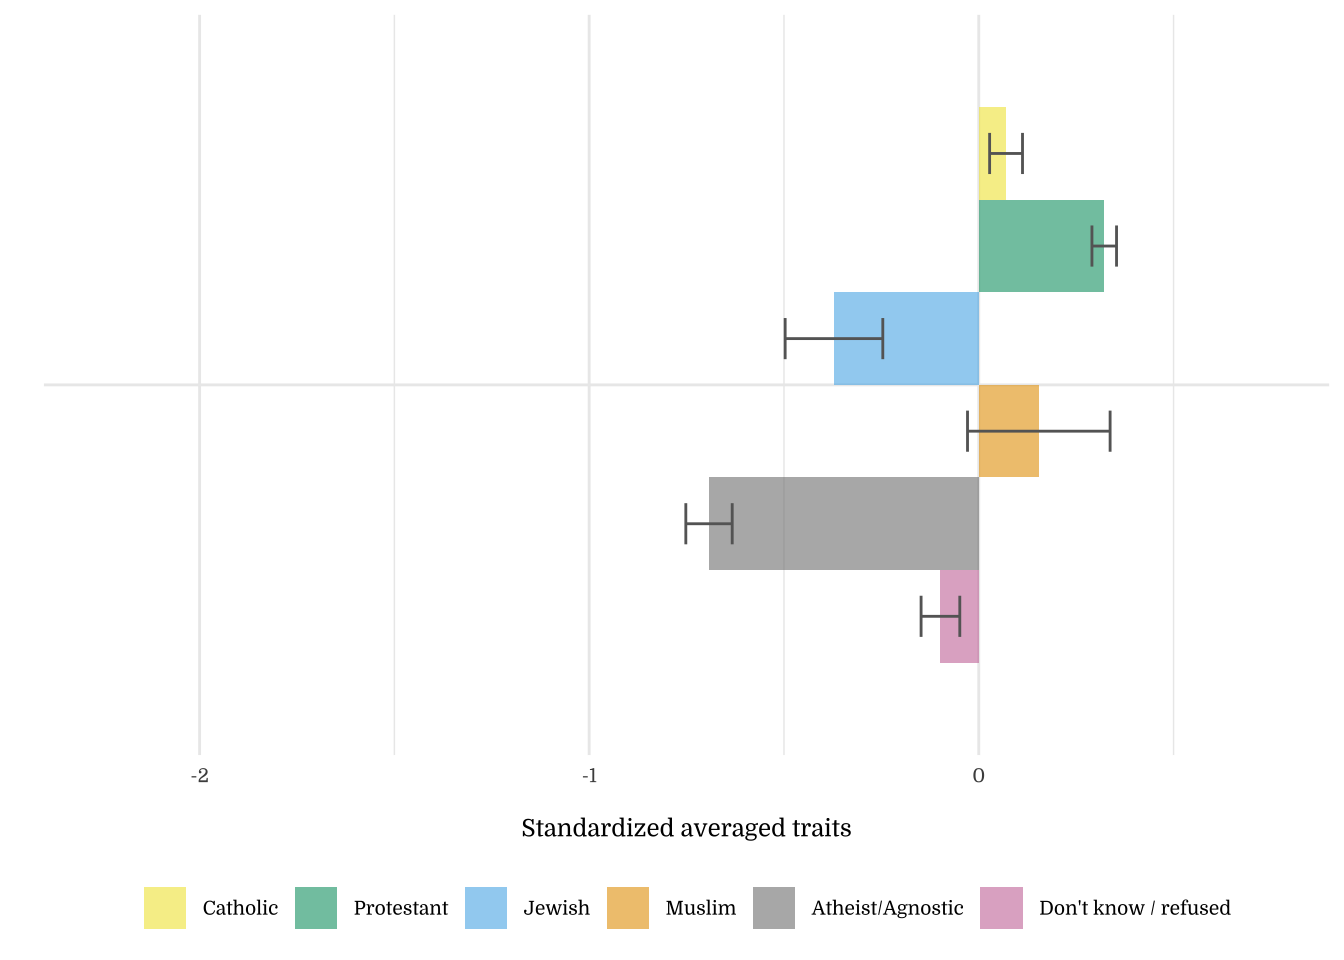
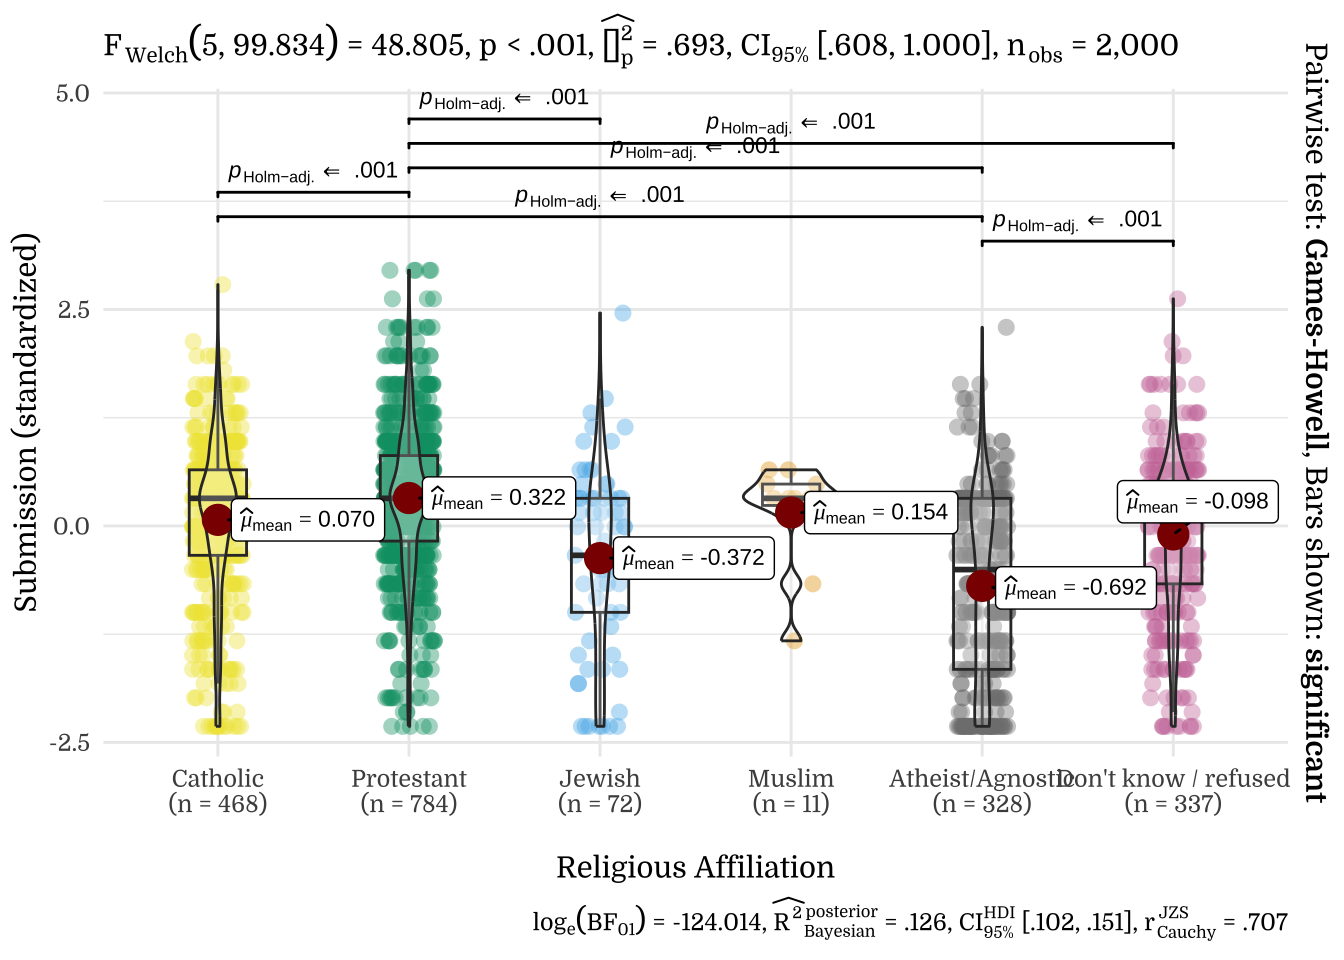
| Religious Affiliation | N | Mean | SD |
|---|---|---|---|
| Catholic | 468 | 0.06 | 0.88 |
| Protestant | 784 | 0.45 | 0.89 |
| Jewish | 72 | -0.33 | 0.94 |
| Muslim | 11 | -0.03 | 0.87 |
| Atheist/Agnostic | 328 | -0.88 | 0.91 |
| Don't know / refused | 337 | -0.21 | 0.85 |
3.10 Section Summary
| Right-Wing Authoritarianism | |||
|---|---|---|---|
| Predictors | Estimates | CI | p |
| (Intercept) | 4.76 | 4.51 – 5.02 | <.001 |
| Age | 0.20 | 0.16 – 0.24 | <.001 |
| Income | -0.01 | -0.04 – 0.02 | .377 |
| Education | -0.23 | -0.32 – -0.15 | <.001 |
| Gender (Male) | 0.02 | -0.11 – 0.14 | .810 |
| Observations | 2000 | ||
| R2 / R2 adjusted | .065 / .063 | ||
4 Political Behavior
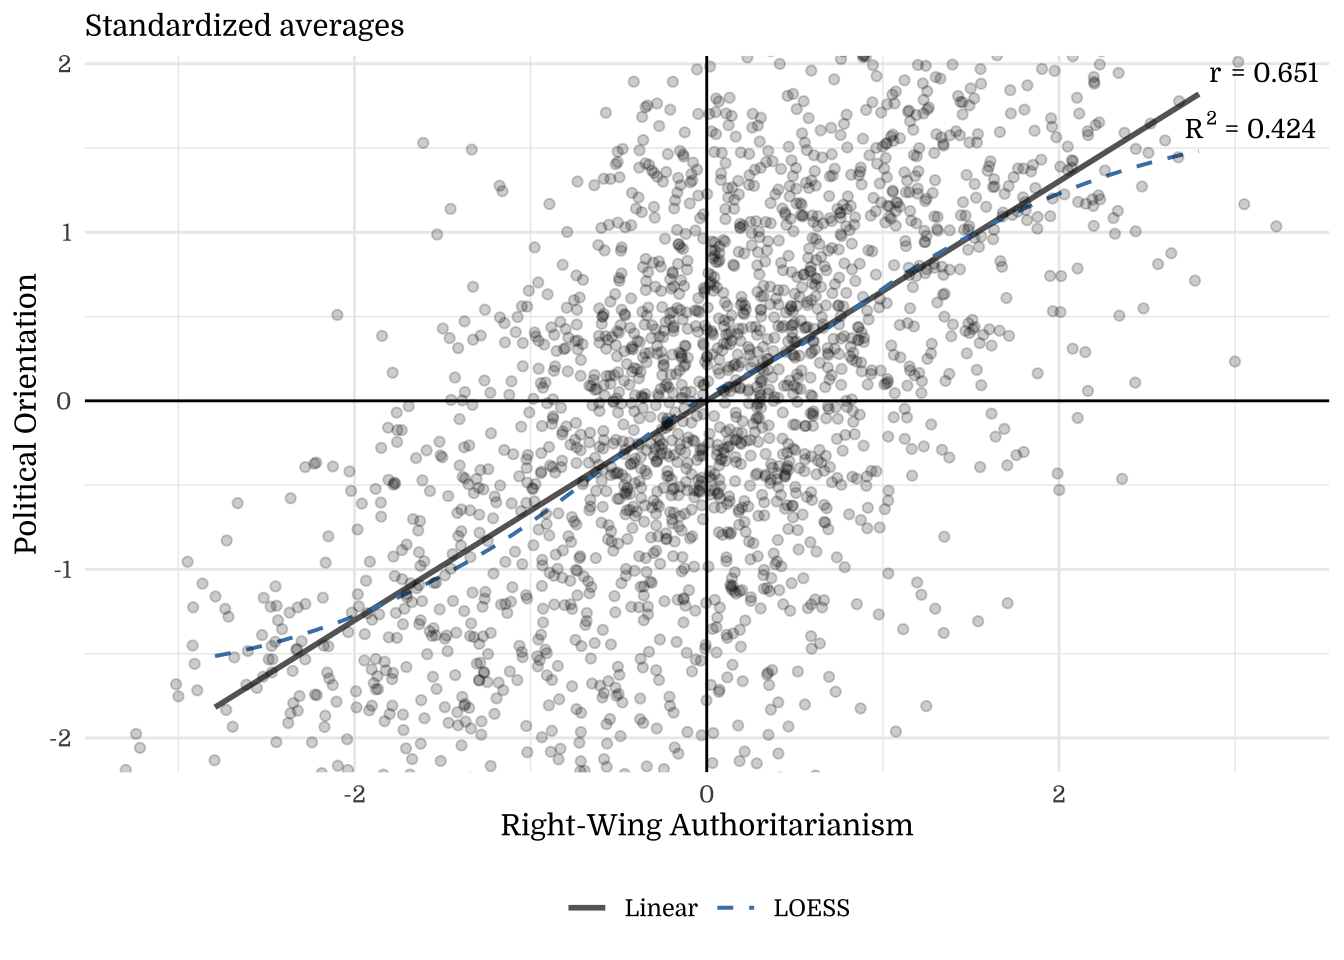
4.1 Political Orientation
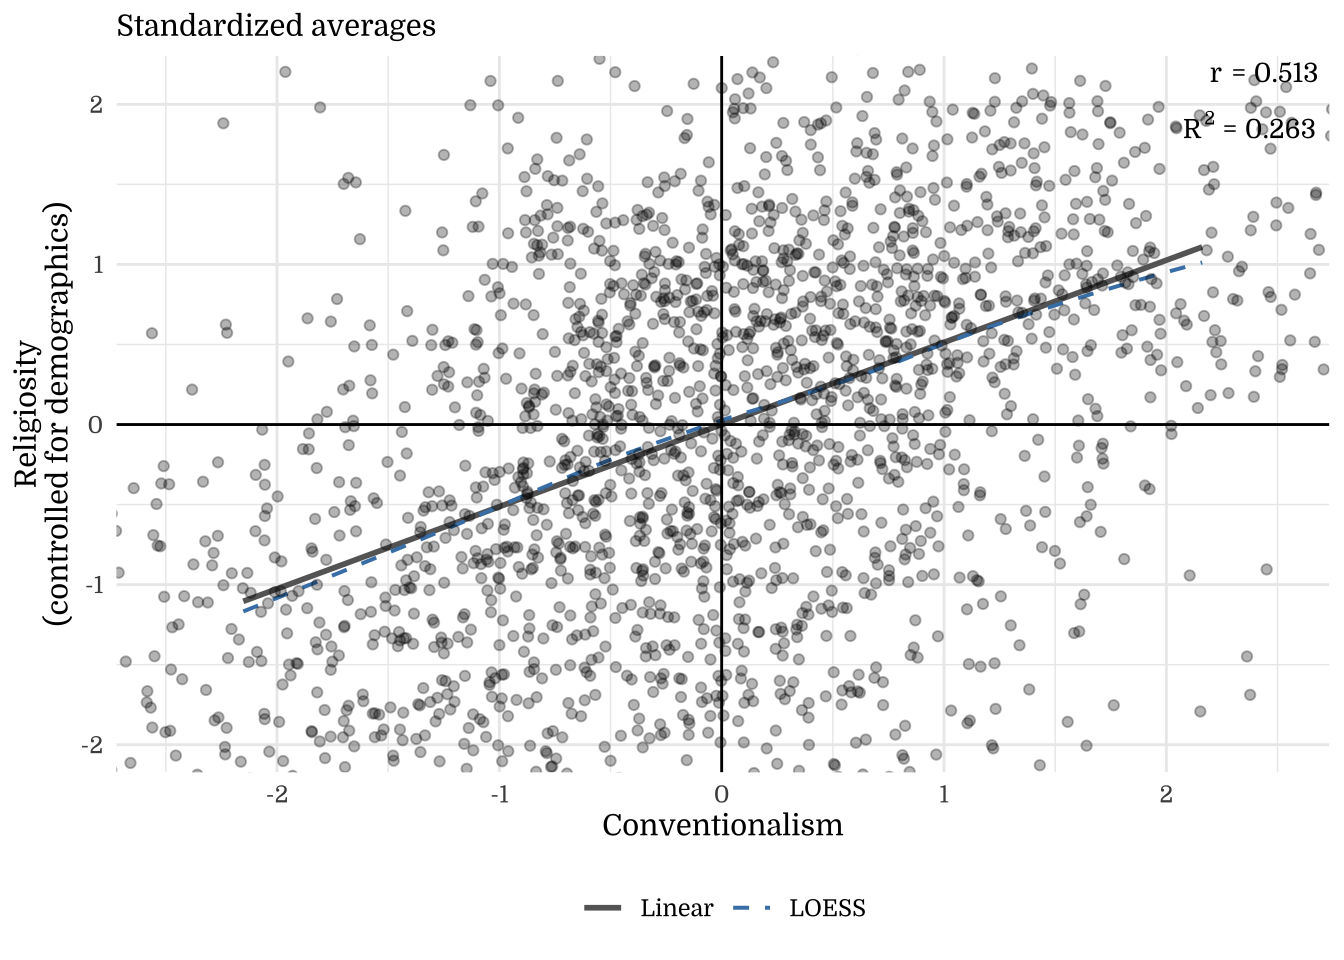
Correlation with General Conservatism, Economic Conservatism, Social Conservatism
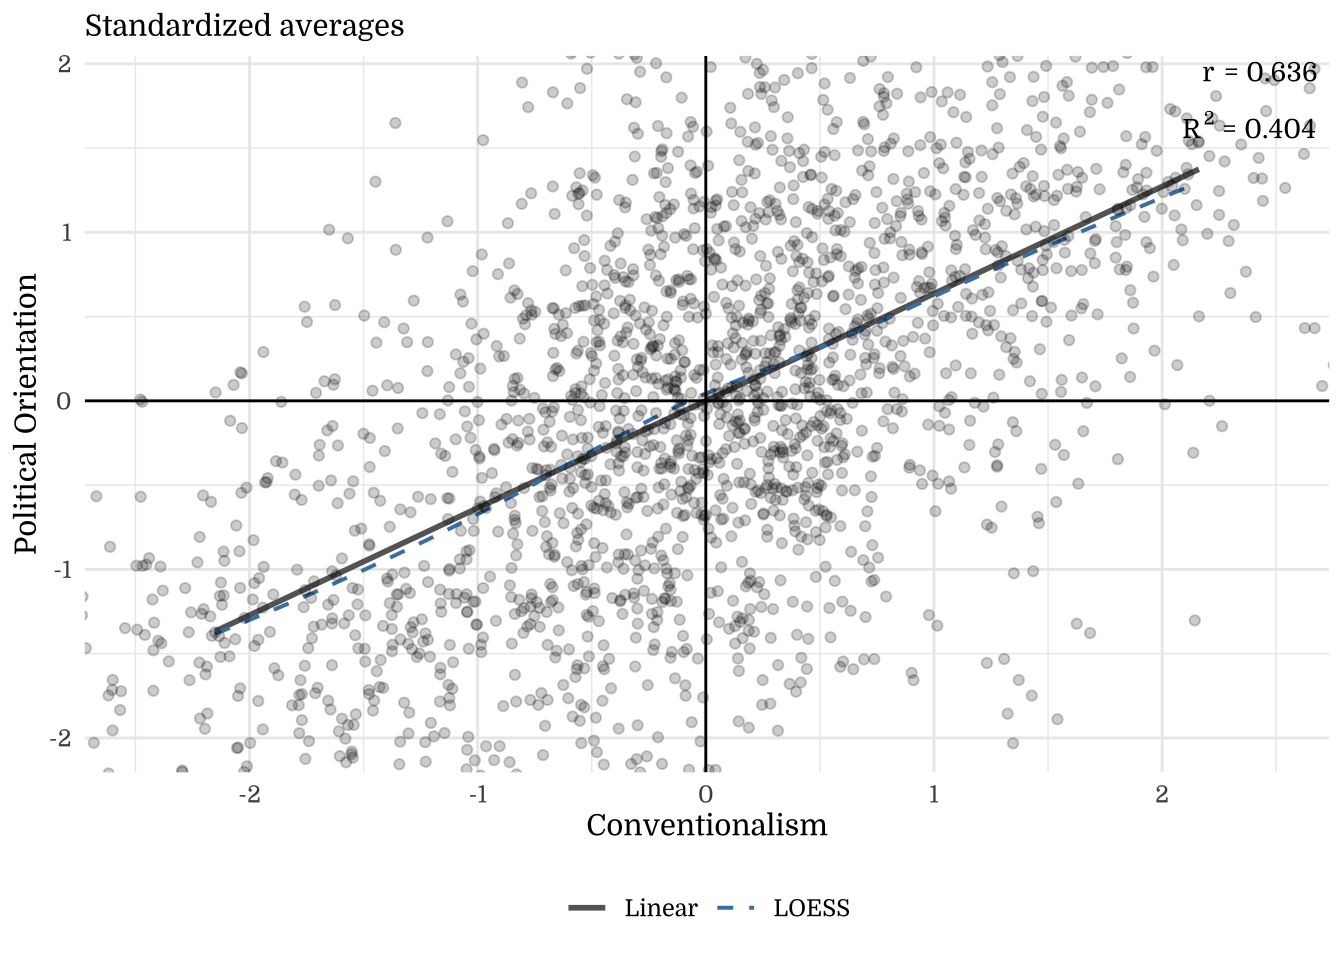
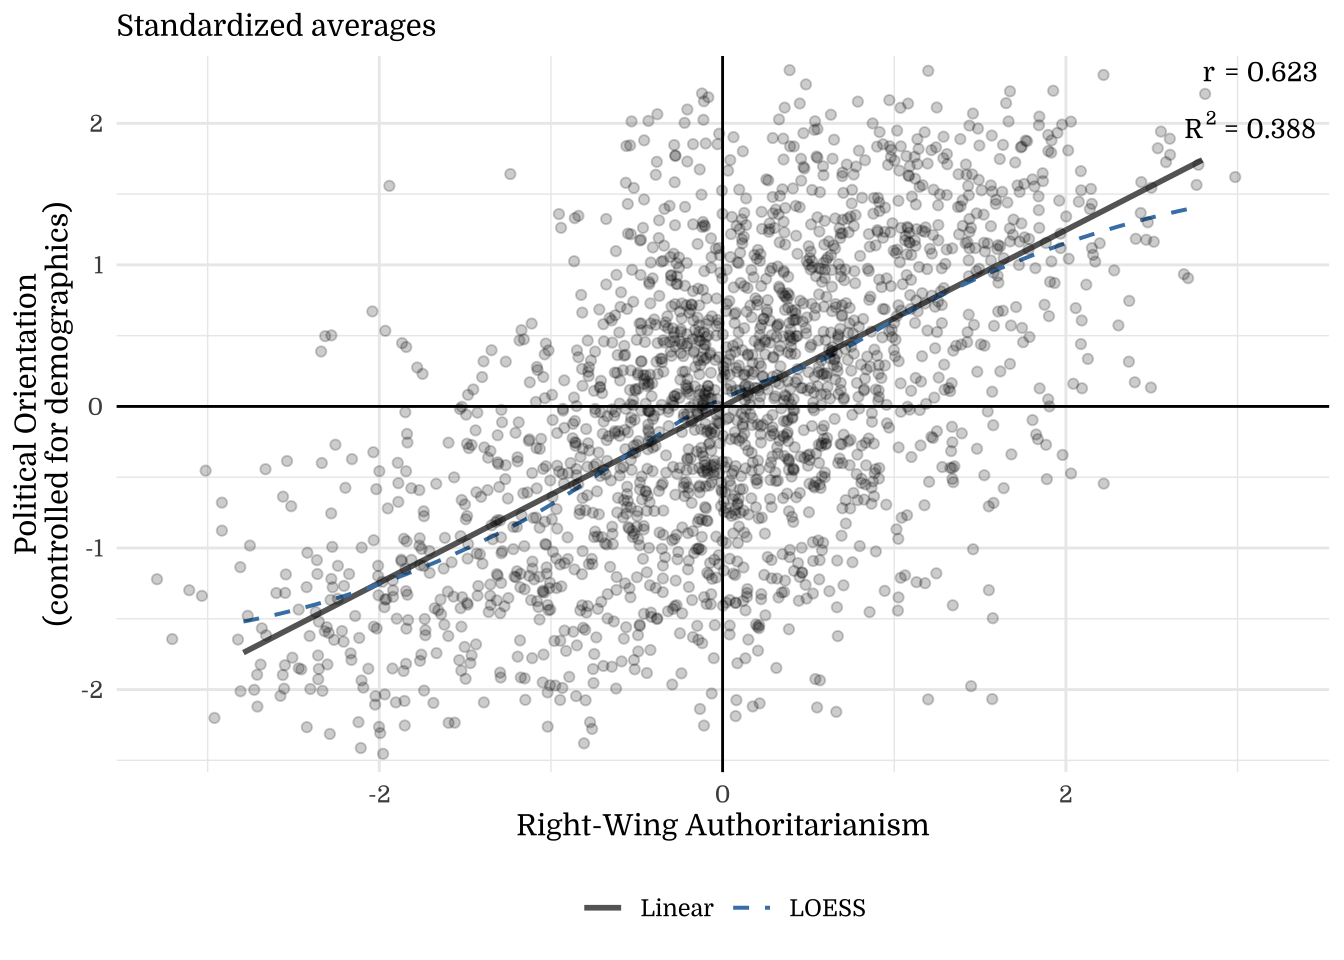
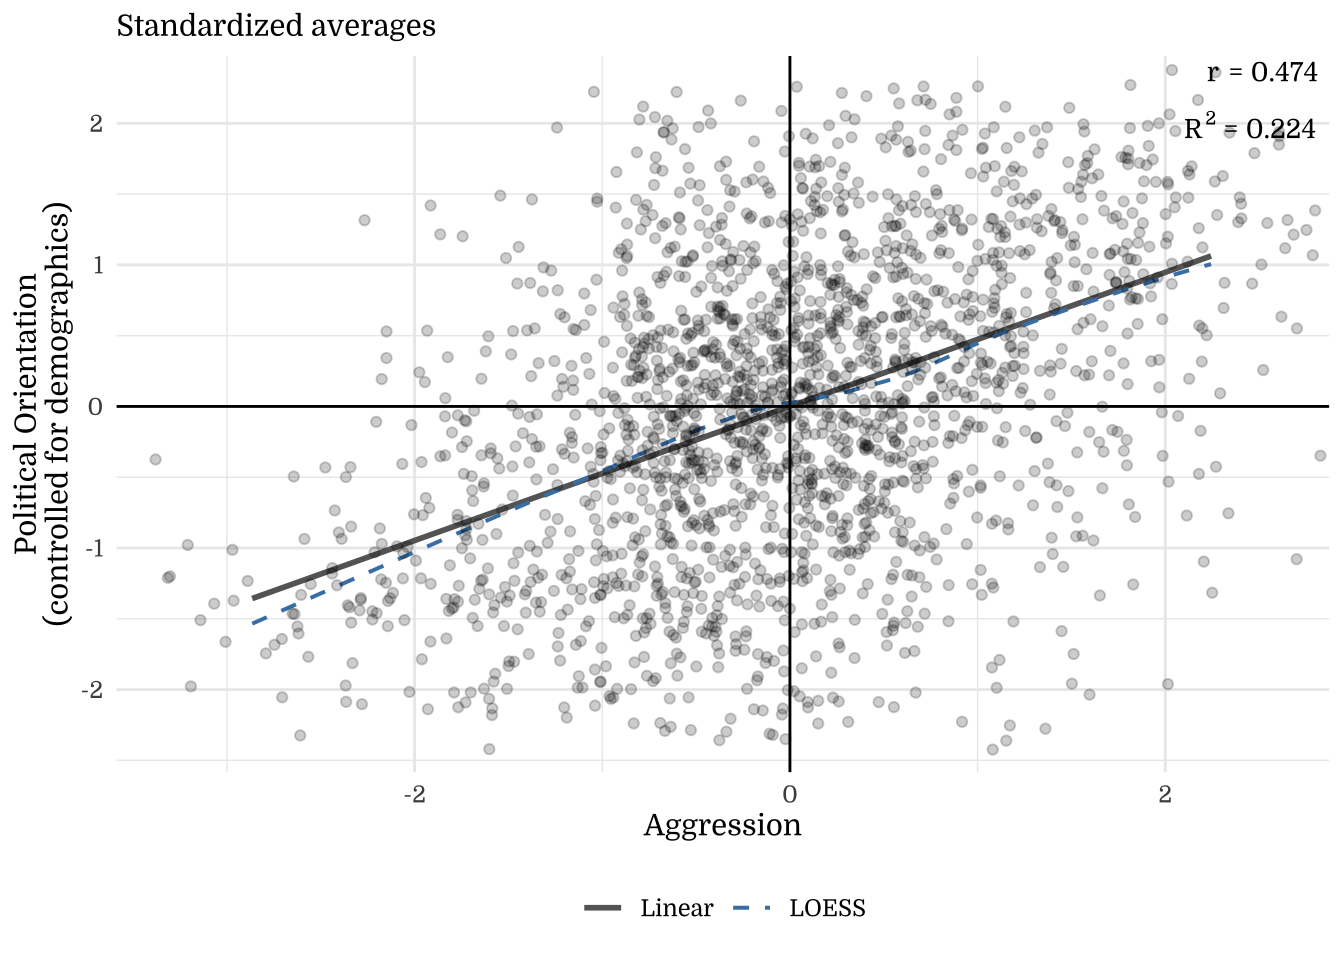
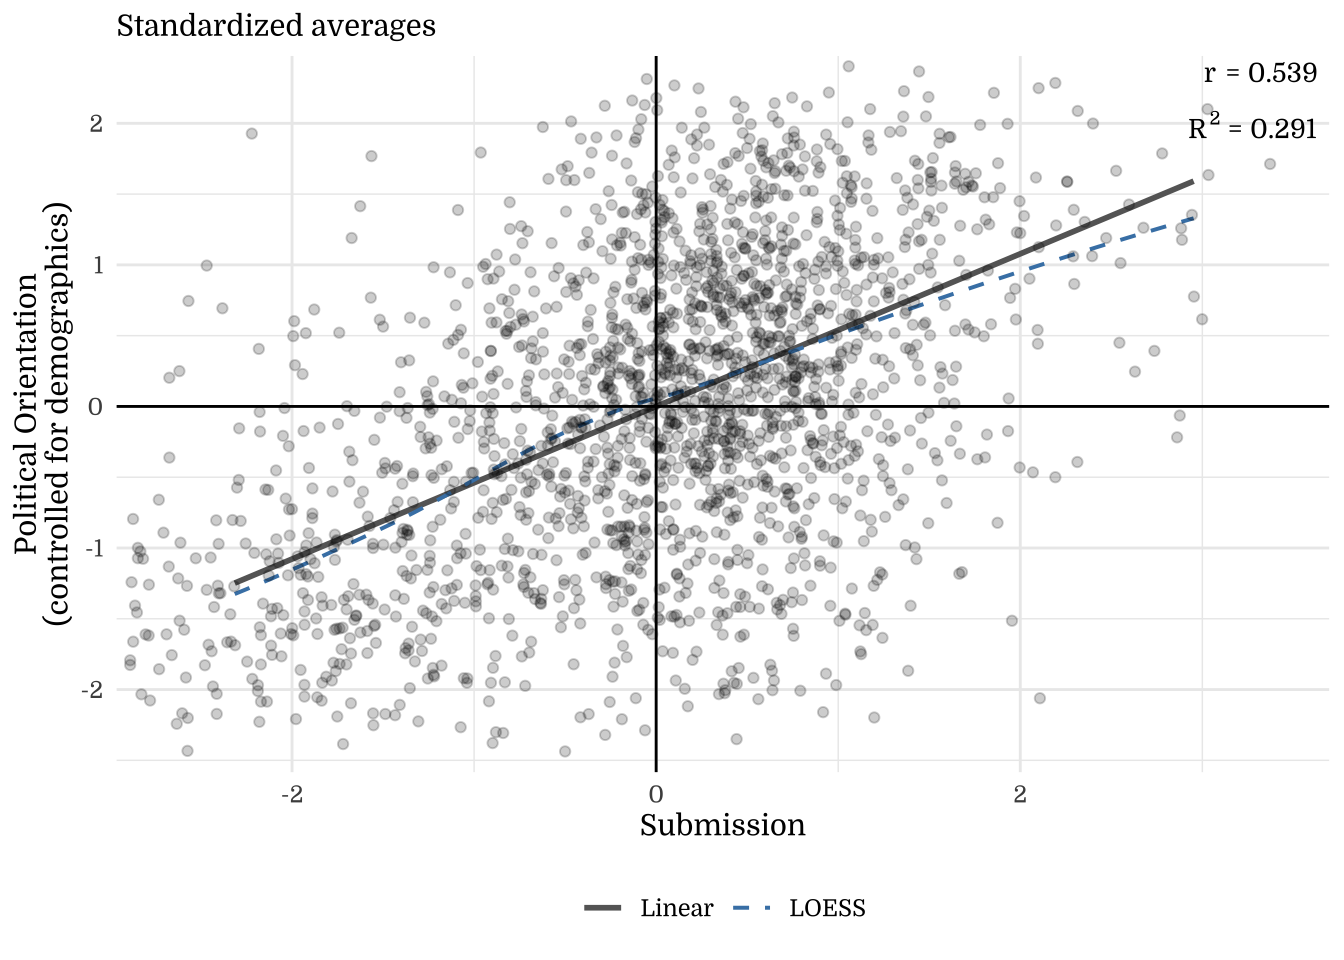
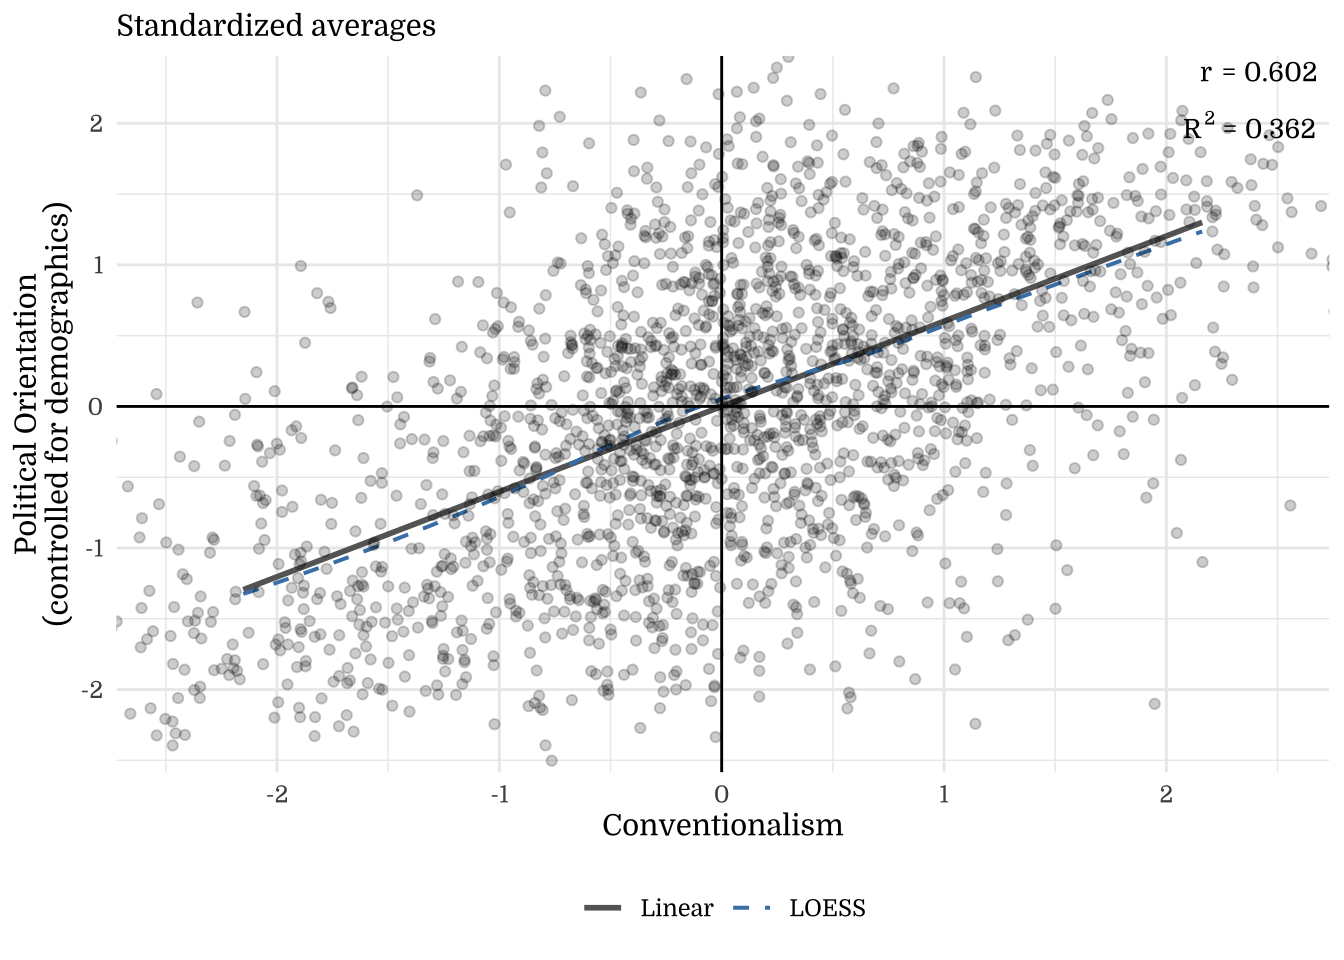
Note. The y-axis shows residuals after regressing the outcome on demographics (Age, Income, Education, Gender). This illustrates how much the focal construct explains beyond demographic factors.
| Political Orientation | Social Political Orientation | Economic Political Orientation | Composite Political Orientation | |||||||||
|---|---|---|---|---|---|---|---|---|---|---|---|---|
| Predictors | Estimates | CI | p | Estimates | CI | p | Estimates | CI | p | Estimates | CI | p |
| (Intercept) | 51.70 | 50.66 – 52.75 | <.001 | 50.03 | 48.96 – 51.10 | <.001 | 54.38 | 53.26 – 55.51 | <.001 | 52.04 | 51.05 – 53.03 | <.001 |
| Right-Wing Authoritarianism | 18.95 | 17.91 – 20.00 | <.001 | 20.89 | 19.82 – 21.96 | <.001 | 18.30 | 17.18 – 19.43 | <.001 | 19.38 | 18.39 – 20.37 | <.001 |
| Observations | 2000 | 2000 | 2000 | 2000 | ||||||||
| R2 / R2 adjusted | .389 / .388 | .423 / .423 | .338 / .337 | .424 / .424 | ||||||||
| Political Orientation | Social Political Orientation | Economic Political Orientation | Composite Political Orientation | |||||||||
|---|---|---|---|---|---|---|---|---|---|---|---|---|
| Predictors | Estimates | CI | p | Estimates | CI | p | Estimates | CI | p | Estimates | CI | p |
| (Intercept) | 51.70 | 50.53 – 52.88 | <.001 | 50.03 | 48.80 – 51.27 | <.001 | 54.38 | 53.15 – 55.62 | <.001 | 52.04 | 50.90 – 53.18 | <.001 |
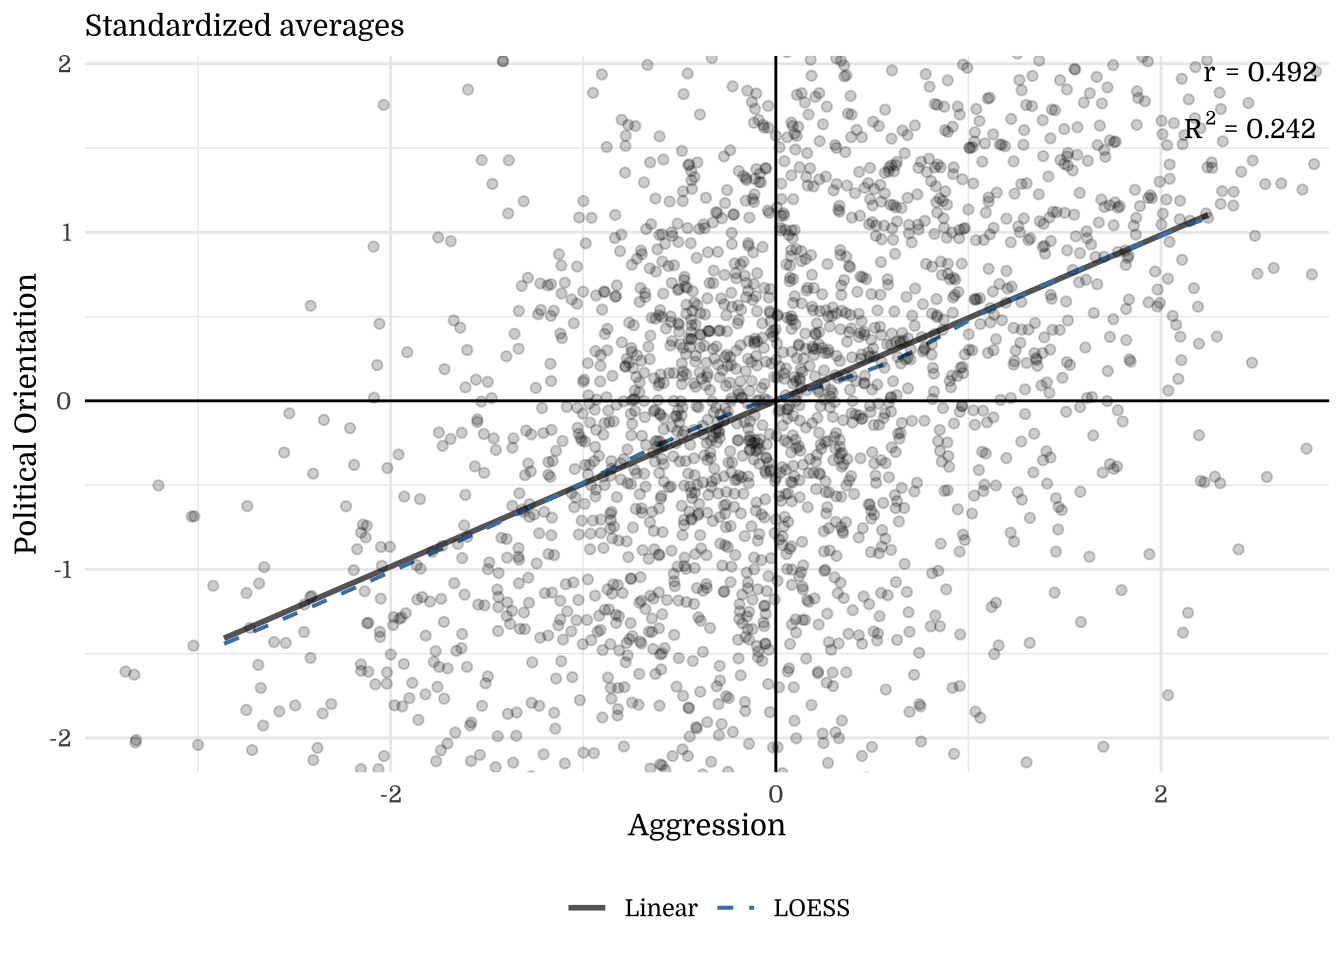
| Aggression | 14.47 | 13.30 – 15.65 | <.001 | 15.34 | 14.10 – 16.57 | <.001 | 14.10 | 12.86 – 15.33 | <.001 | 14.64 | 13.50 – 15.77 | <.001 |
| Observations | 2000 | 2000 | 2000 | 2000 | ||||||||
| R2 / R2 adjusted | .227 / .226 | .228 / .228 | .200 / .200 | .242 / .241 | ||||||||
| Political Orientation | Social Political Orientation | Economic Political Orientation | Composite Political Orientation | |||||||||
|---|---|---|---|---|---|---|---|---|---|---|---|---|
| Predictors | Estimates | CI | p | Estimates | CI | p | Estimates | CI | p | Estimates | CI | p |
| (Intercept) | 51.70 | 50.58 – 52.83 | <.001 | 50.03 | 48.87 – 51.20 | <.001 | 54.38 | 53.18 – 55.59 | <.001 | 52.04 | 50.96 – 53.12 | <.001 |
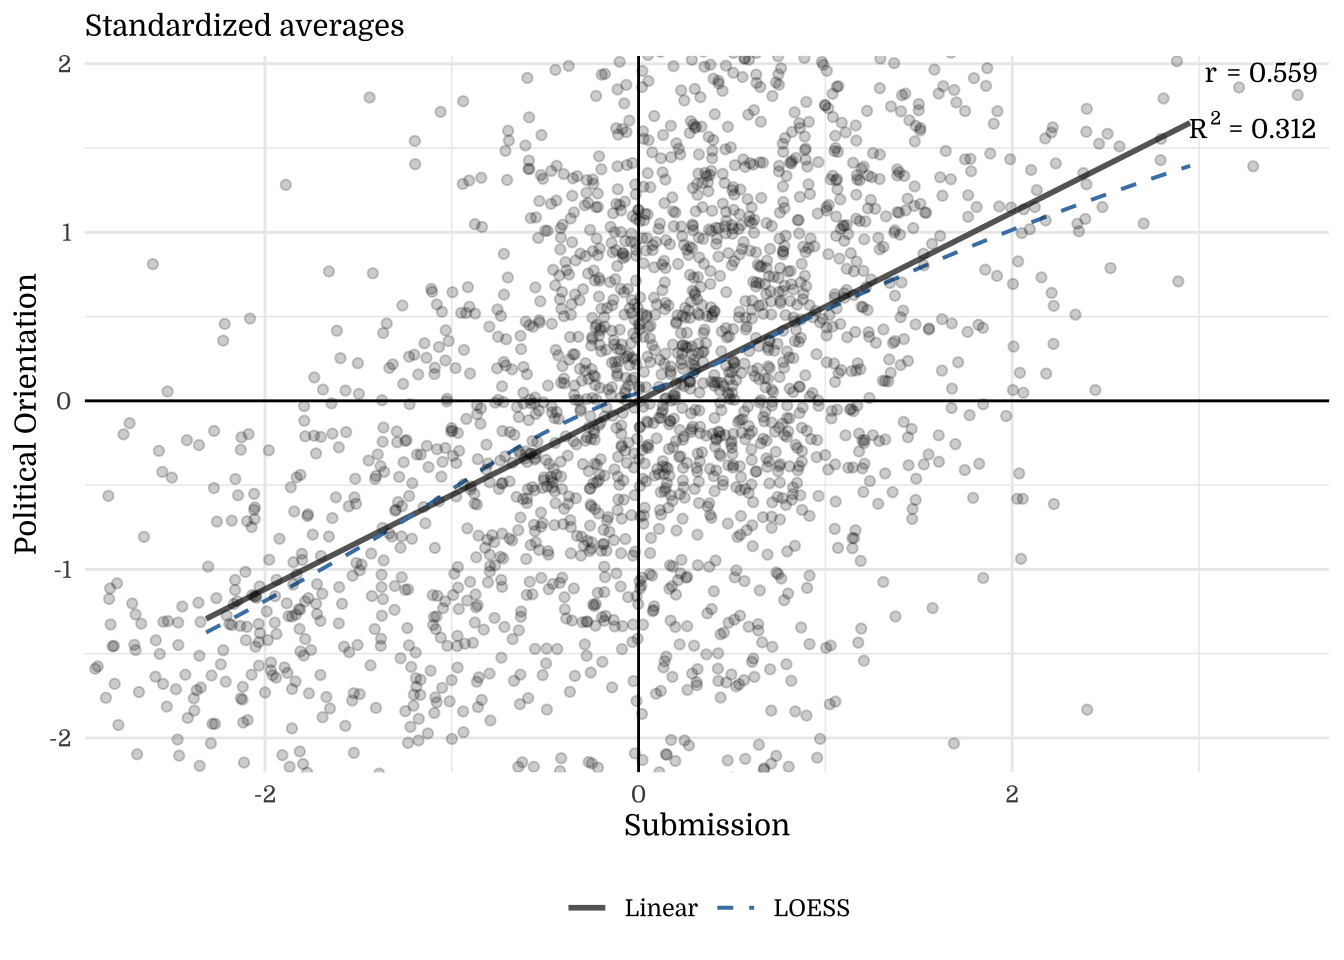
| Submission | 16.30 | 15.17 – 17.42 | <.001 | 18.07 | 16.90 – 19.23 | <.001 | 15.52 | 14.32 – 16.72 | <.001 | 16.63 | 15.54 – 17.71 | <.001 |
| Observations | 2000 | 2000 | 2000 | 2000 | ||||||||
| R2 / R2 adjusted | .287 / .287 | .317 / .316 | .243 / .242 | .312 / .312 | ||||||||
| Political Orientation | Social Political Orientation | Economic Political Orientation | Composite Political Orientation | |||||||||
|---|---|---|---|---|---|---|---|---|---|---|---|---|
| Predictors | Estimates | CI | p | Estimates | CI | p | Estimates | CI | p | Estimates | CI | p |
| (Intercept) | 51.70 | 50.64 – 52.77 | <.001 | 50.03 | 48.96 – 51.11 | <.001 | 54.38 | 53.24 – 55.52 | <.001 | 52.04 | 51.03 – 53.05 | <.001 |
| Conventionalism | 18.34 | 17.28 – 19.40 | <.001 | 20.64 | 19.57 – 21.72 | <.001 | 17.79 | 16.64 – 18.93 | <.001 | 18.92 | 17.92 – 19.93 | <.001 |
| Observations | 2000 | 2000 | 2000 | 2000 | ||||||||
| R2 / R2 adjusted | .364 / .364 | .413 / .413 | .319 / .319 | .404 / .404 | ||||||||
| Political Orientation | Social Political Orientation | Economic Political Orientation | |||||||
|---|---|---|---|---|---|---|---|---|---|
| Predictors | Estimates | CI | p | Estimates | CI | p | Estimates | CI | p |
| (Intercept) | -21.15 | -26.80 – -15.49 | <.001 | -27.04 | -32.85 – -21.23 | <.001 | -23.25 | -29.31 – -17.20 | <.001 |
| RWA | 13.35 | 12.60 – 14.10 | <.001 | 14.66 | 13.89 – 15.43 | <.001 | 13.00 | 12.20 – 13.80 | <.001 |
| Age | 0.09 | -0.56 – 0.73 | .792 | -0.07 | -0.73 – 0.60 | .843 | 0.14 | -0.55 – 0.83 | .688 |
| Income | -0.26 | -0.79 – 0.26 | .325 | -0.38 | -0.92 – 0.16 | .168 | 0.39 | -0.18 – 0.95 | .180 |
| Education | 2.30 | 0.88 – 3.73 | .002 | 1.08 | -0.39 – 2.54 | .149 | 3.14 | 1.61 – 4.66 | <.001 |
| Gender (Male) | 1.71 | -0.41 – 3.83 | .114 | 2.53 | 0.35 – 4.71 | .023 | 2.81 | 0.54 – 5.09 | .015 |
| Observations | 2000 | 2000 | 2000 | ||||||
| R2 / R2 adjusted | .393 / .392 | .426 / .424 | .352 / .350 | ||||||
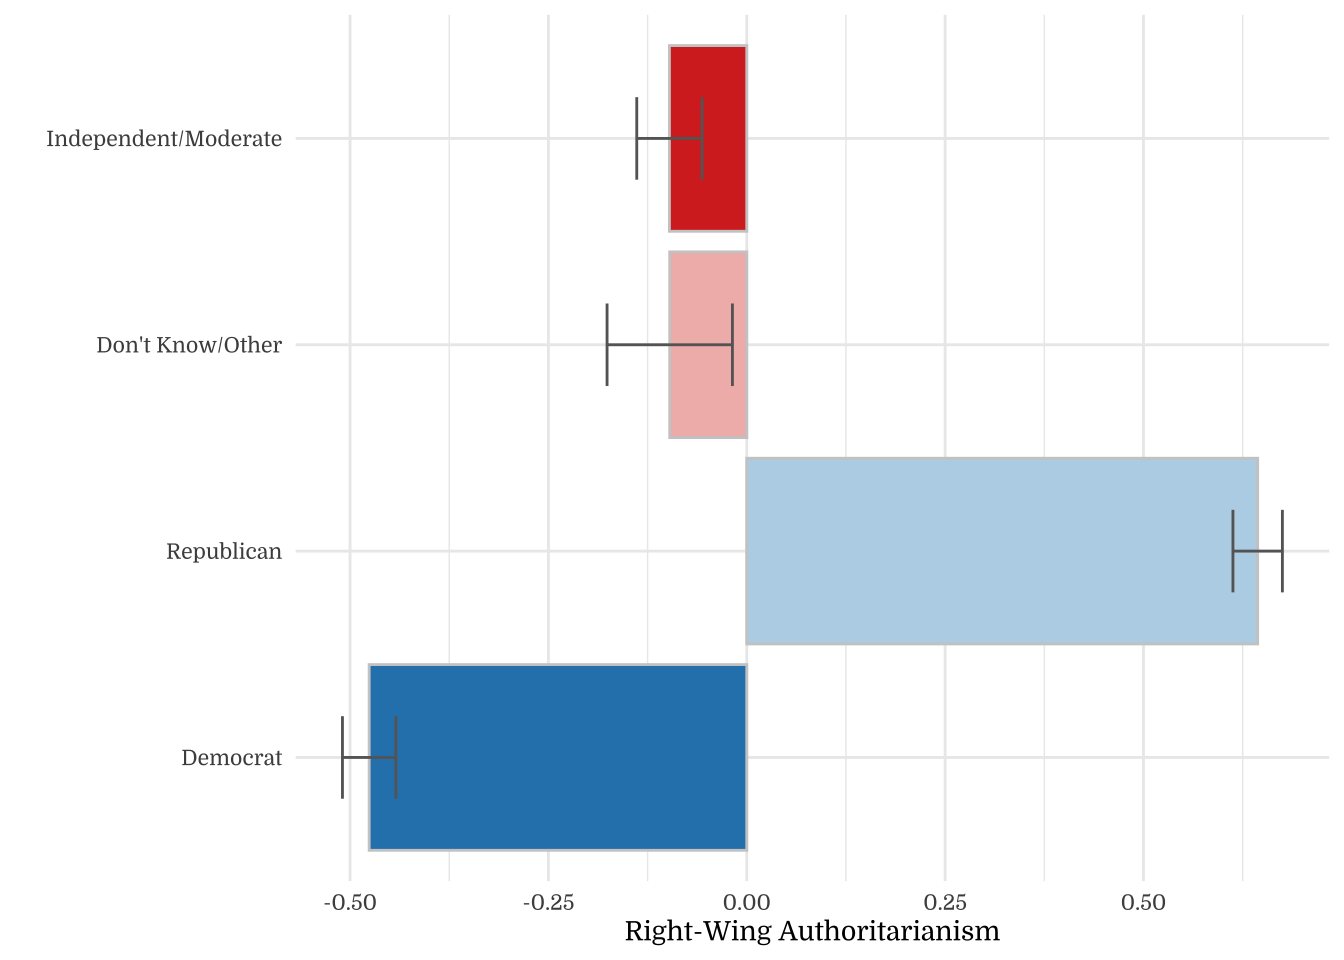
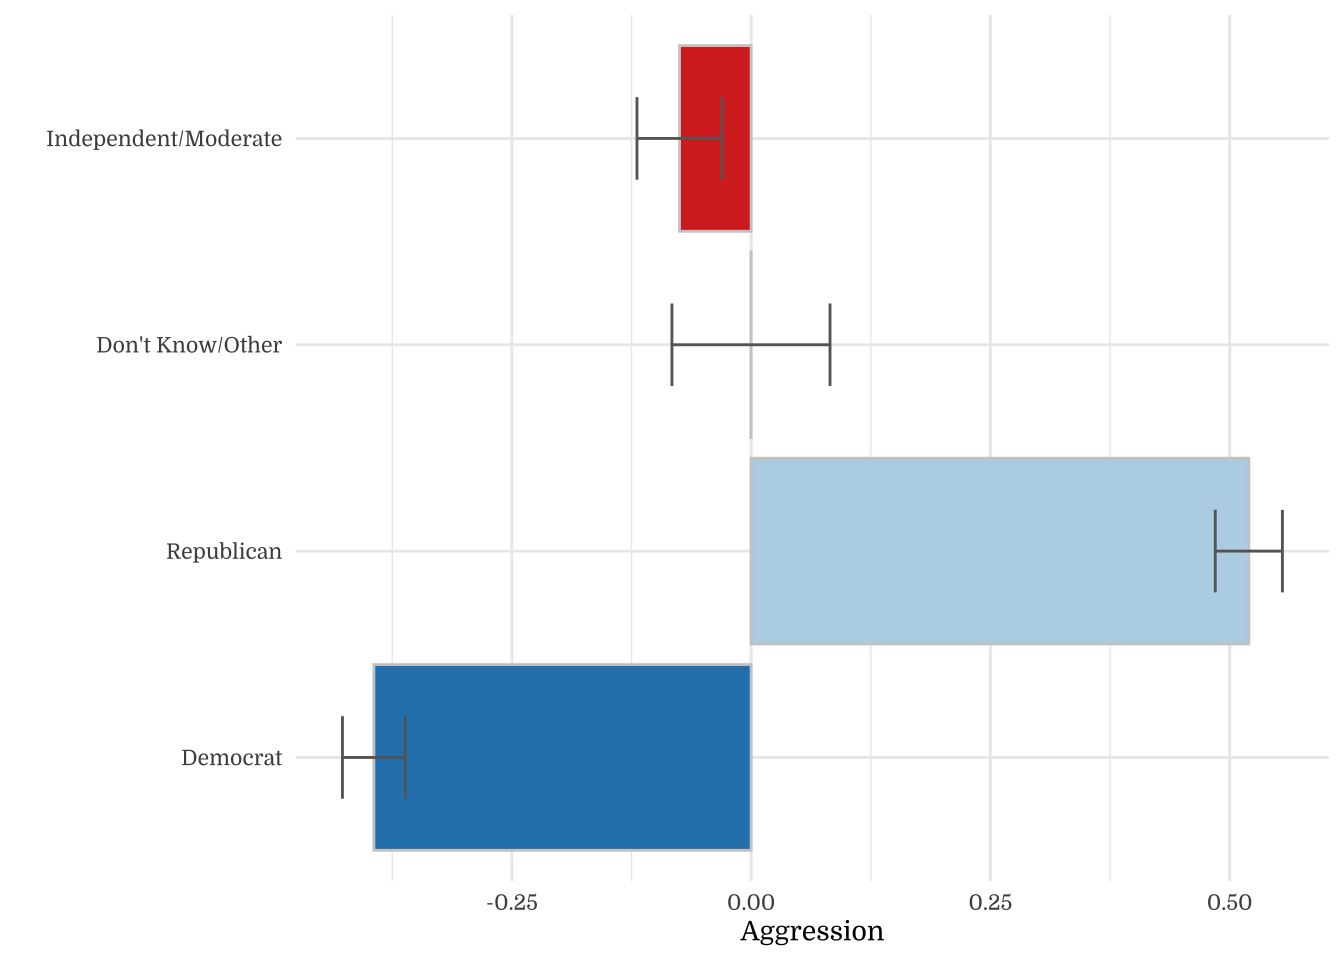
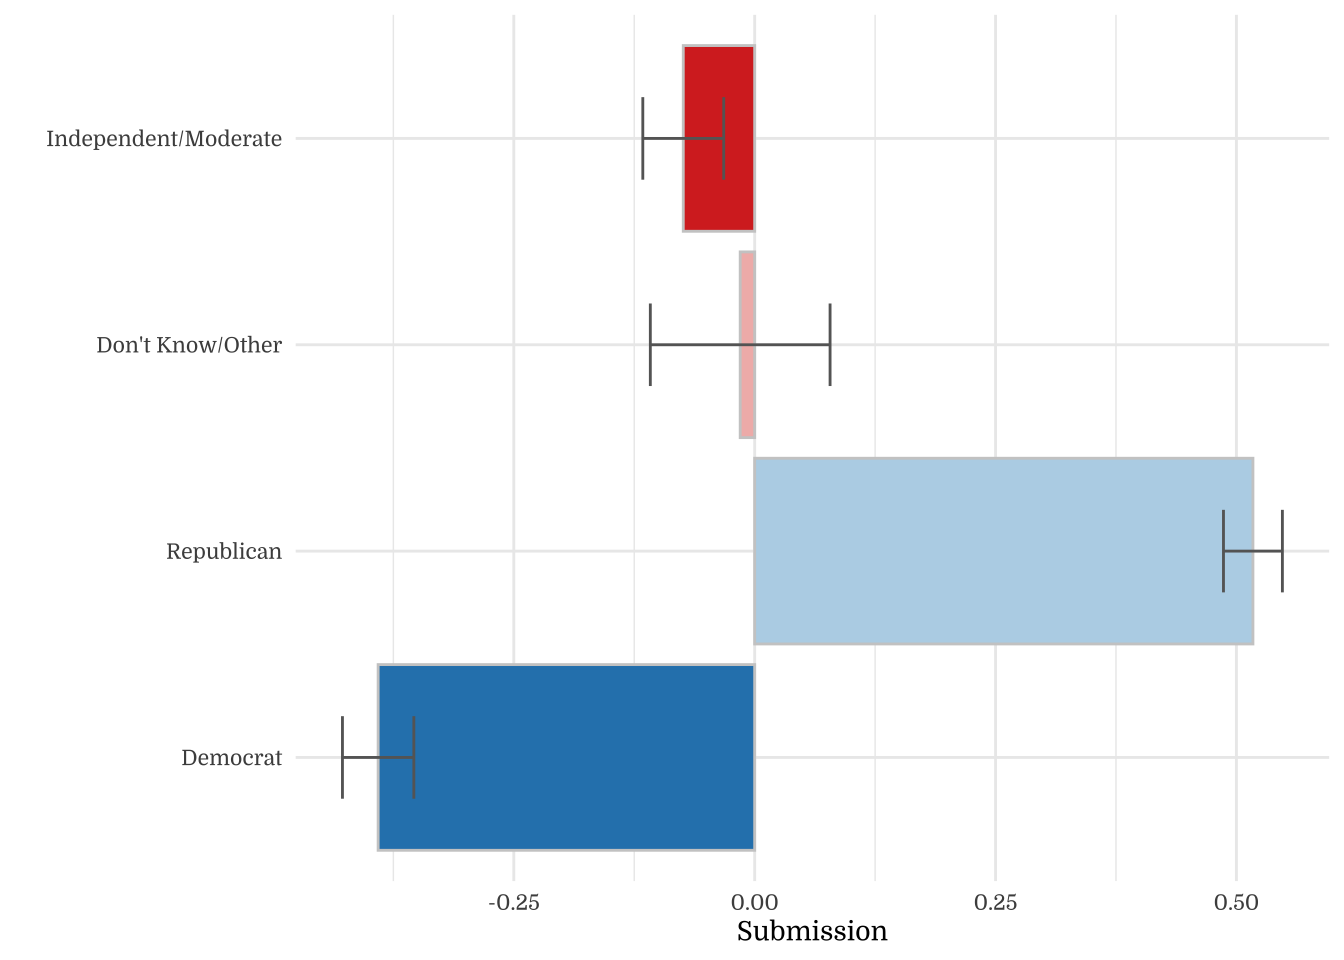
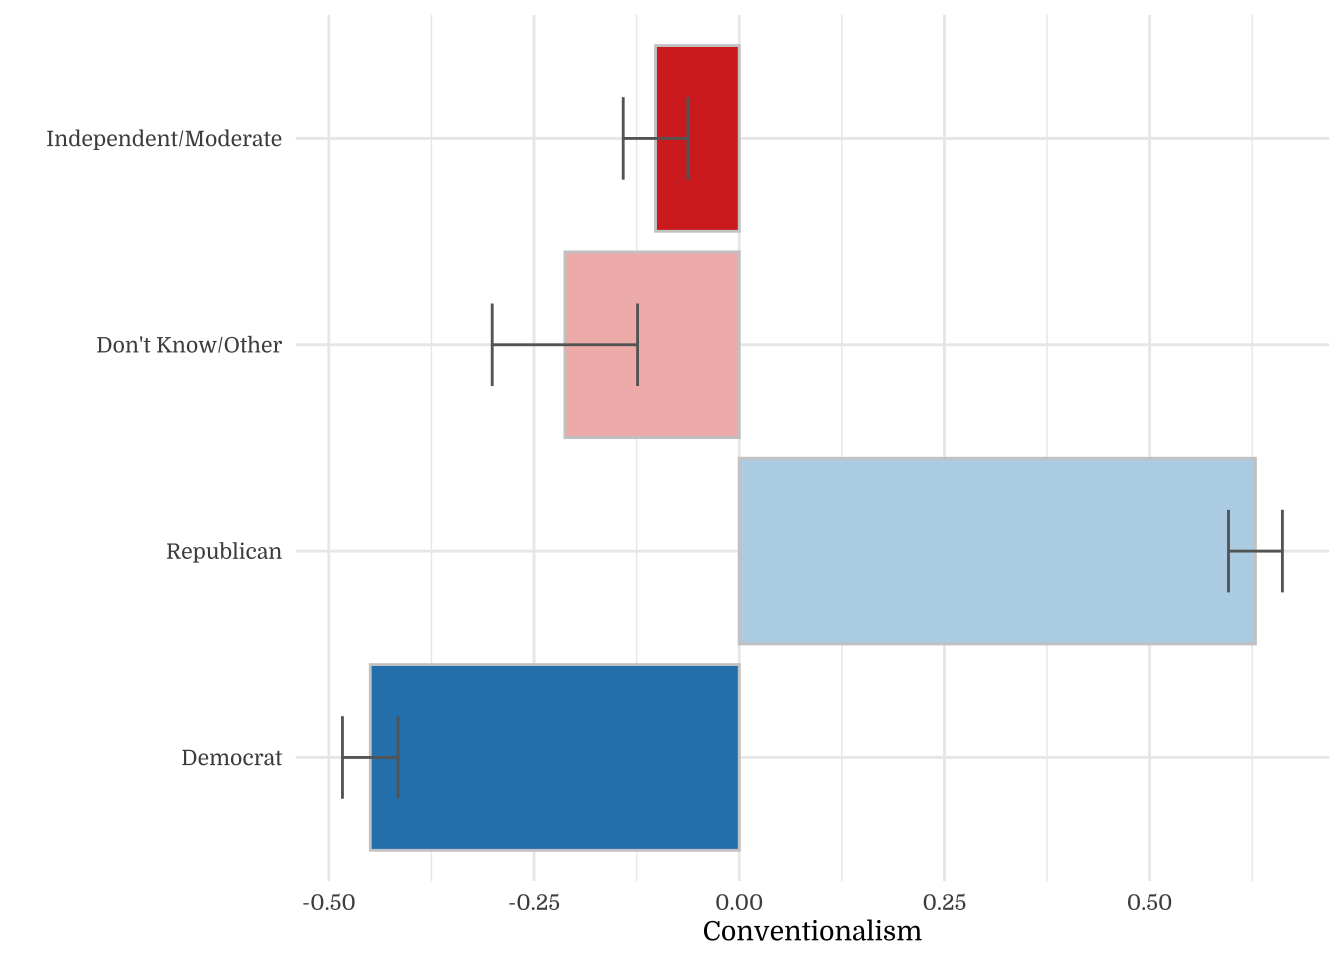
4.2 Partisanship
| Party Identity | N | Mean | SD |
|---|---|---|---|
| Democrat | 772 | 4.87 | 1.43 |
| Republican | 657 | 6.30 | 1.41 |
| Don't Know/Other | 72 | 5.49 | 1.10 |
| Independent/Moderate | 499 | 5.37 | 1.56 |
| Party Identity | N | Mean | SD |
|---|---|---|---|
| Democrat | 772 | 3.92 | 1.56 |
| Republican | 657 | 5.30 | 1.19 |
| Don't Know/Other | 72 | 4.49 | 1.20 |
| Independent/Moderate | 499 | 4.40 | 1.42 |
| Party Identity | N | Mean | SD |
|---|---|---|---|
| Democrat | 772 | 4.16 | 1.75 |
| Republican | 657 | 6.16 | 1.56 |
| Don't Know/Other | 72 | 4.60 | 1.39 |
| Independent/Moderate | 499 | 4.80 | 1.63 |
| Right-Wing Authoritarianism | |||
|---|---|---|---|
| Predictors | Estimates | CI | p |
| (Intercept) | 3.51 | 3.37 – 3.66 | <.001 |
| Party Identity (7-point) | 0.40 | 0.37 – 0.43 | <.001 |
| Observations | 1429 | ||
| R2 / R2 adjusted | .289 / .289 | ||
| Aggression | |||
|---|---|---|---|
| Predictors | Estimates | CI | p |
| (Intercept) | 4.15 | 3.99 – 4.31 | <.001 |
| Party Identity (7-point) | 0.36 | 0.32 – 0.39 | <.001 |
| Observations | 1429 | ||
| R2 / R2 adjusted | .202 / .201 | ||
| Submission | |||
|---|---|---|---|
| Predictors | Estimates | CI | p |
| (Intercept) | 3.23 | 3.07 – 3.39 | <.001 |
| Party Identity (7-point) | 0.34 | 0.31 – 0.38 | <.001 |
| Observations | 1429 | ||
| R2 / R2 adjusted | .193 / .193 | ||
| Conventionalism | |||
|---|---|---|---|
| Predictors | Estimates | CI | p |
| (Intercept) | 3.16 | 2.97 – 3.34 | <.001 |
| Party Identity (7-point) | 0.50 | 0.46 – 0.54 | <.001 |
| Observations | 1429 | ||
| R2 / R2 adjusted | .264 / .264 | ||
| Right-Wing Authoritarianism | |||
|---|---|---|---|
| Predictors | Estimates | CI | p |
| (Intercept) | 3.55 | 3.26 – 3.84 | <.001 |
| Party Identity (7-point) | 0.39 | 0.36 – 0.42 | <.001 |
| Age | 0.15 | 0.11 – 0.19 | <.001 |
| Income | -0.04 | -0.07 – -0.00 | .036 |
| Education | -0.22 | -0.30 – -0.13 | <.001 |
| Gender (Male) | 0.03 | -0.10 – 0.16 | .615 |
| Observations | 1429 | ||
| R2 / R2 adjusted | .335 / .333 | ||
| Aggression | |||
|---|---|---|---|
| Predictors | Estimates | CI | p |
| (Intercept) | 4.38 | 4.04 – 4.71 | <.001 |
| Party Identity (7-point) | 0.35 | 0.31 – 0.39 | <.001 |
| Age | 0.11 | 0.06 – 0.15 | <.001 |
| Income | 0.01 | -0.02 – 0.05 | .501 |
| Education | -0.30 | -0.40 – -0.21 | <.001 |
| Gender (Male) | -0.03 | -0.18 – 0.11 | .654 |
| Observations | 1429 | ||
| R2 / R2 adjusted | .237 / .234 | ||
| Submission | |||
|---|---|---|---|
| Predictors | Estimates | CI | p |
| (Intercept) | 3.28 | 2.95 – 3.61 | <.001 |
| Party Identity (7-point) | 0.34 | 0.30 – 0.38 | <.001 |
| Age | 0.10 | 0.06 – 0.14 | <.001 |
| Income | -0.04 | -0.08 – -0.00 | .039 |
| Education | -0.18 | -0.28 – -0.09 | <.001 |
| Gender (Male) | 0.10 | -0.04 – 0.25 | .161 |
| Observations | 1429 | ||
| R2 / R2 adjusted | .219 / .217 | ||
| Conventionalism | |||
|---|---|---|---|
| Predictors | Estimates | CI | p |
| (Intercept) | 2.99 | 2.61 – 3.38 | <.001 |
| Party Identity (7-point) | 0.48 | 0.44 – 0.53 | <.001 |
| Age | 0.24 | 0.19 – 0.29 | <.001 |
| Income | -0.08 | -0.12 – -0.04 | <.001 |
| Education | -0.16 | -0.28 – -0.05 | .004 |
| Gender (Male) | 0.03 | -0.14 – 0.20 | .749 |
| Observations | 1429 | ||
| R2 / R2 adjusted | .319 / .316 | ||
4.3 Religiosity
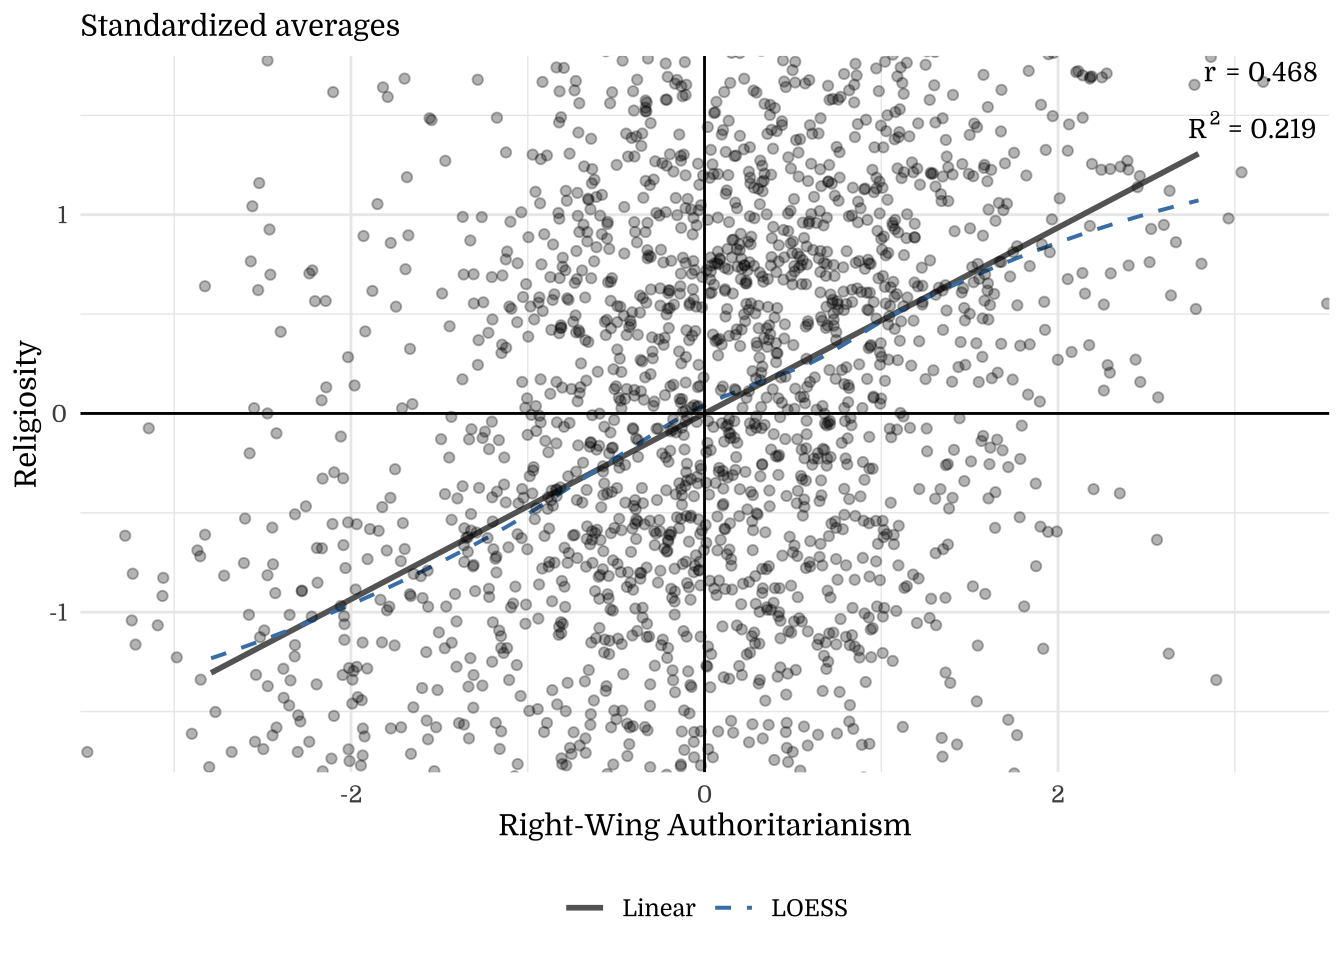
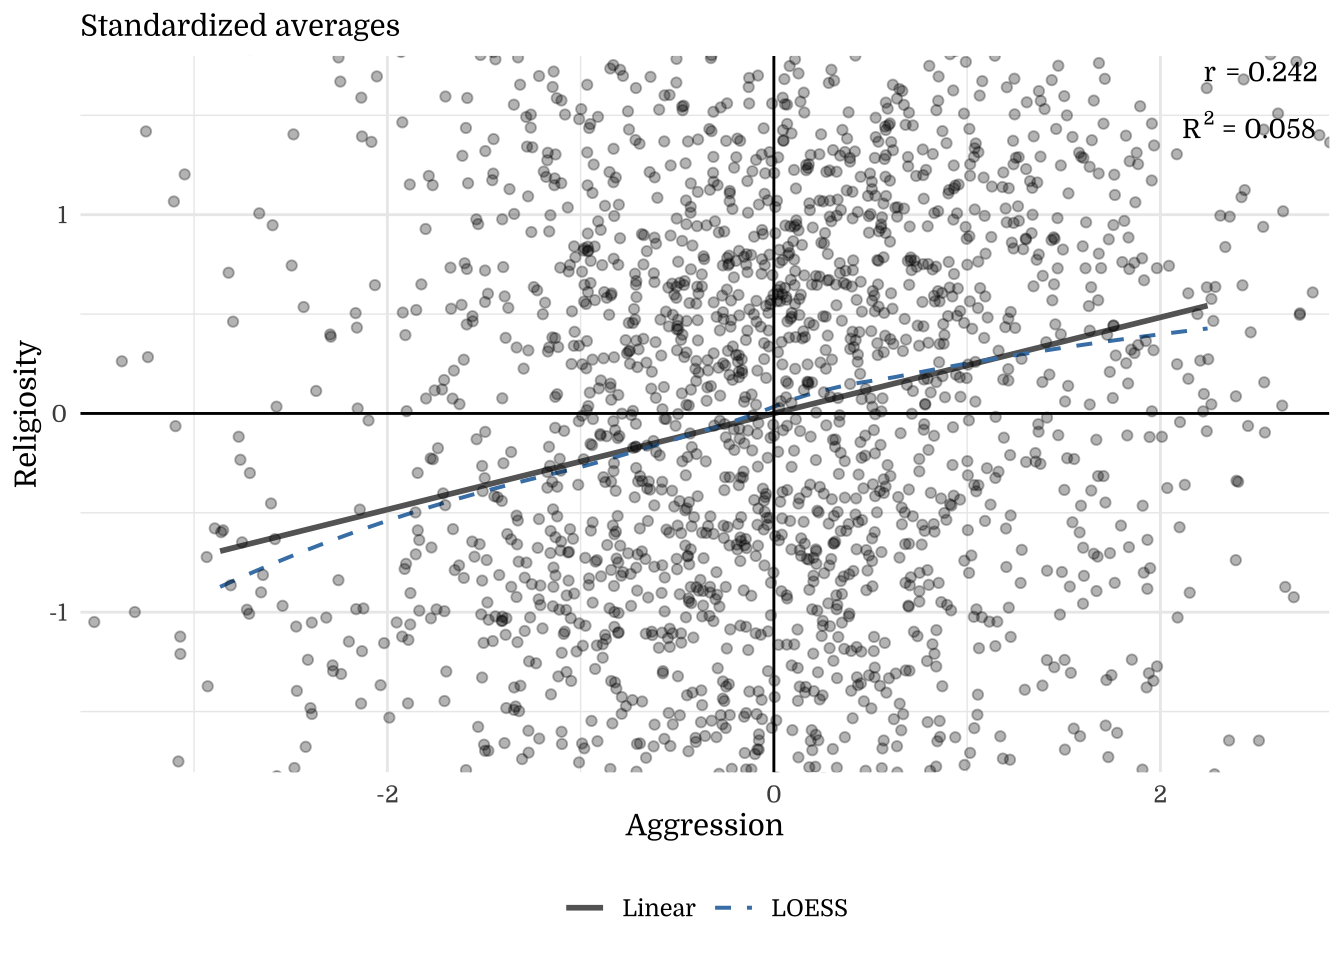
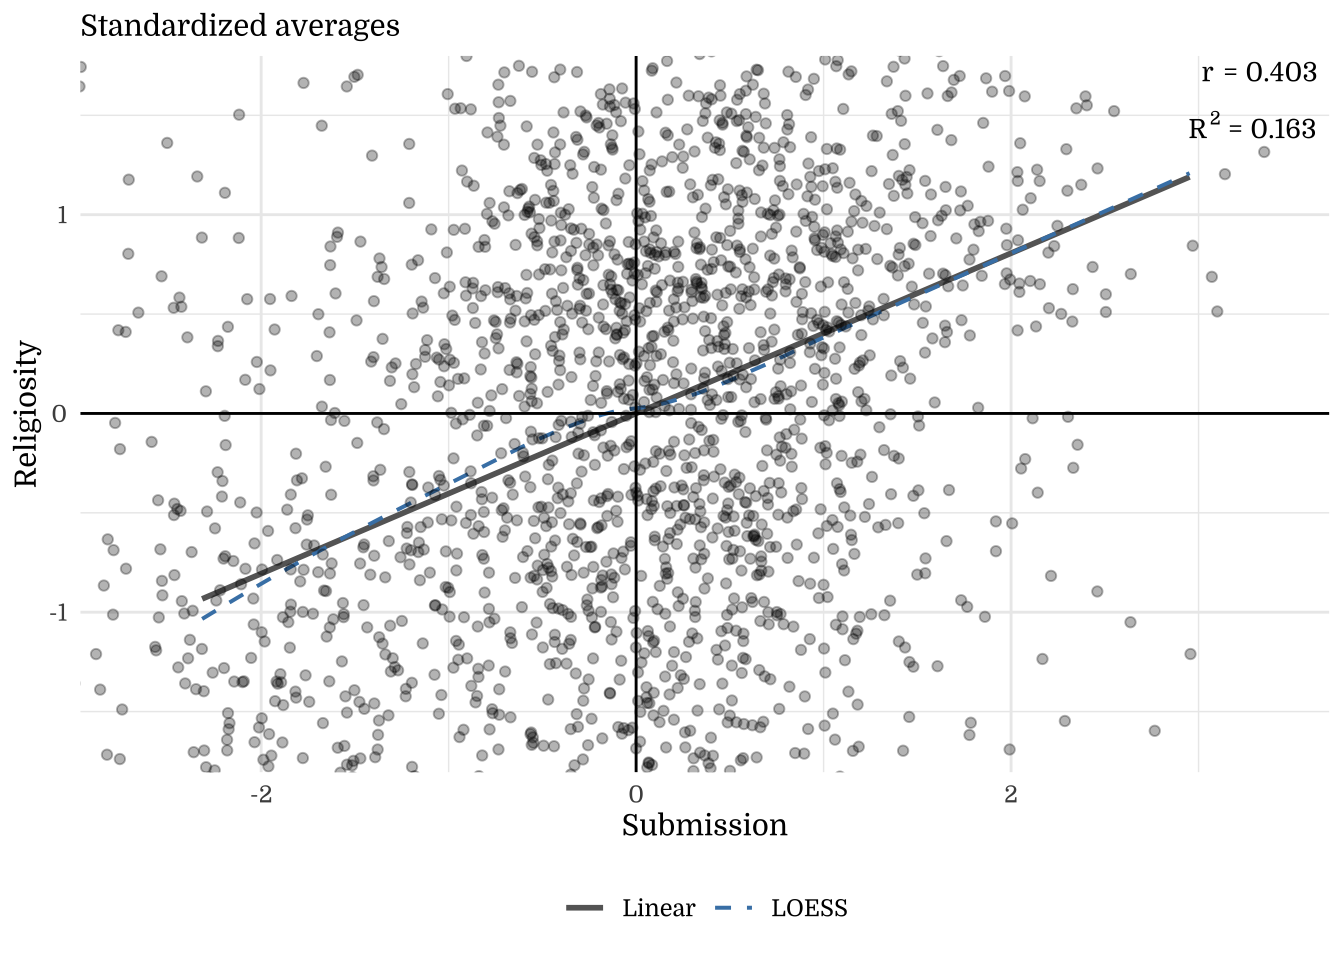
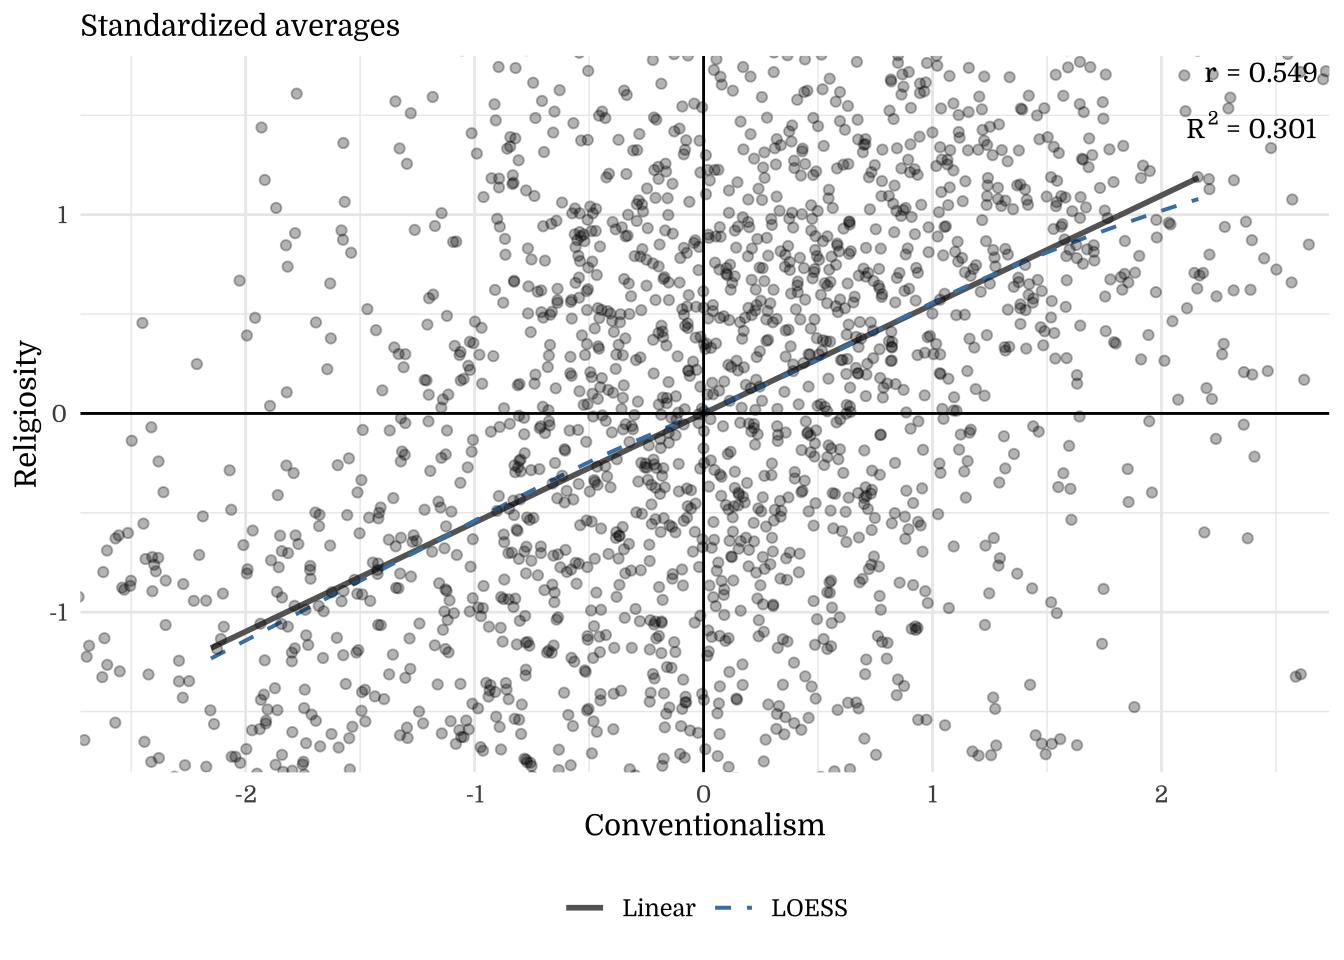
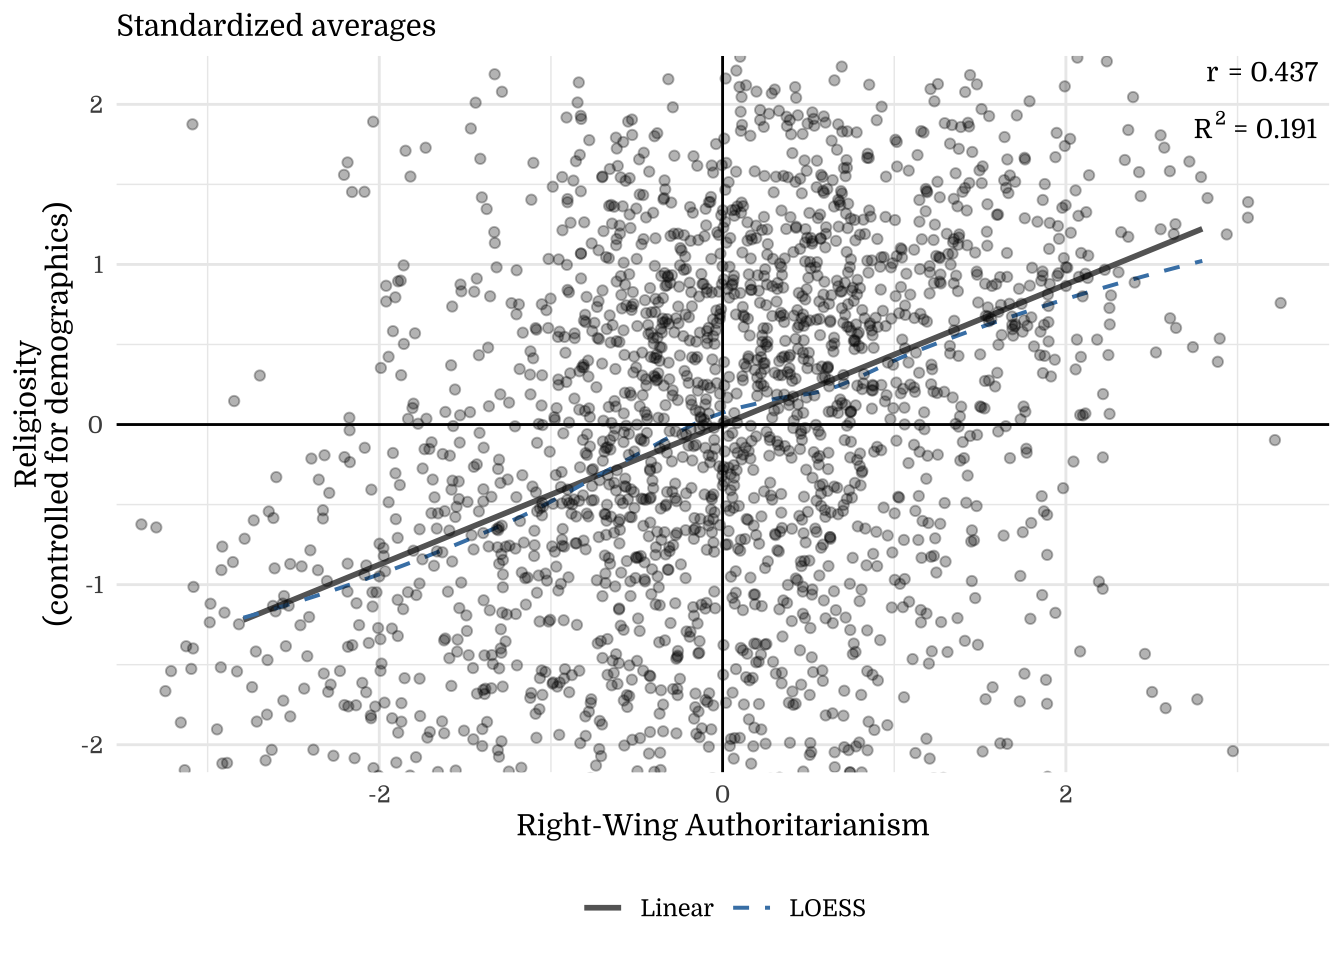
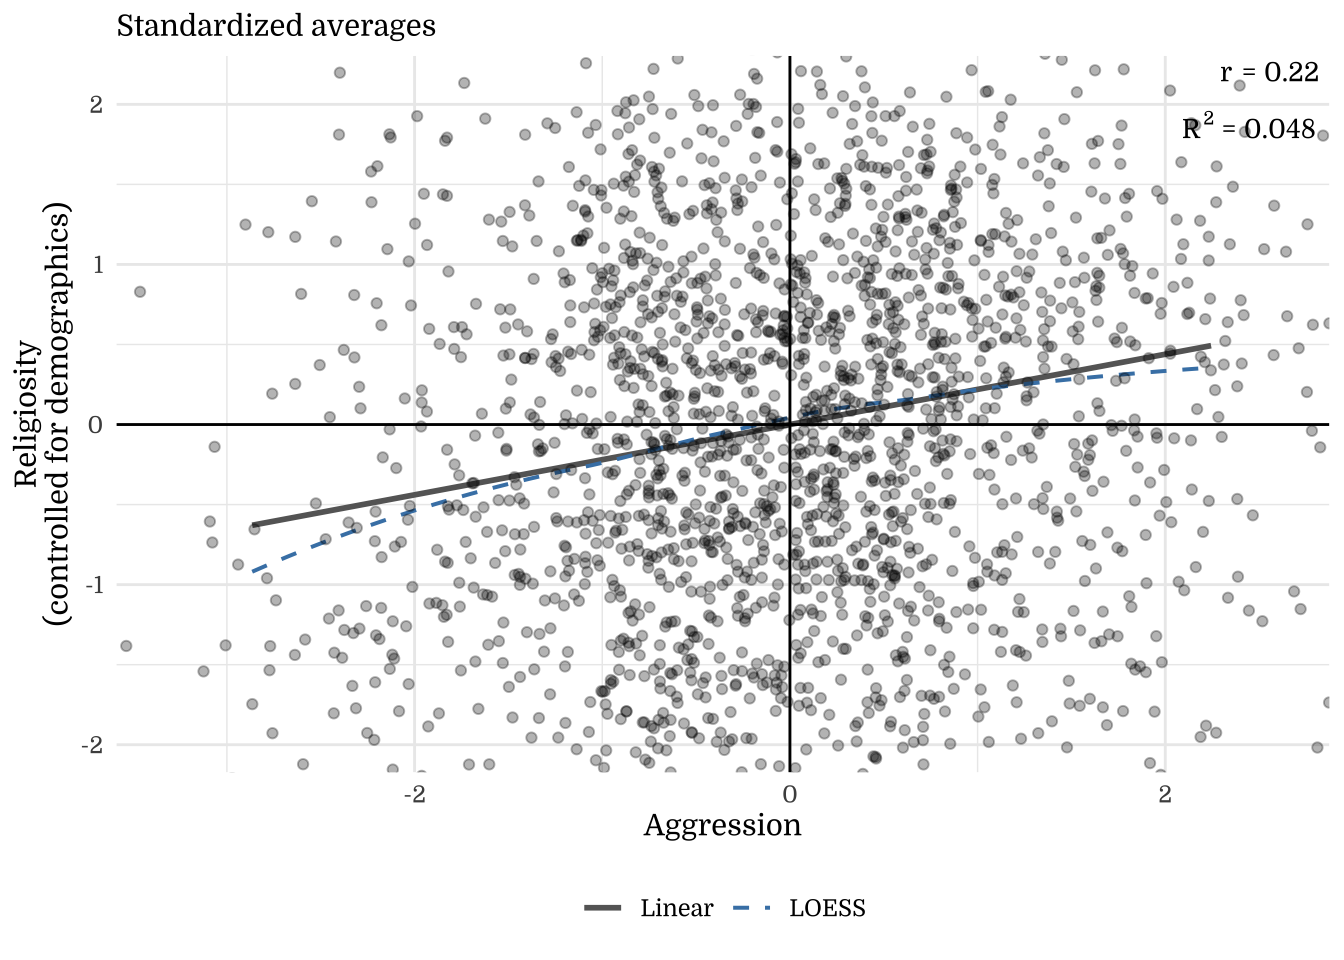
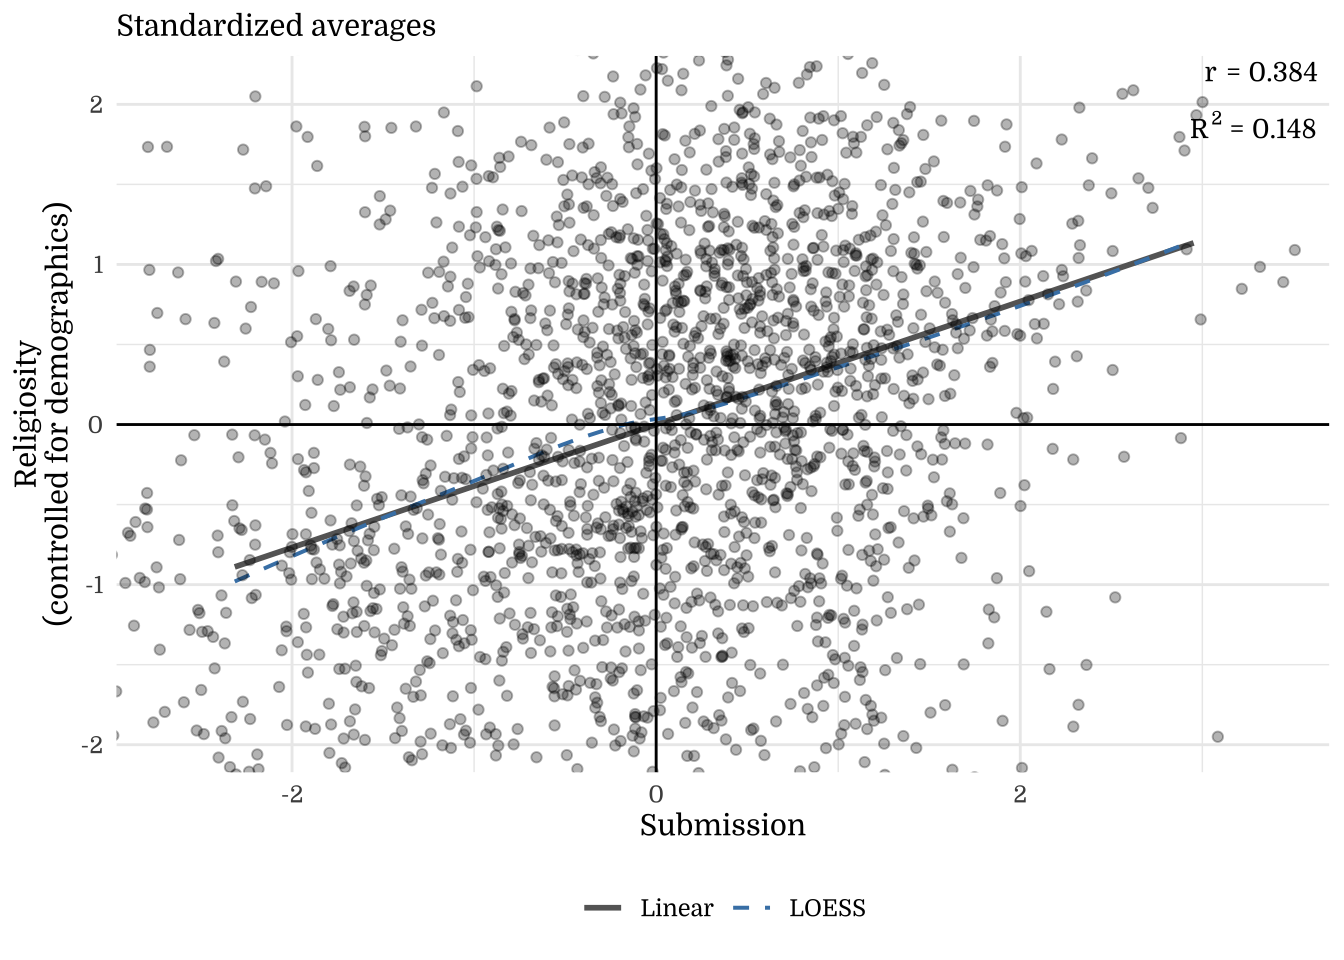
Note. The y-axis shows residuals after regressing the outcome on demographics (Age, Income, Education, Gender). This illustrates how much the focal construct explains beyond demographic factors.
4.4 Candidate Preferences
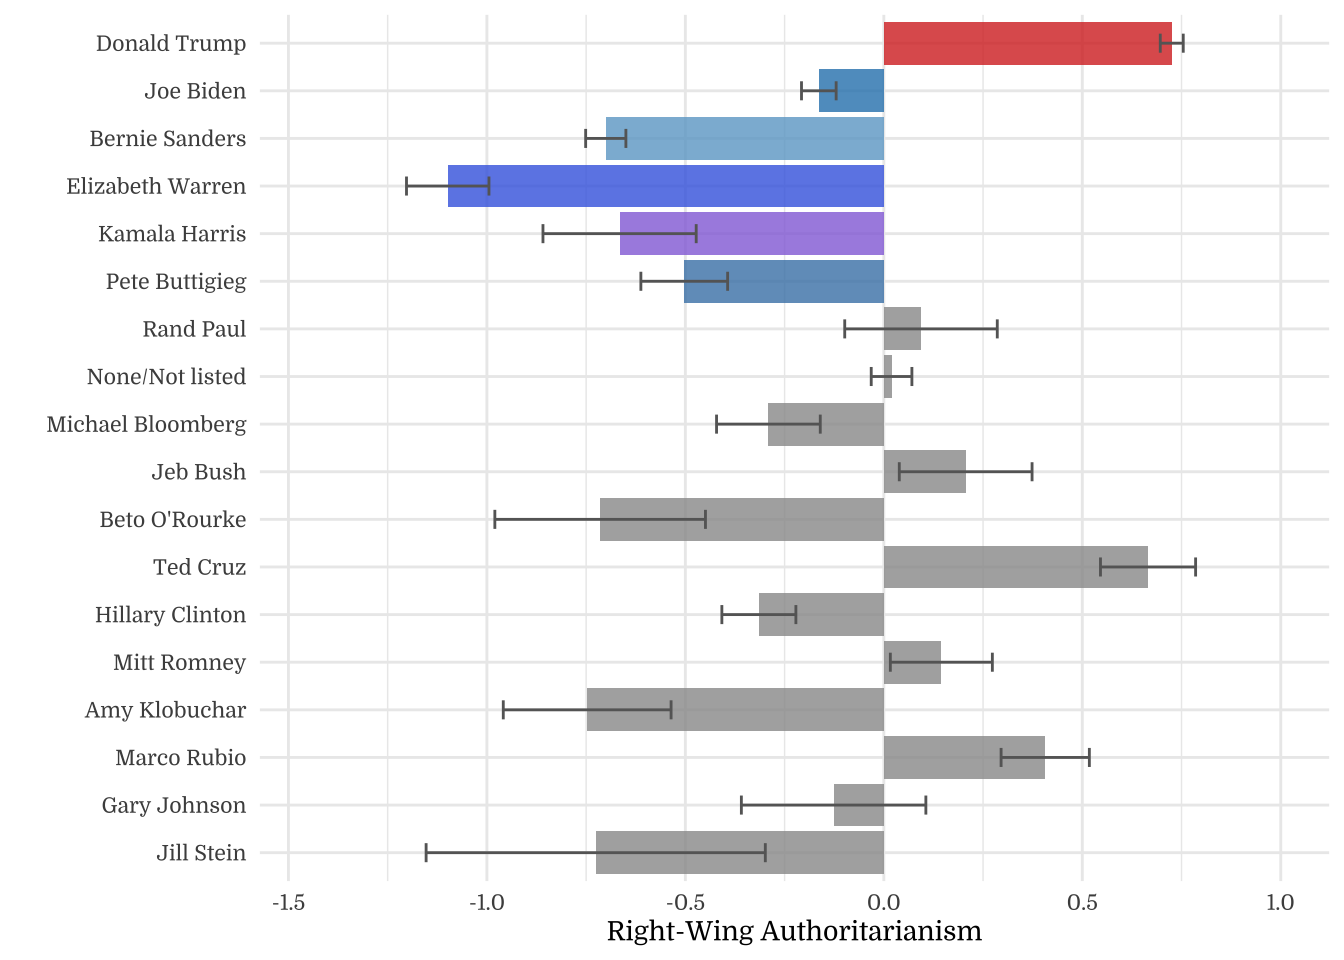
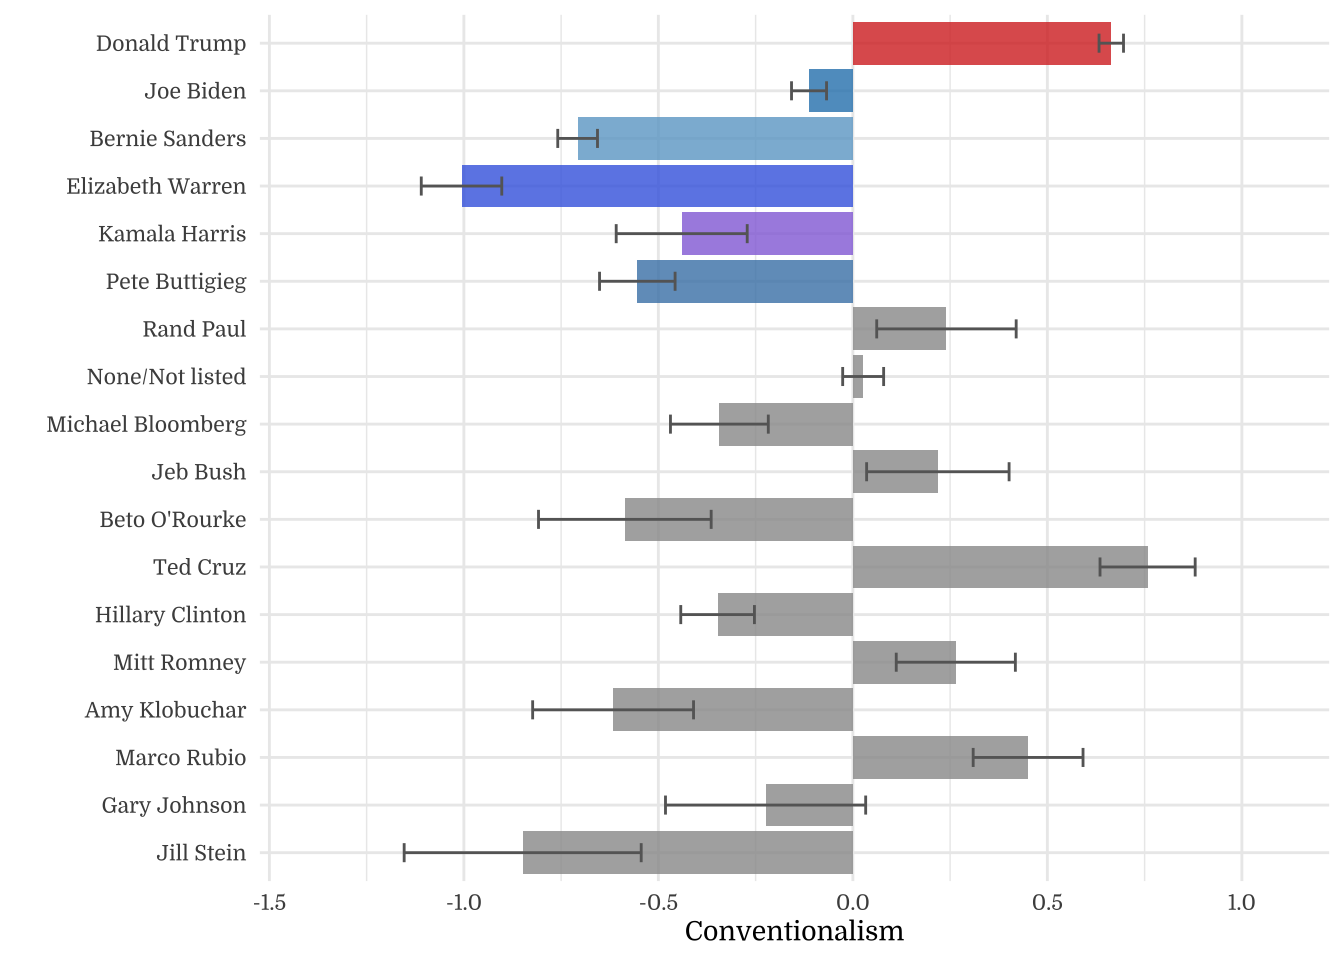
| Candidate Preference | N | Mean | SD |
|---|---|---|---|
| Donald Trump | 614 | 0.63 | 0.88 |
| Joe Biden | 326 | -0.28 | 0.85 |
| Bernie Sanders | 326 | -0.48 | 0.89 |
| Elizabeth Warren | 86 | -0.82 | 0.95 |
| Kamala Harris | 30 | -0.79 | 0.98 |
| Pete Buttigieg | 75 | -0.31 | 1.14 |
| Rand Paul | 24 | 0.06 | 1.10 |
| None/Not listed | 217 | -0.03 | 0.77 |
| Michael Bloomberg | 43 | -0.19 | 0.82 |
| Jeb Bush | 29 | 0.26 | 0.92 |
| Beto O'Rourke | 13 | -0.84 | 0.92 |
| Ted Cruz | 46 | 0.50 | 0.73 |
| Hillary Clinton | 78 | -0.26 | 0.81 |
| Mitt Romney | 28 | -0.04 | 0.89 |
| Amy Klobuchar | 23 | -0.68 | 0.85 |
| Marco Rubio | 26 | 0.37 | 0.67 |
| Gary Johnson | 10 | 0.18 | 0.92 |
| Jill Stein | 6 | -0.20 | 1.18 |
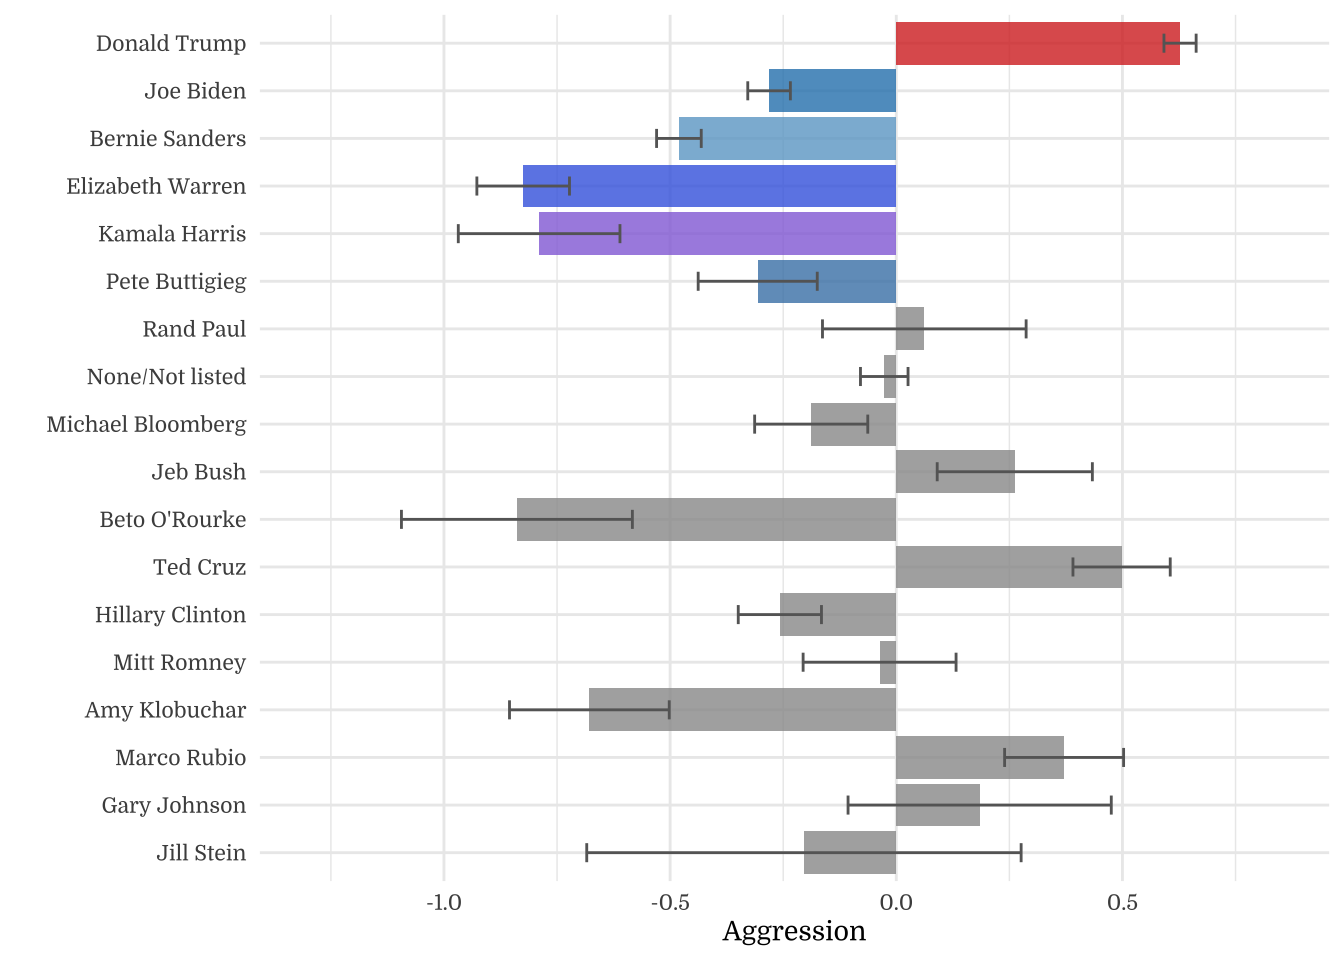
| Candidate Preference | N | Mean | SD |
|---|---|---|---|
| Donald Trump | 614 | 0.59 | 0.70 |
| Joe Biden | 326 | -0.04 | 0.86 |
| Bernie Sanders | 326 | -0.62 | 1.06 |
| Elizabeth Warren | 86 | -1.03 | 1.00 |
| Kamala Harris | 30 | -0.53 | 1.17 |
| Pete Buttigieg | 75 | -0.43 | 0.89 |
| Rand Paul | 24 | -0.09 | 0.92 |
| None/Not listed | 217 | 0.05 | 0.83 |
| Michael Bloomberg | 43 | -0.21 | 0.92 |
| Jeb Bush | 29 | 0.05 | 0.92 |
| Beto O'Rourke | 13 | -0.44 | 1.16 |
| Ted Cruz | 46 | 0.44 | 0.92 |
| Hillary Clinton | 78 | -0.20 | 0.94 |
| Mitt Romney | 28 | 0.12 | 0.69 |
| Amy Klobuchar | 23 | -0.66 | 1.15 |
| Marco Rubio | 26 | 0.22 | 0.69 |
| Gary Johnson | 10 | -0.27 | 0.99 |
| Jill Stein | 6 | -0.81 | 0.92 |
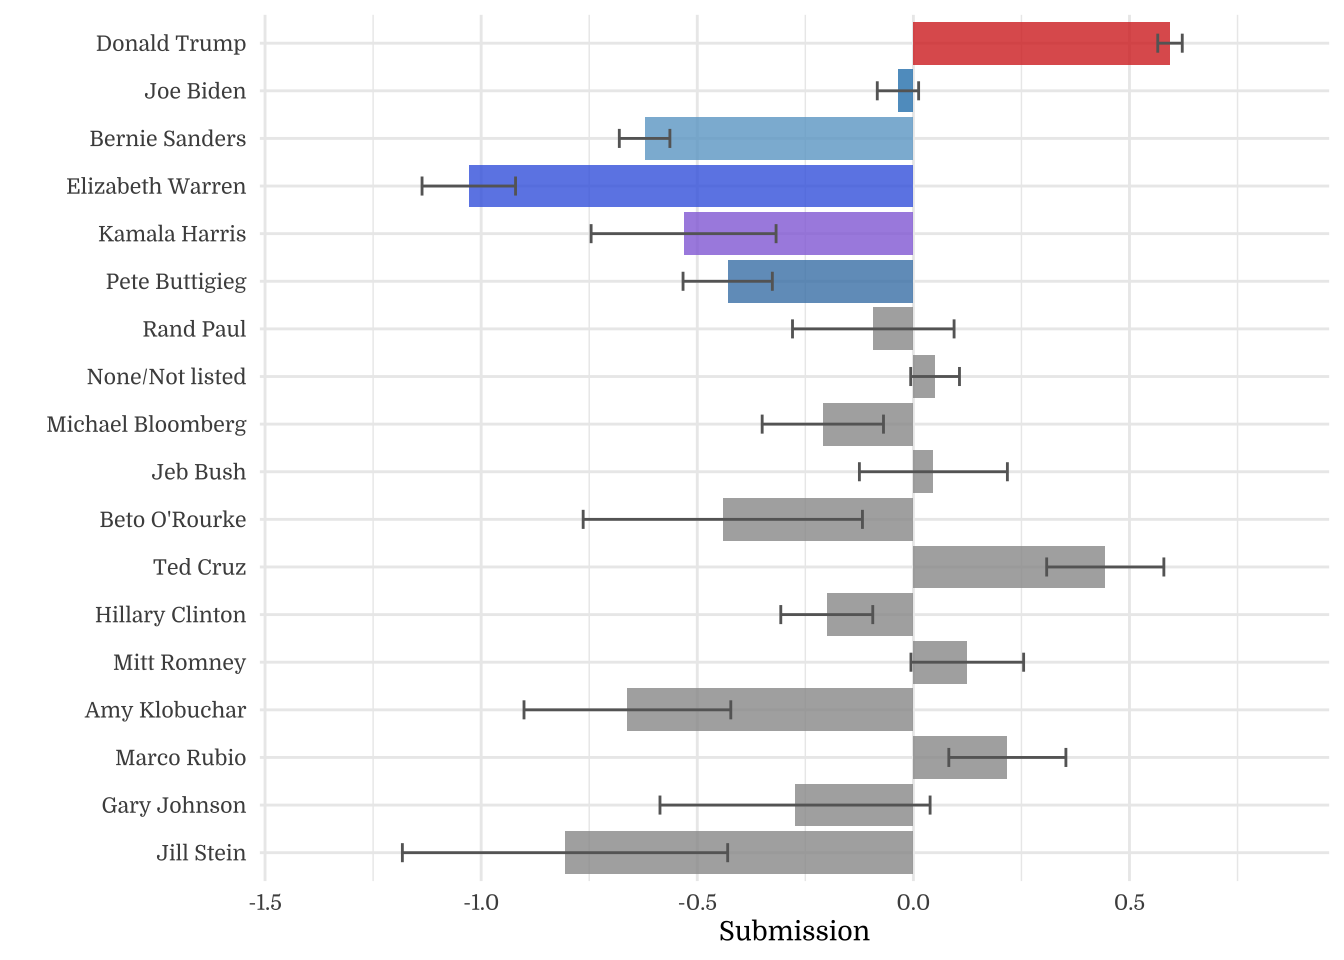
| Candidate Preference | N | Mean | SD |
|---|---|---|---|
| Donald Trump | 614 | 0.66 | 0.78 |
| Joe Biden | 326 | -0.11 | 0.81 |
| Bernie Sanders | 326 | -0.71 | 0.92 |
| Elizabeth Warren | 86 | -1.01 | 0.96 |
| Kamala Harris | 30 | -0.44 | 0.92 |
| Pete Buttigieg | 75 | -0.55 | 0.84 |
| Rand Paul | 24 | 0.24 | 0.88 |
| None/Not listed | 217 | 0.03 | 0.78 |
| Michael Bloomberg | 43 | -0.34 | 0.82 |
| Jeb Bush | 29 | 0.22 | 0.99 |
| Beto O'Rourke | 13 | -0.59 | 0.80 |
| Ted Cruz | 46 | 0.76 | 0.83 |
| Hillary Clinton | 78 | -0.35 | 0.84 |
| Mitt Romney | 28 | 0.26 | 0.81 |
| Amy Klobuchar | 23 | -0.62 | 0.99 |
| Marco Rubio | 26 | 0.45 | 0.72 |
| Gary Johnson | 10 | -0.22 | 0.81 |
| Jill Stein | 6 | -0.85 | 0.75 |
| Candidate Preference | N | Mean | SD |
|---|---|---|---|
| Donald Trump | 614 | 6.47 | 1.38 |
| Joe Biden | 326 | 5.05 | 1.33 |
| Bernie Sanders | 326 | 4.73 | 1.40 |
| Elizabeth Warren | 86 | 4.19 | 1.49 |
| Kamala Harris | 30 | 4.25 | 1.53 |
| Pete Buttigieg | 75 | 5.01 | 1.78 |
| Rand Paul | 24 | 5.58 | 1.73 |
| None/Not listed | 217 | 5.44 | 1.21 |
| Michael Bloomberg | 43 | 5.19 | 1.28 |
| Jeb Bush | 29 | 5.90 | 1.45 |
| Beto O'Rourke | 13 | 4.17 | 1.44 |
| Ted Cruz | 46 | 6.27 | 1.14 |
| Hillary Clinton | 78 | 5.08 | 1.27 |
| Mitt Romney | 28 | 5.43 | 1.40 |
| Amy Klobuchar | 23 | 4.42 | 1.33 |
| Marco Rubio | 26 | 6.07 | 1.05 |
| Gary Johnson | 10 | 5.78 | 1.44 |
| Jill Stein | 6 | 5.17 | 1.84 |
| Candidate Preference | N | Mean | SD |
|---|---|---|---|
| Donald Trump | 614 | 5.42 | 1.07 |
| Joe Biden | 326 | 4.46 | 1.31 |
| Bernie Sanders | 326 | 3.57 | 1.60 |
| Elizabeth Warren | 86 | 2.95 | 1.52 |
| Kamala Harris | 30 | 3.71 | 1.78 |
| Pete Buttigieg | 75 | 3.86 | 1.36 |
| Rand Paul | 24 | 4.38 | 1.39 |
| None/Not listed | 217 | 4.59 | 1.26 |
| Michael Bloomberg | 43 | 4.20 | 1.40 |
| Jeb Bush | 29 | 4.59 | 1.40 |
| Beto O'Rourke | 13 | 3.85 | 1.77 |
| Ted Cruz | 46 | 5.19 | 1.40 |
| Hillary Clinton | 78 | 4.21 | 1.43 |
| Mitt Romney | 28 | 4.71 | 1.05 |
| Amy Klobuchar | 23 | 3.51 | 1.74 |
| Marco Rubio | 26 | 4.85 | 1.05 |
| Gary Johnson | 10 | 4.10 | 1.50 |
| Jill Stein | 6 | 3.29 | 1.40 |
| Candidate Preference | N | Mean | SD |
|---|---|---|---|
| Donald Trump | 614 | 6.22 | 1.45 |
| Joe Biden | 326 | 4.78 | 1.51 |
| Bernie Sanders | 326 | 3.68 | 1.71 |
| Elizabeth Warren | 86 | 3.12 | 1.78 |
| Kamala Harris | 30 | 4.18 | 1.71 |
| Pete Buttigieg | 75 | 3.96 | 1.56 |
| Rand Paul | 24 | 5.44 | 1.63 |
| None/Not listed | 217 | 5.04 | 1.44 |
| Michael Bloomberg | 43 | 4.35 | 1.53 |
| Jeb Bush | 29 | 5.40 | 1.83 |
| Beto O'Rourke | 13 | 3.90 | 1.48 |
| Ted Cruz | 46 | 6.40 | 1.54 |
| Hillary Clinton | 78 | 4.35 | 1.55 |
| Mitt Romney | 28 | 5.48 | 1.50 |
| Amy Klobuchar | 23 | 3.85 | 1.84 |
| Marco Rubio | 26 | 5.83 | 1.34 |
| Gary Johnson | 10 | 4.58 | 1.51 |
| Jill Stein | 6 | 3.42 | 1.38 |
4.5 Party Preferences
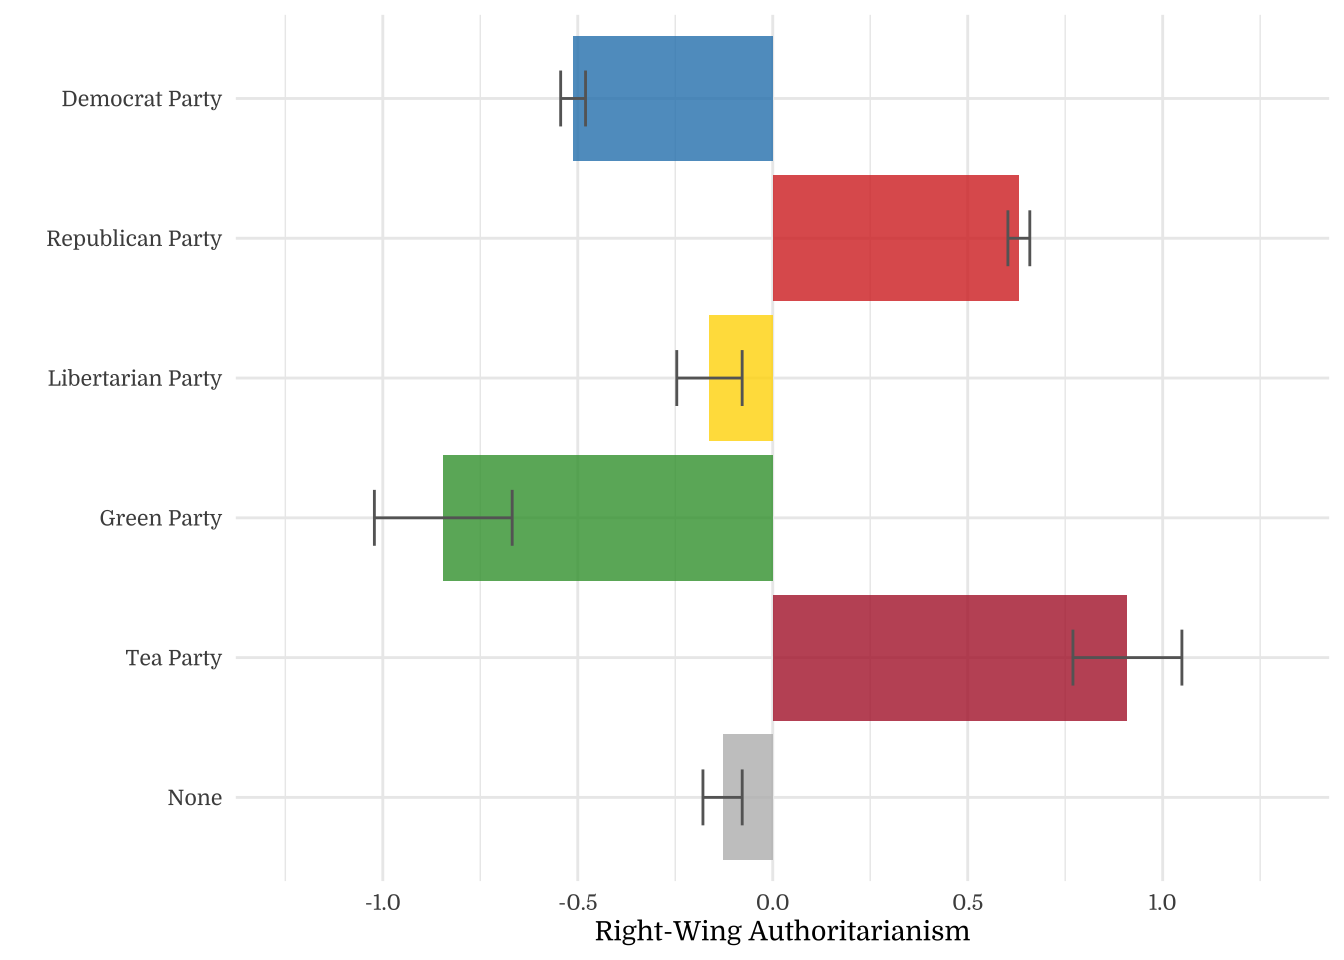
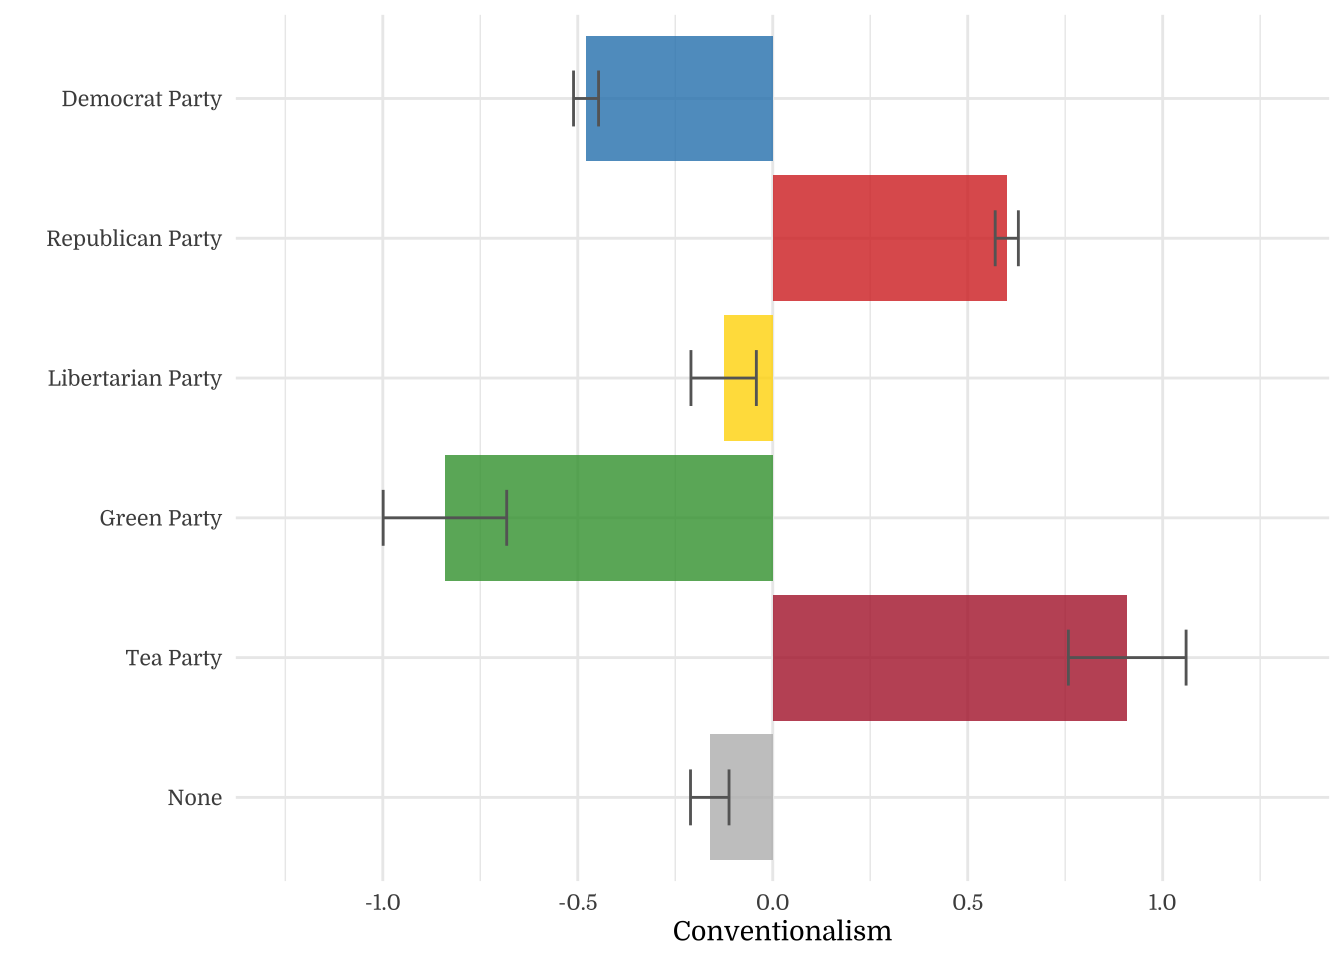
| Party Preference | N | Mean | SD |
|---|---|---|---|
| Democrat Party | 841 | -0.43 | 0.91 |
| Republican Party | 736 | 0.51 | 0.89 |
| Libertarian Party | 97 | -0.10 | 1.01 |
| Green Party | 22 | -0.73 | 0.83 |
| Tea Party | 38 | 0.83 | 0.89 |
| None | 266 | -0.09 | 0.86 |
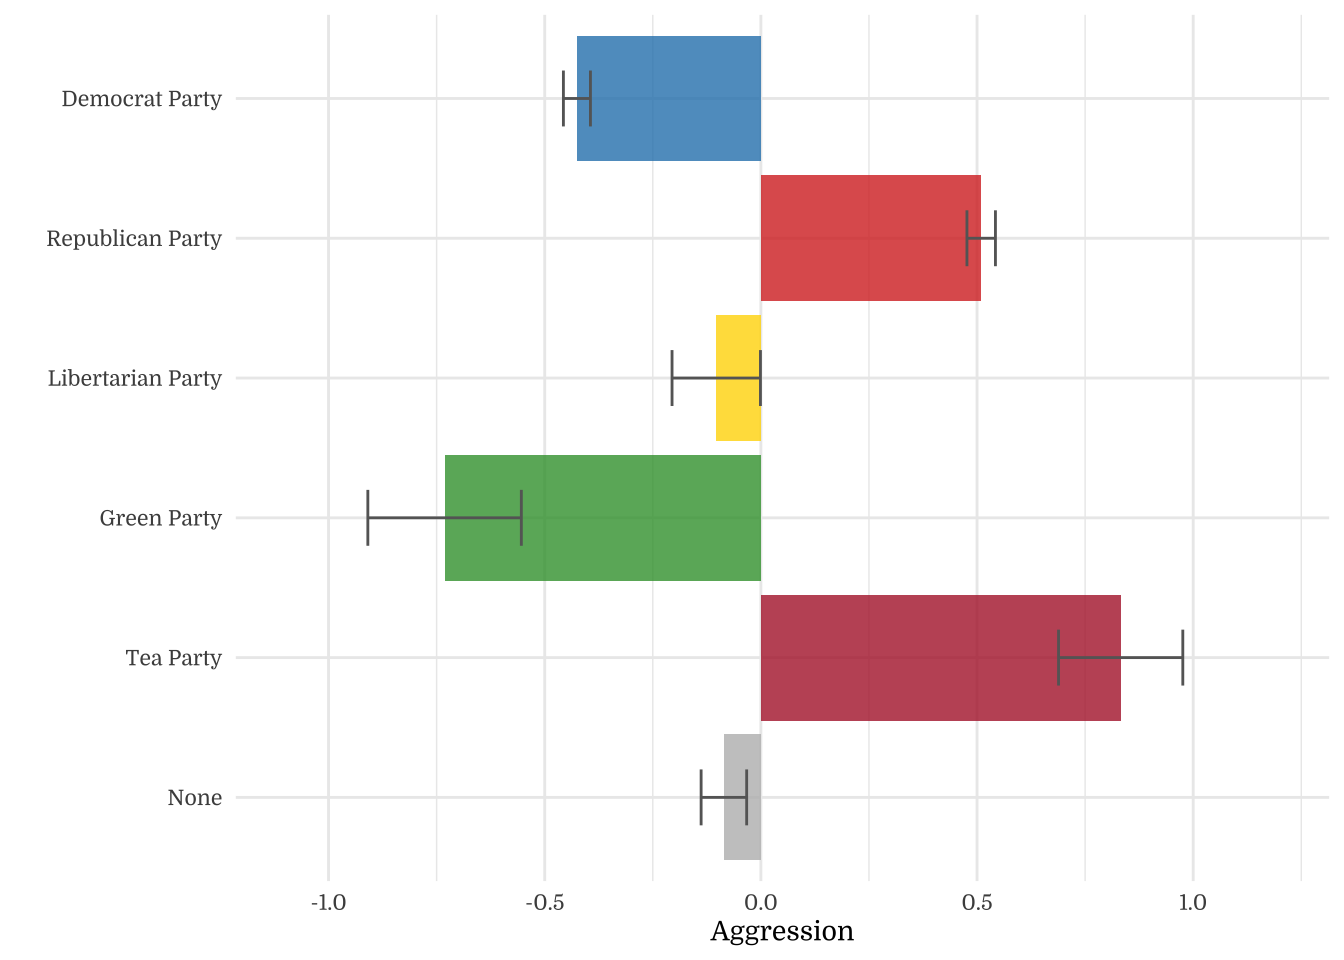
| Party Preference | N | Mean | SD |
|---|---|---|---|
| Democrat Party | 841 | -0.42 | 1.02 |
| Republican Party | 736 | 0.53 | 0.74 |
| Libertarian Party | 97 | -0.20 | 0.93 |
| Green Party | 22 | -0.61 | 1.04 |
| Tea Party | 38 | 0.60 | 0.89 |
| None | 266 | -0.08 | 0.85 |
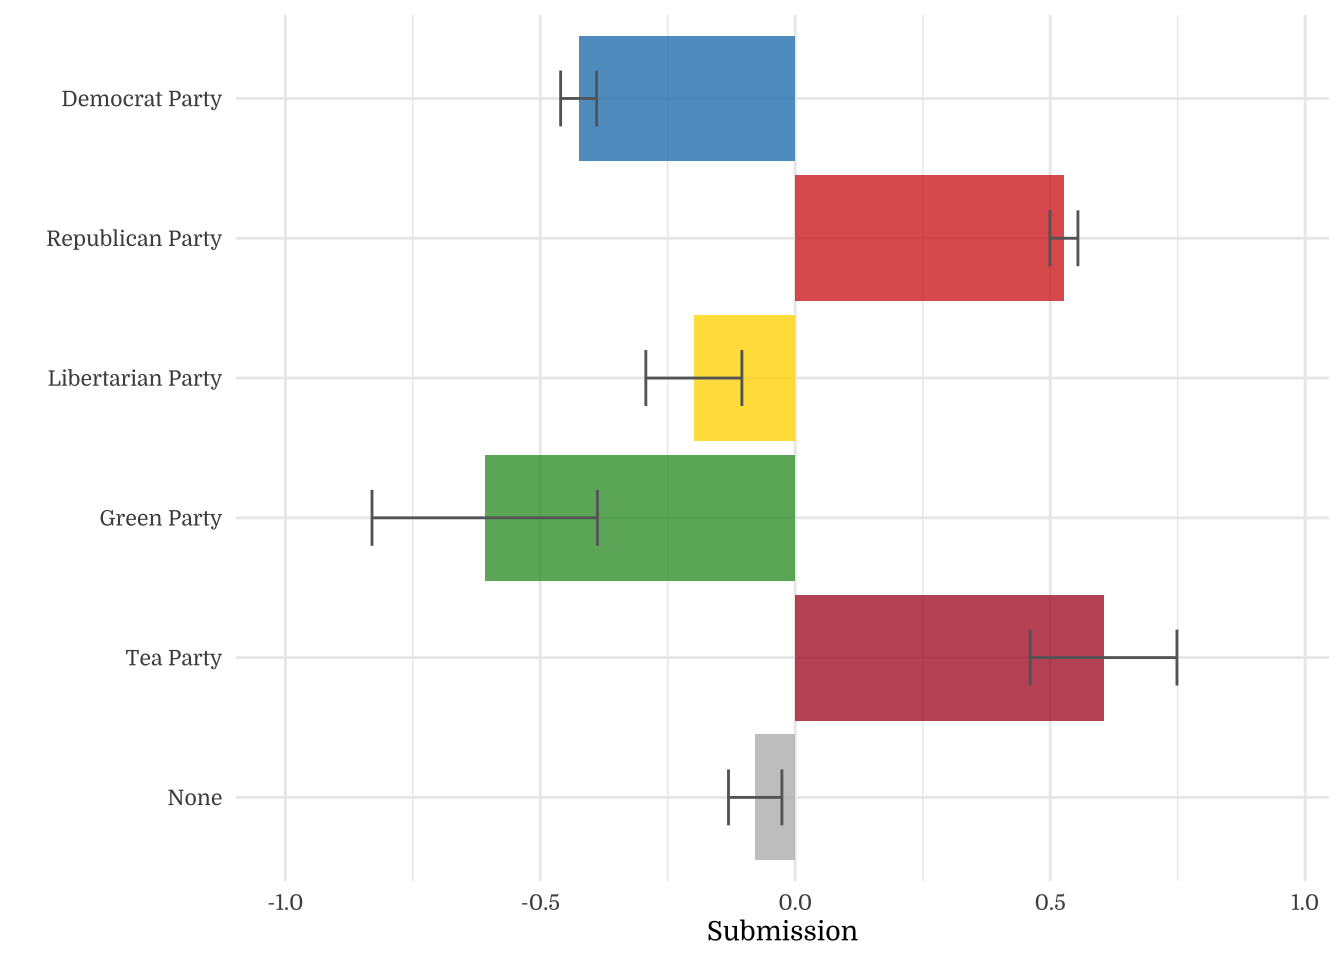
| Party Preference | N | Mean | SD |
|---|---|---|---|
| Democrat Party | 841 | -0.48 | 0.93 |
| Republican Party | 736 | 0.60 | 0.81 |
| Libertarian Party | 97 | -0.13 | 0.83 |
| Green Party | 22 | -0.84 | 0.74 |
| Tea Party | 38 | 0.91 | 0.93 |
| None | 266 | -0.16 | 0.81 |
| Party Preference | N | Mean | SD |
|---|---|---|---|
| Democrat Party | 841 | 4.82 | 1.42 |
| Republican Party | 736 | 6.28 | 1.40 |
| Libertarian Party | 97 | 5.32 | 1.58 |
| Green Party | 22 | 4.34 | 1.30 |
| Tea Party | 38 | 6.79 | 1.39 |
| None | 266 | 5.35 | 1.35 |
| Party Preference | N | Mean | SD |
|---|---|---|---|
| Democrat Party | 841 | 3.87 | 1.55 |
| Republican Party | 736 | 5.32 | 1.13 |
| Libertarian Party | 97 | 4.21 | 1.41 |
| Green Party | 22 | 3.59 | 1.57 |
| Tea Party | 38 | 5.43 | 1.35 |
| None | 266 | 4.40 | 1.30 |
| Party Preference | N | Mean | SD |
|---|---|---|---|
| Democrat Party | 841 | 4.10 | 1.73 |
| Republican Party | 736 | 6.10 | 1.50 |
| Libertarian Party | 97 | 4.76 | 1.53 |
| Green Party | 22 | 3.43 | 1.38 |
| Tea Party | 38 | 6.68 | 1.73 |
| None | 266 | 4.69 | 1.49 |
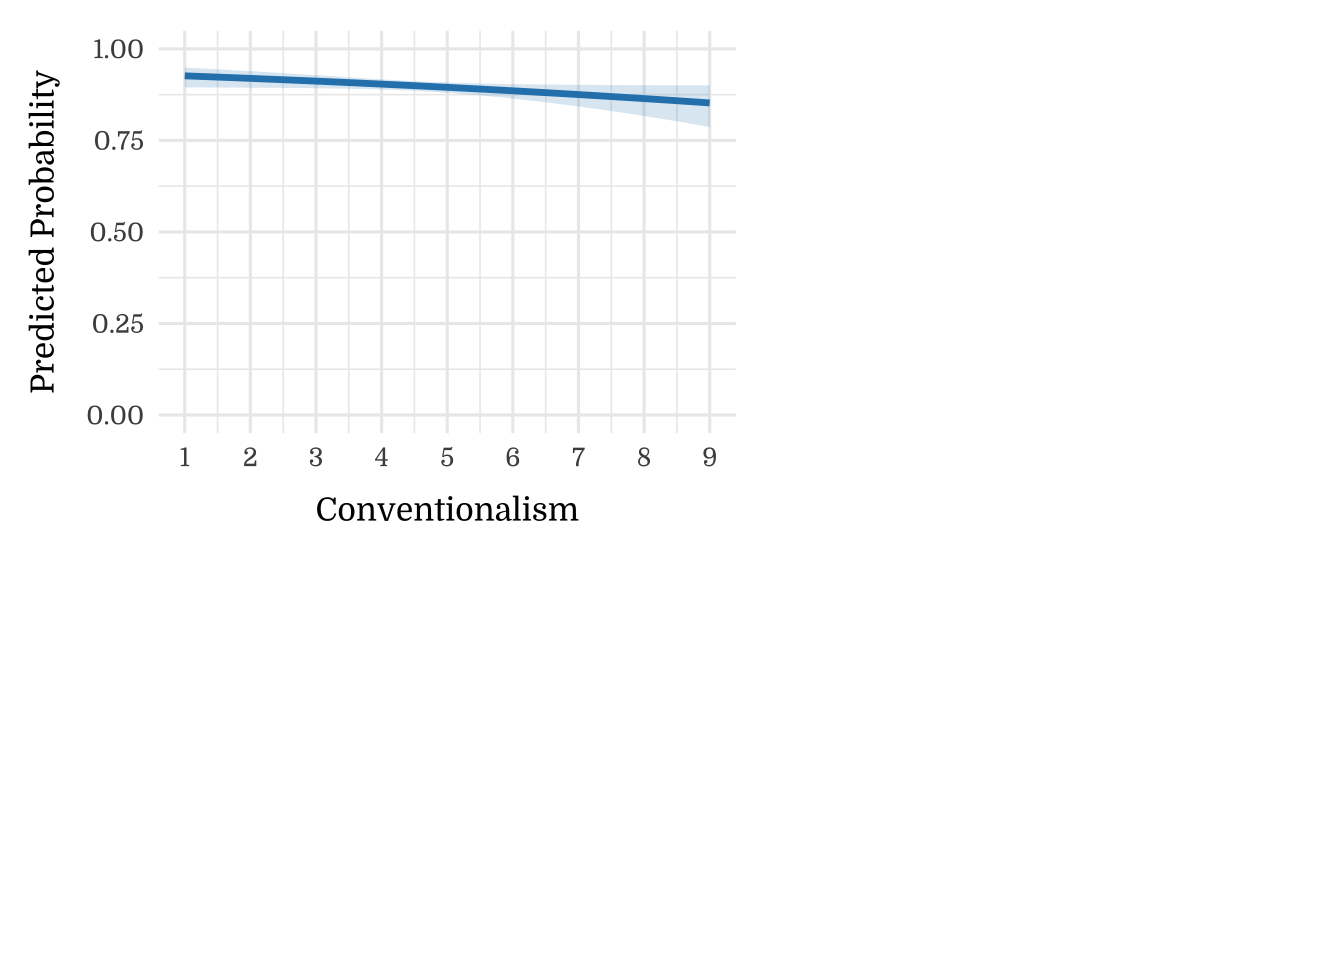
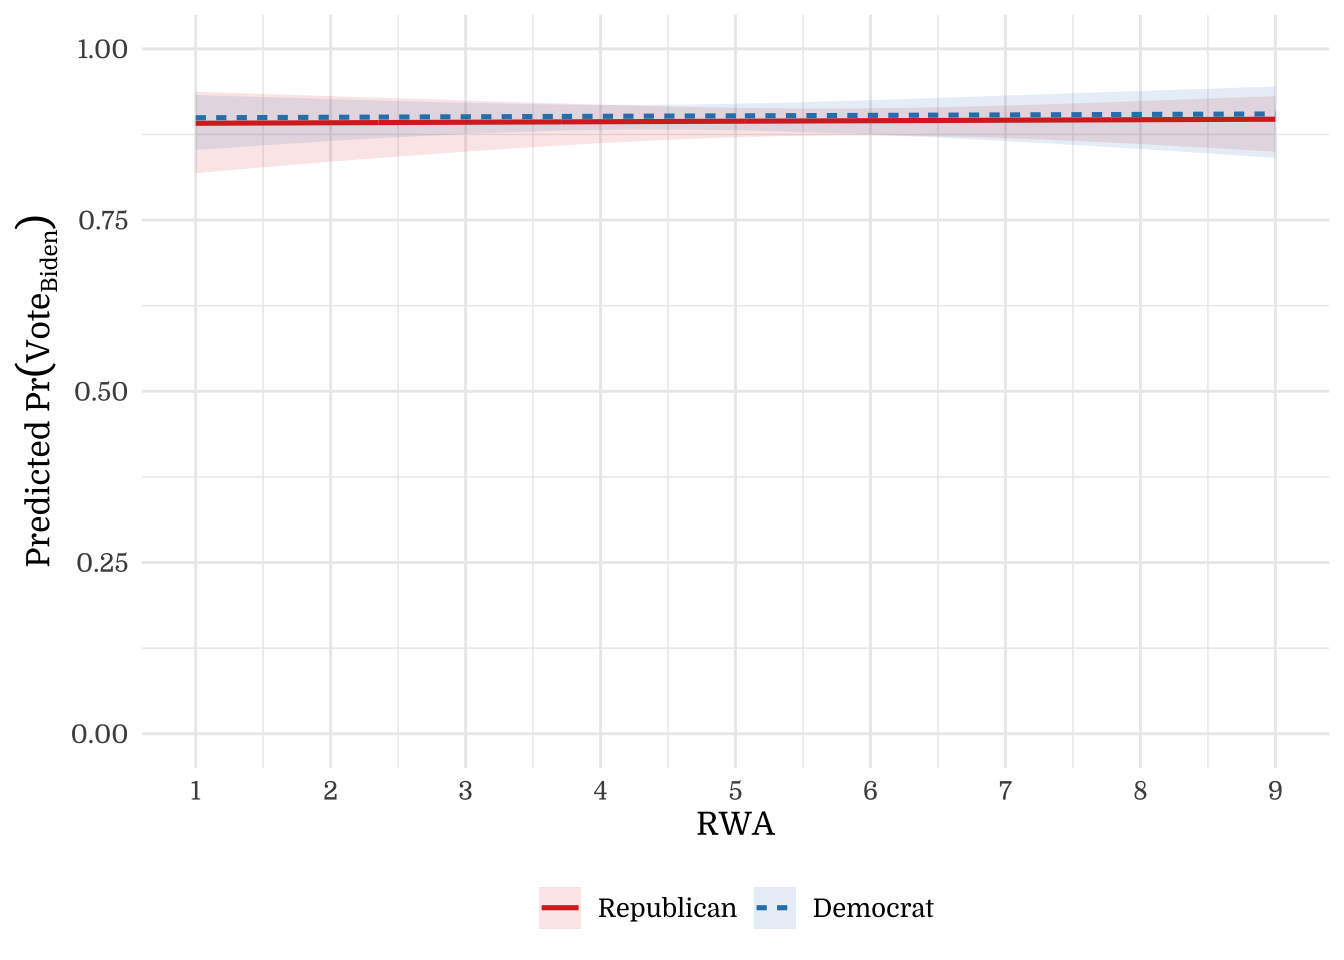
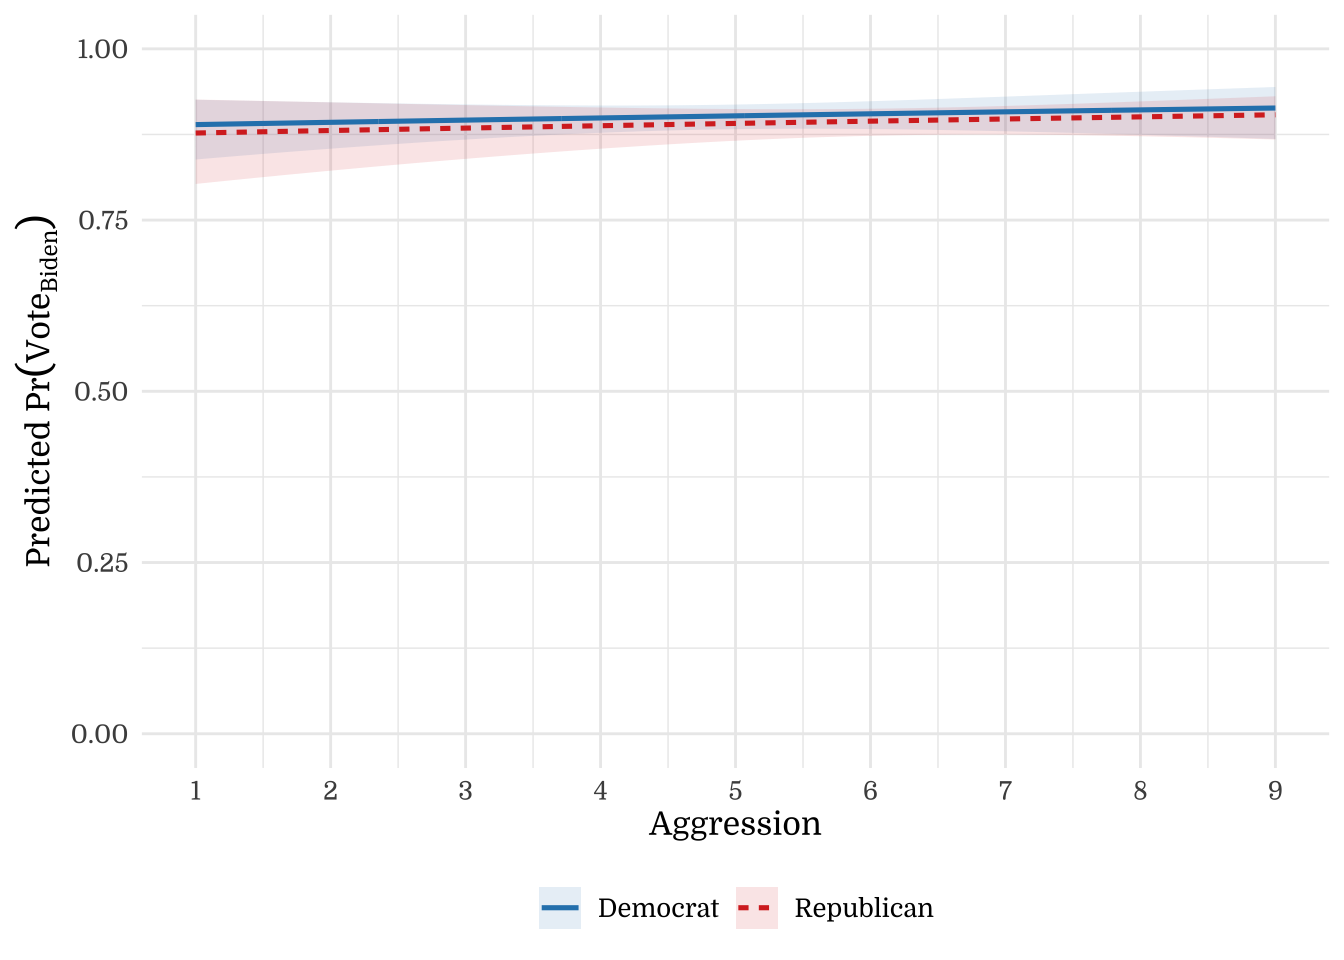
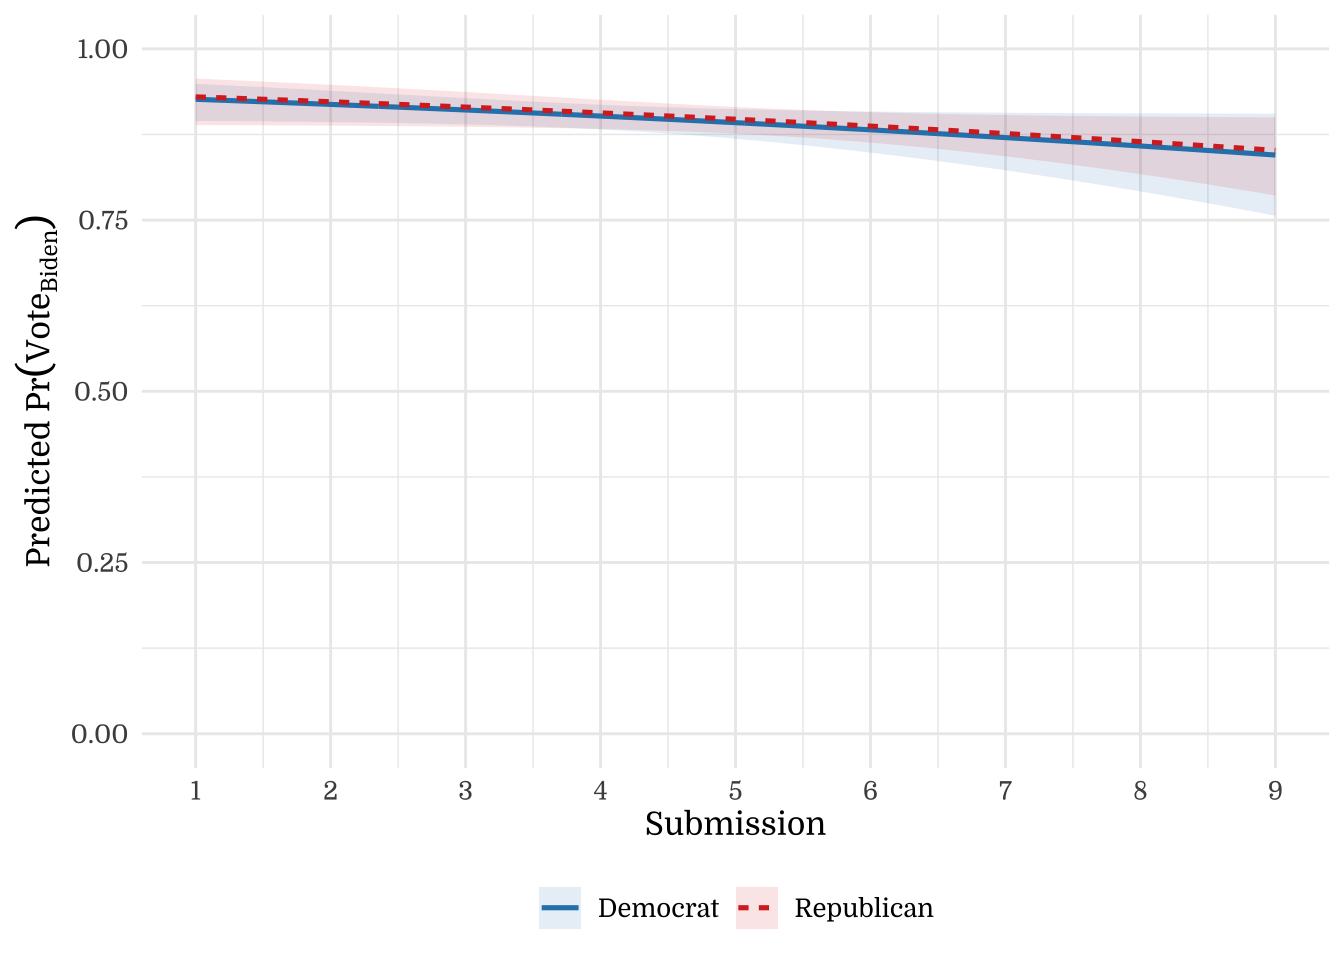
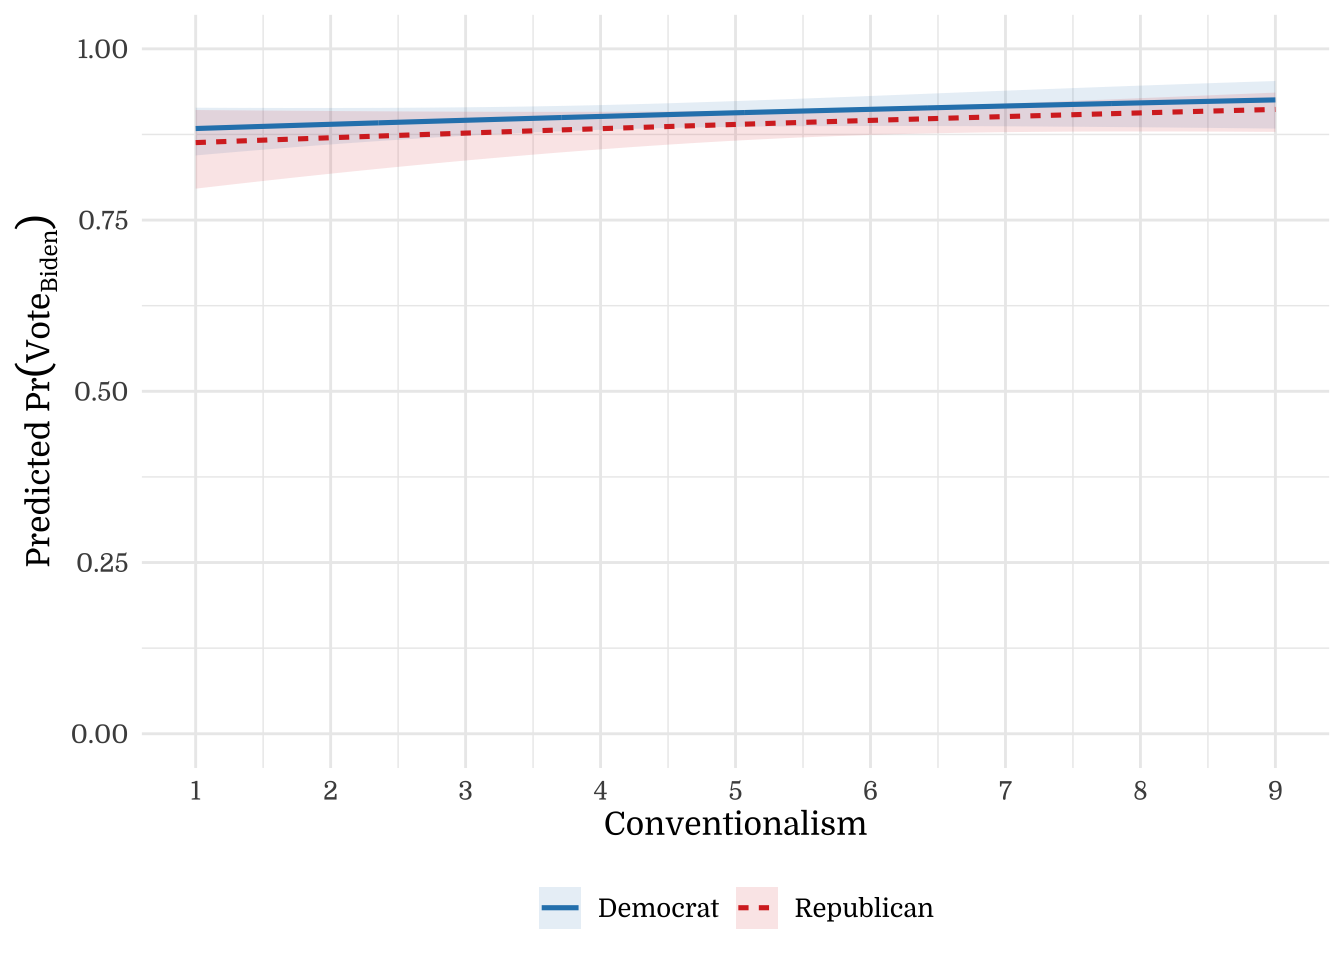
4.6 Voting
| 2020 [Trump vs. Biden] | |||
|---|---|---|---|
| Predictors | Log-Odds | CI | p |
| (Intercept) | 2.181 | -Inf – Inf | <.001 |
| Right-Wing Authoritarianism | -0.011 | -Inf – Inf | .886 |
| Observations | 2000 | ||
| R2 Tjur | .000 | ||
4.7 Voting & Party Identity
4.8 Likeability
5 Politico-Psychological correlates of Right-Wing Authoritarianism
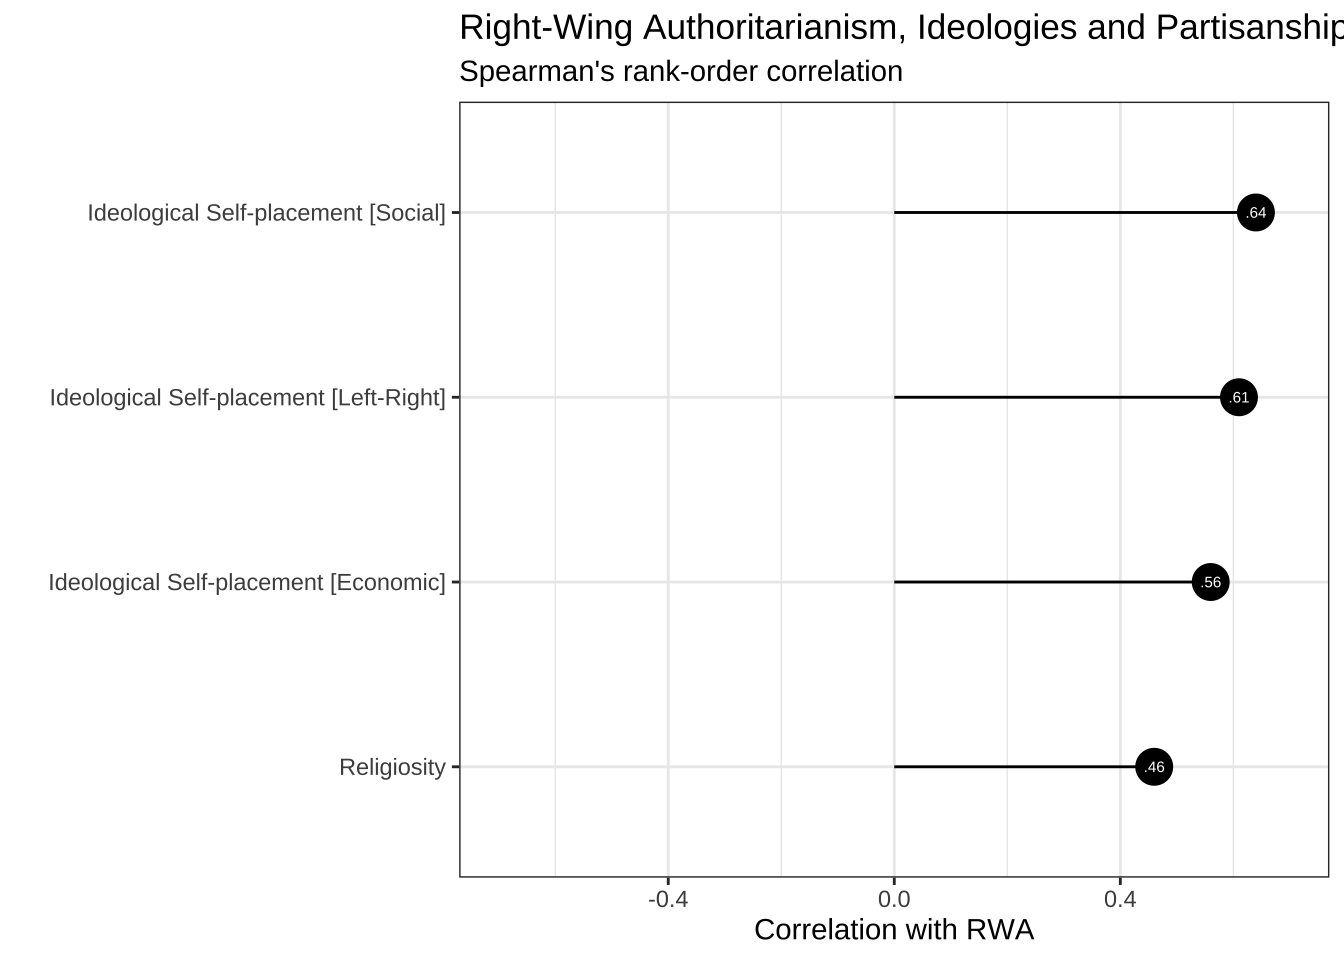
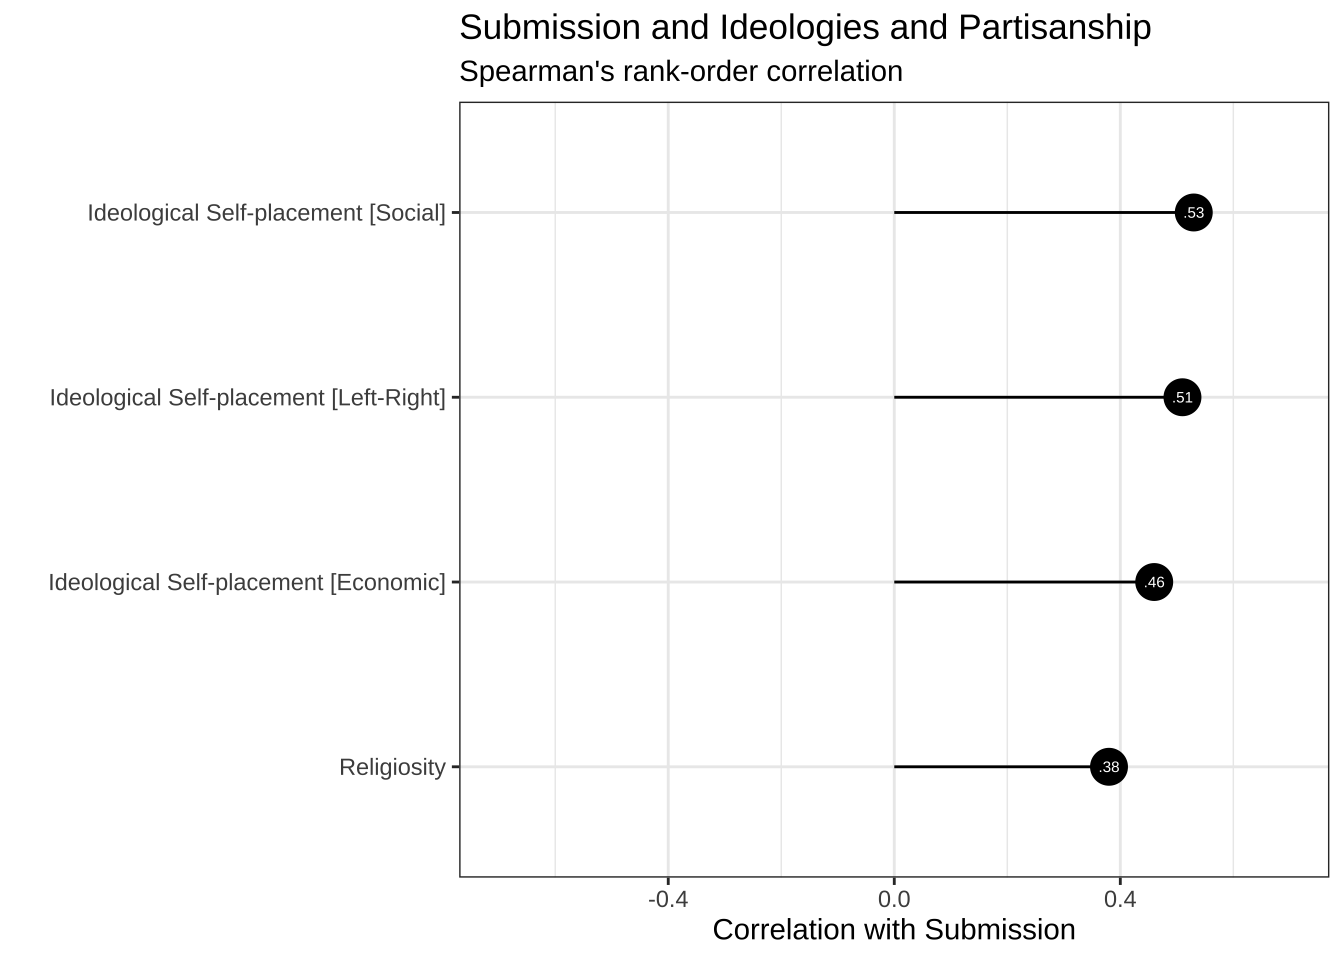
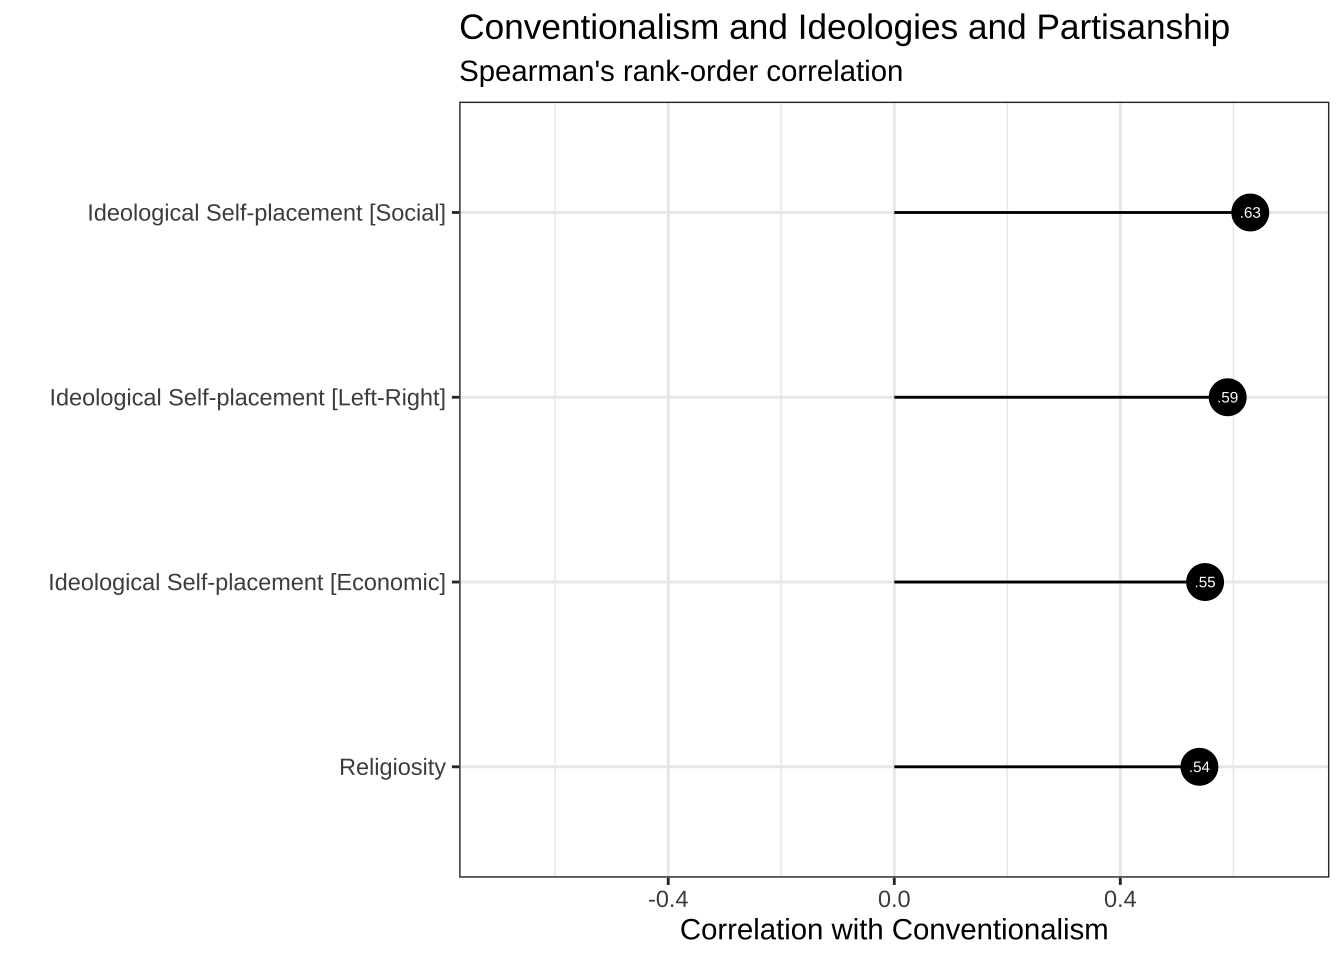
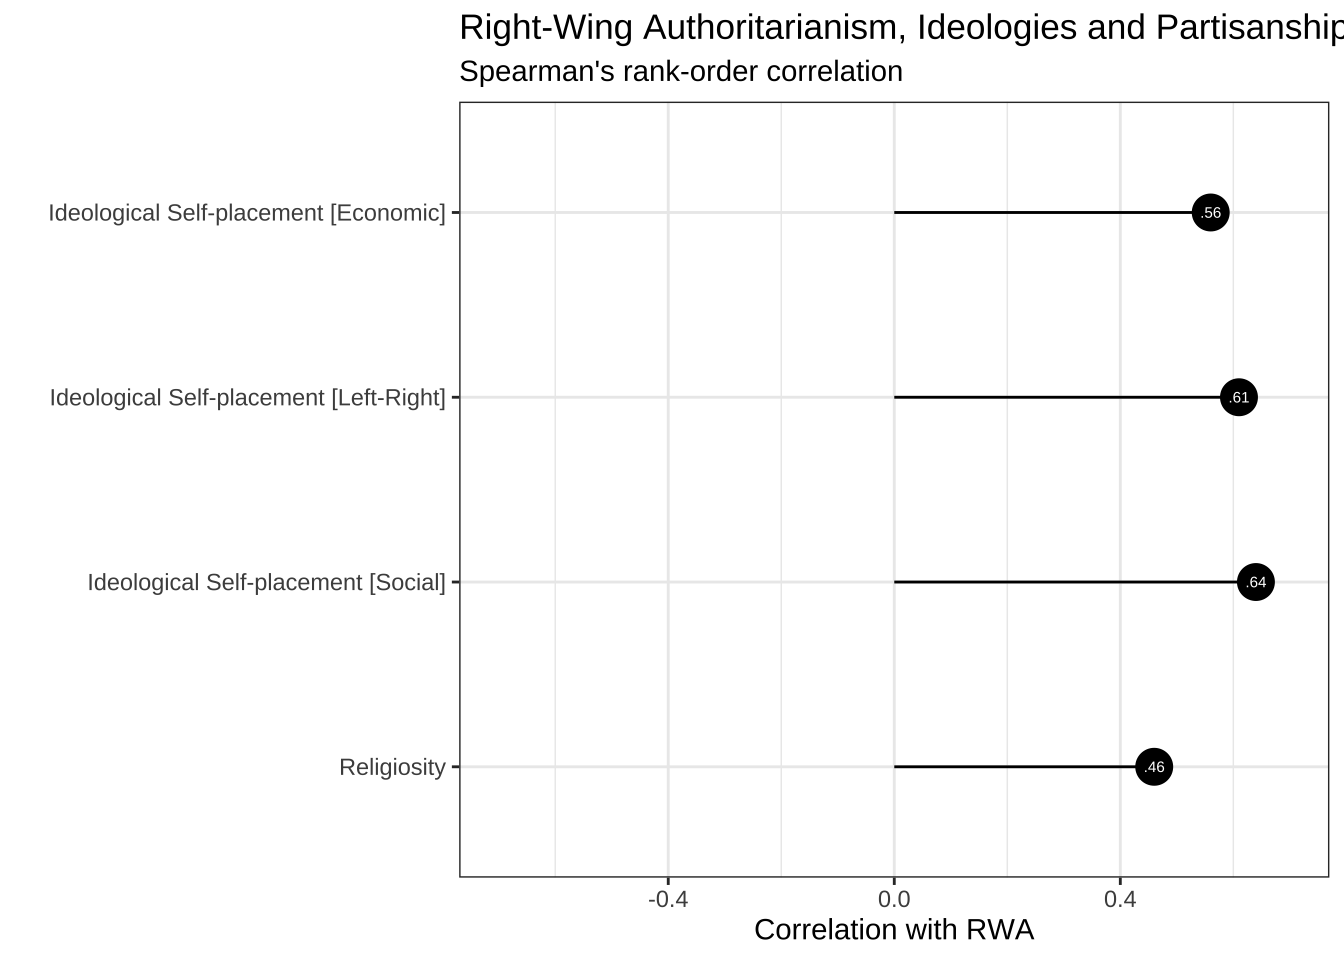
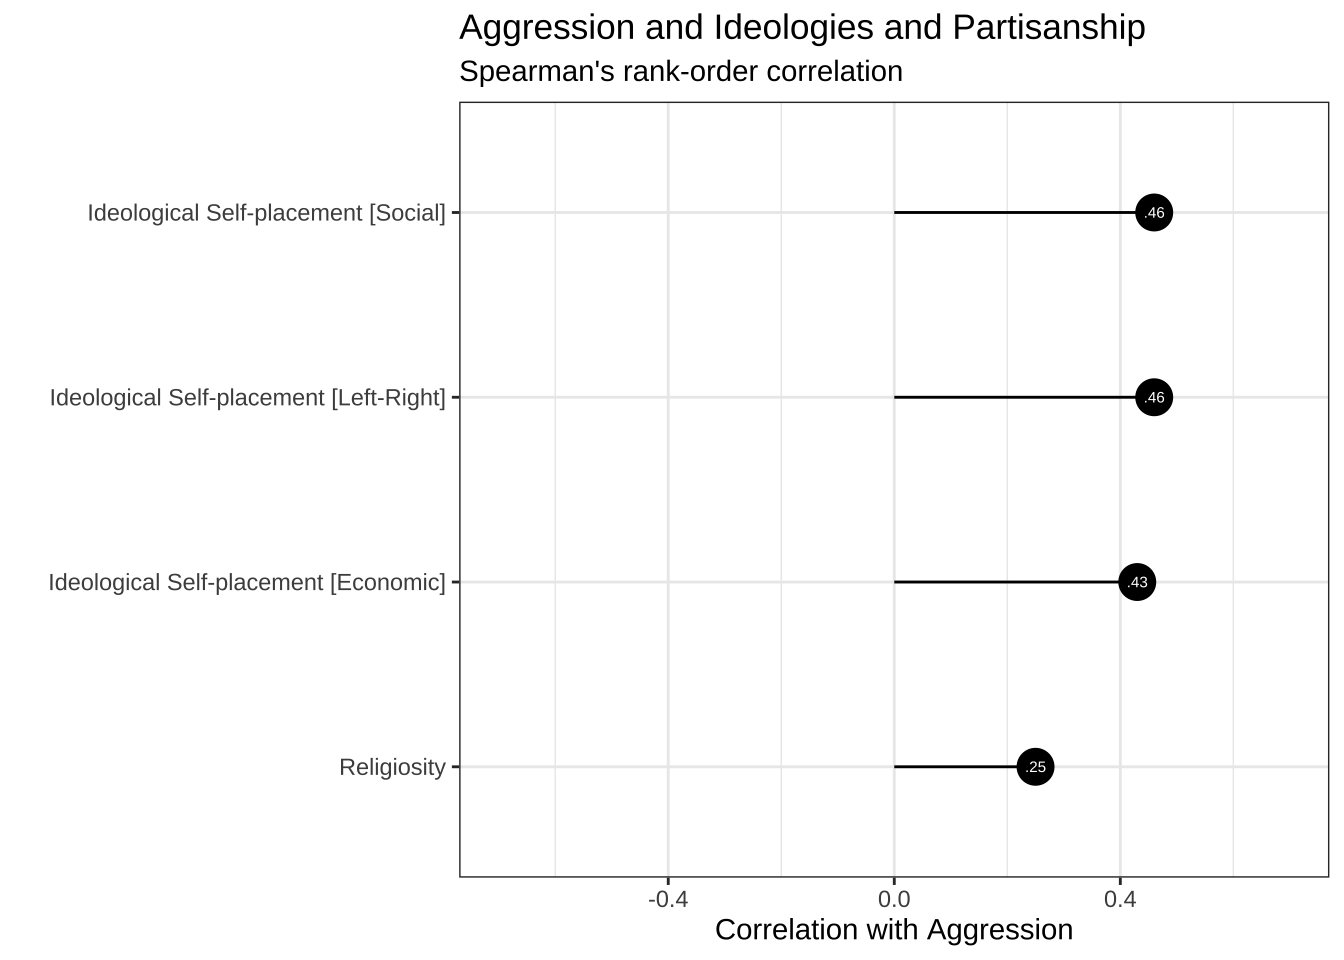
5.1 Ideologies and Partisanship


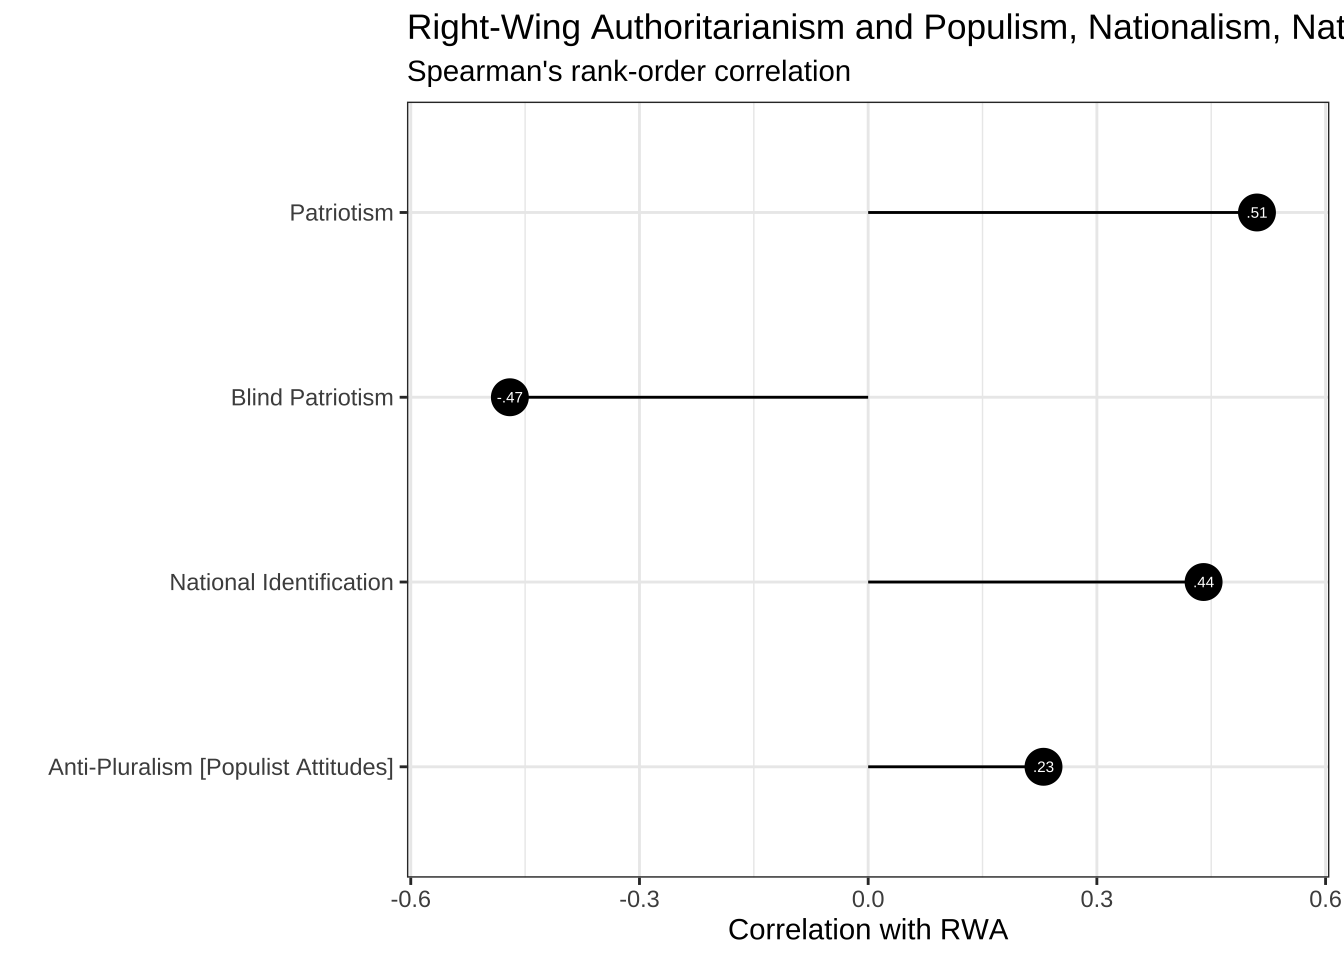
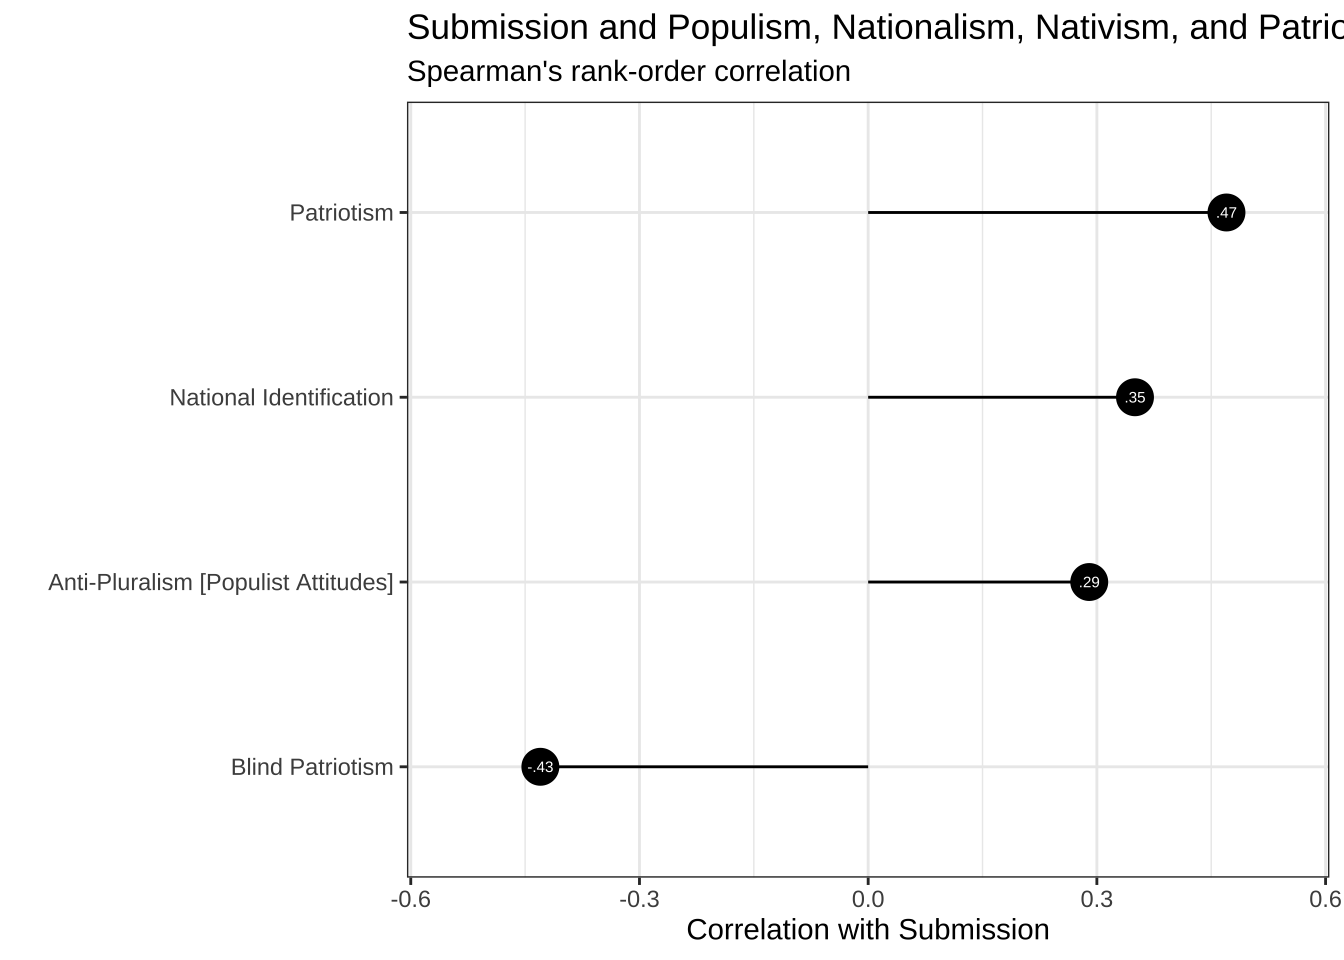
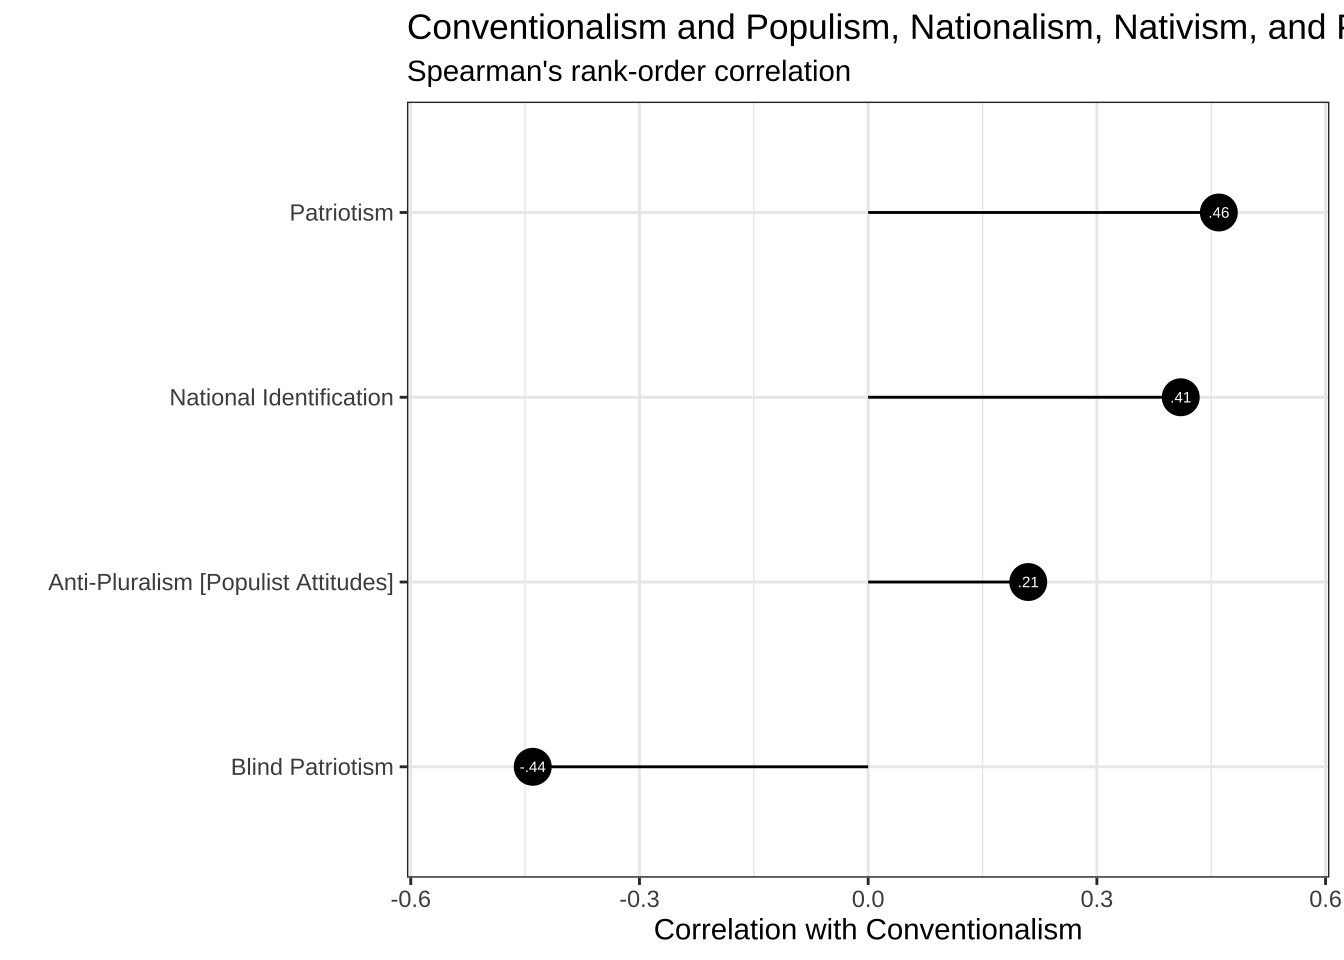
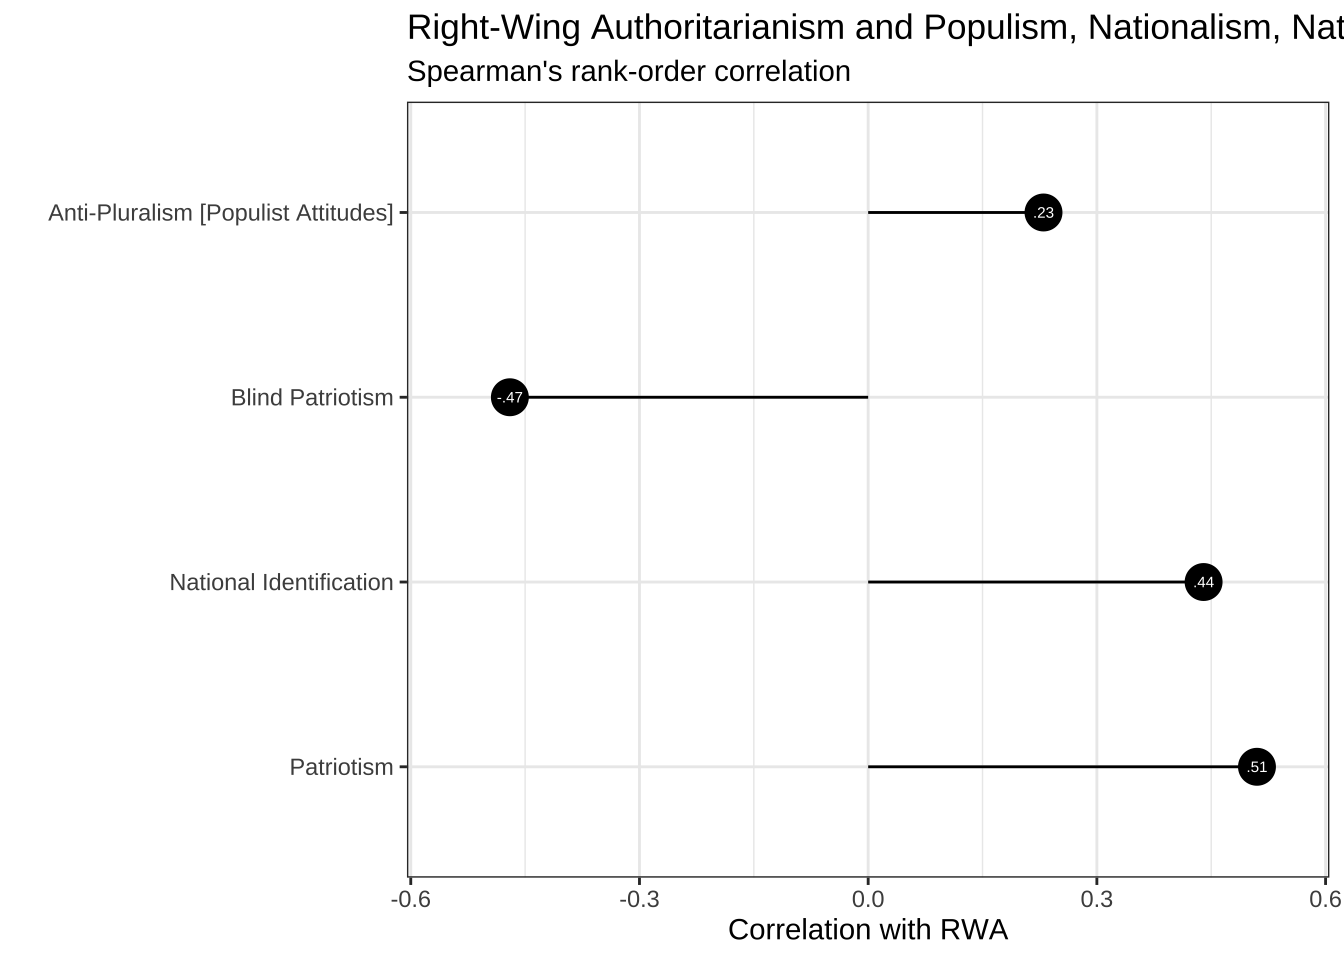
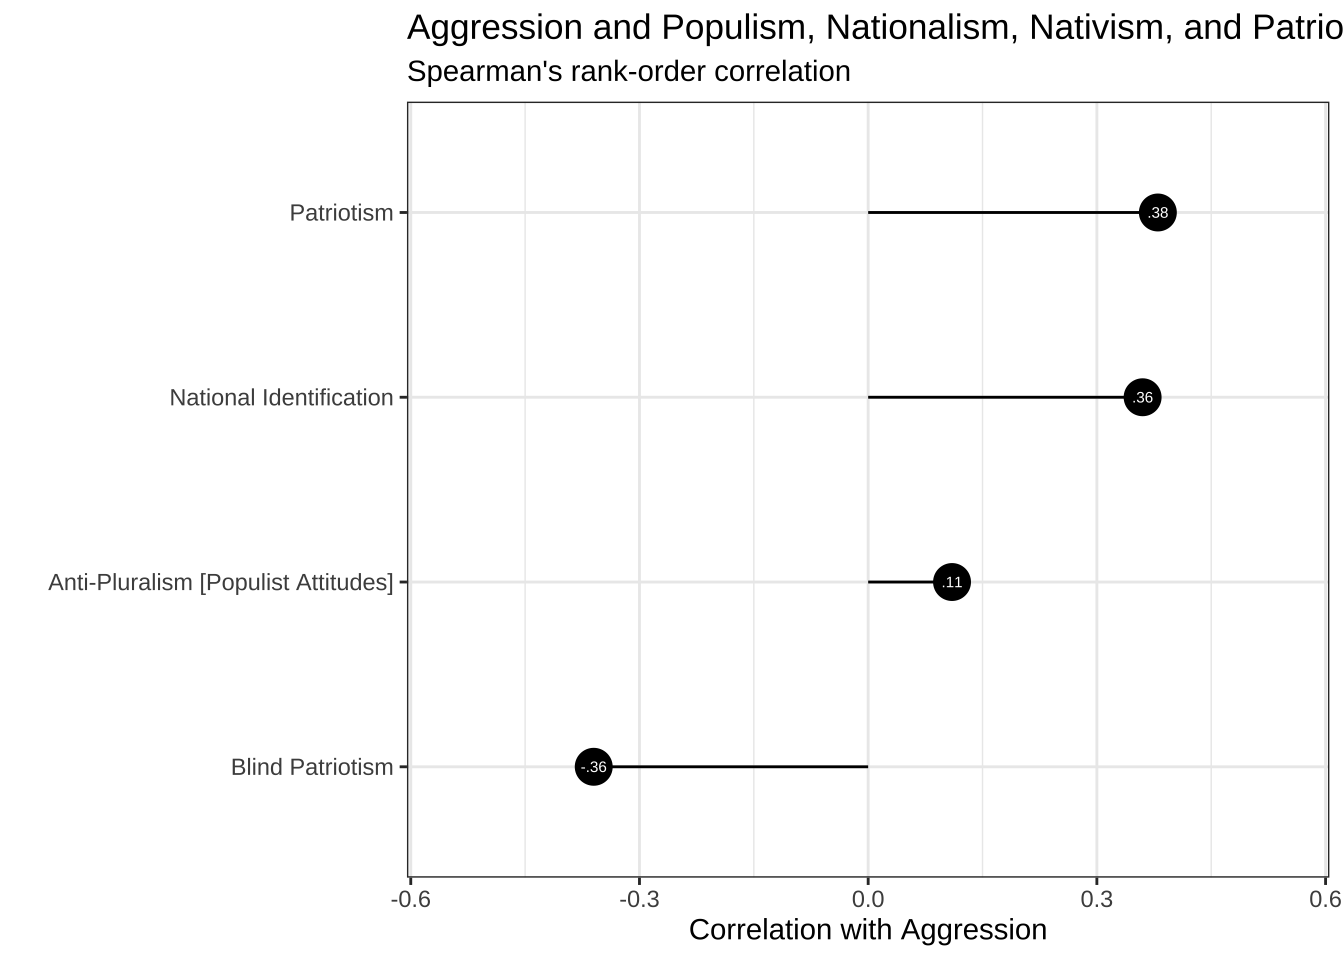
5.2 Populism, Nationalism, Nativism, and Patriotism


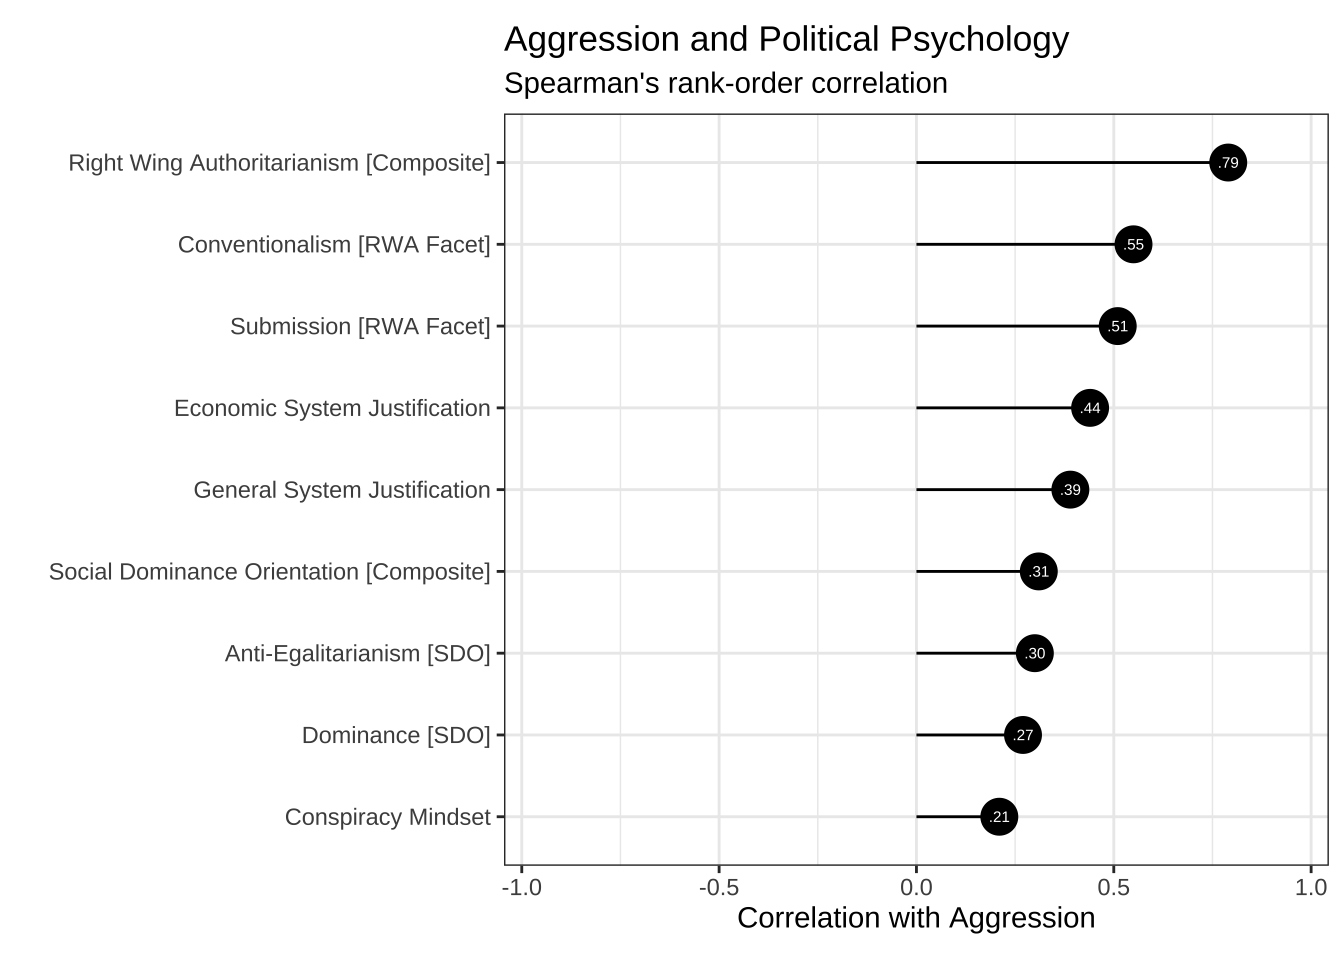
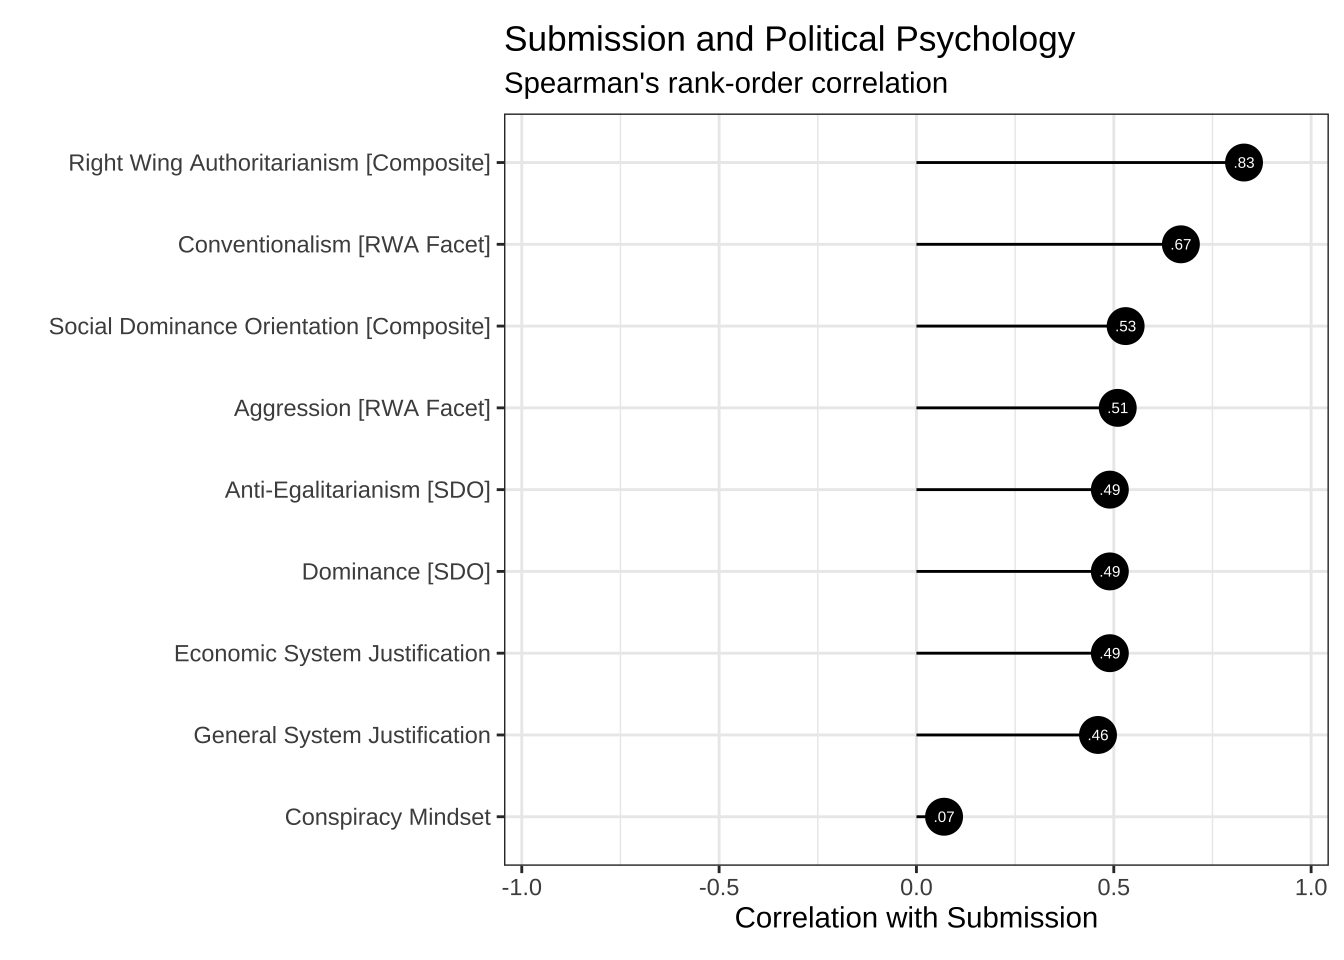
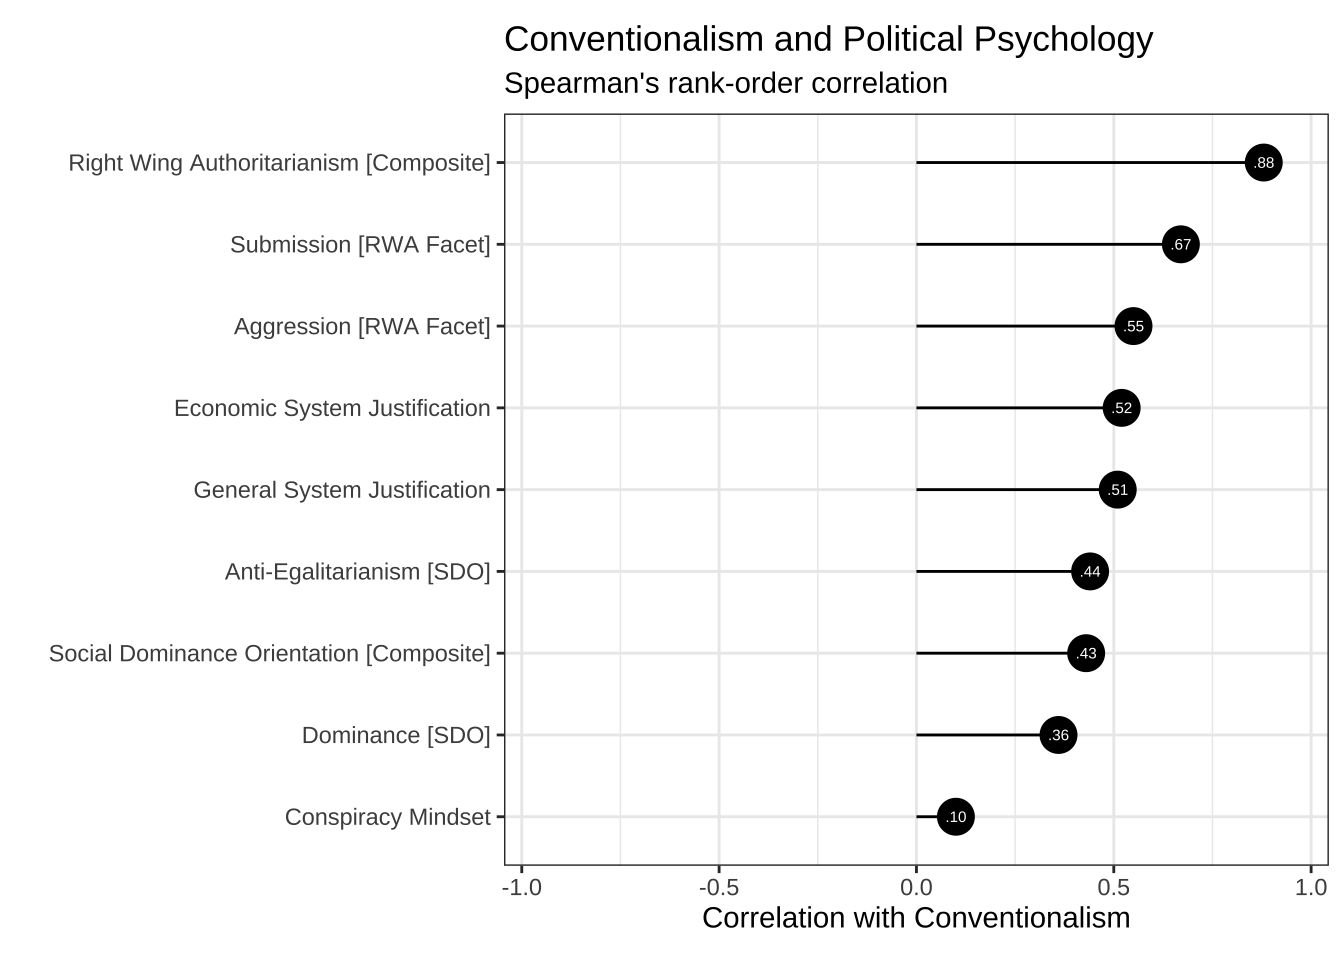
5.3 Political Psychology
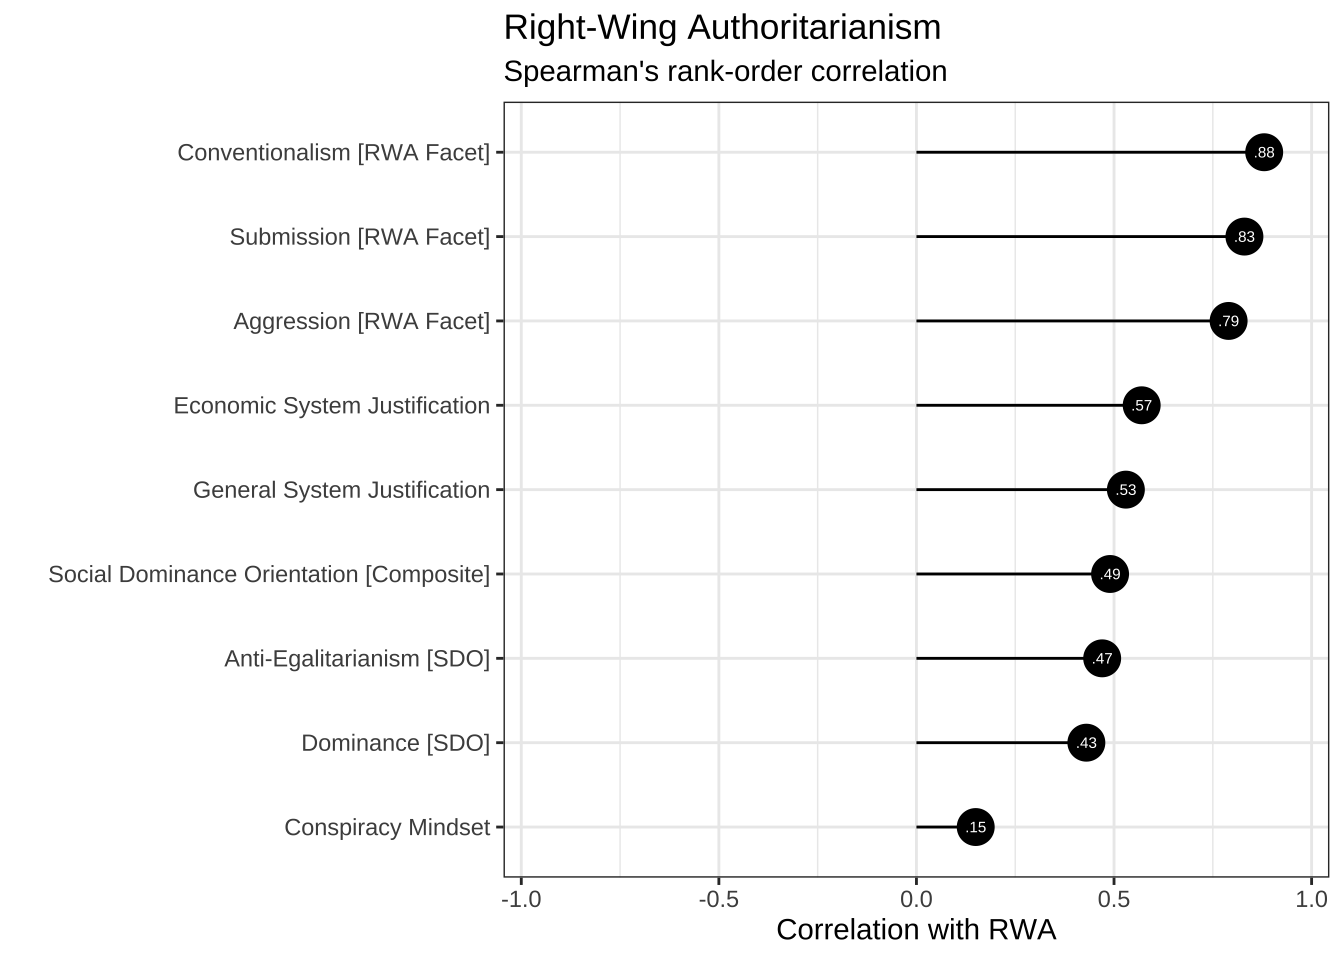


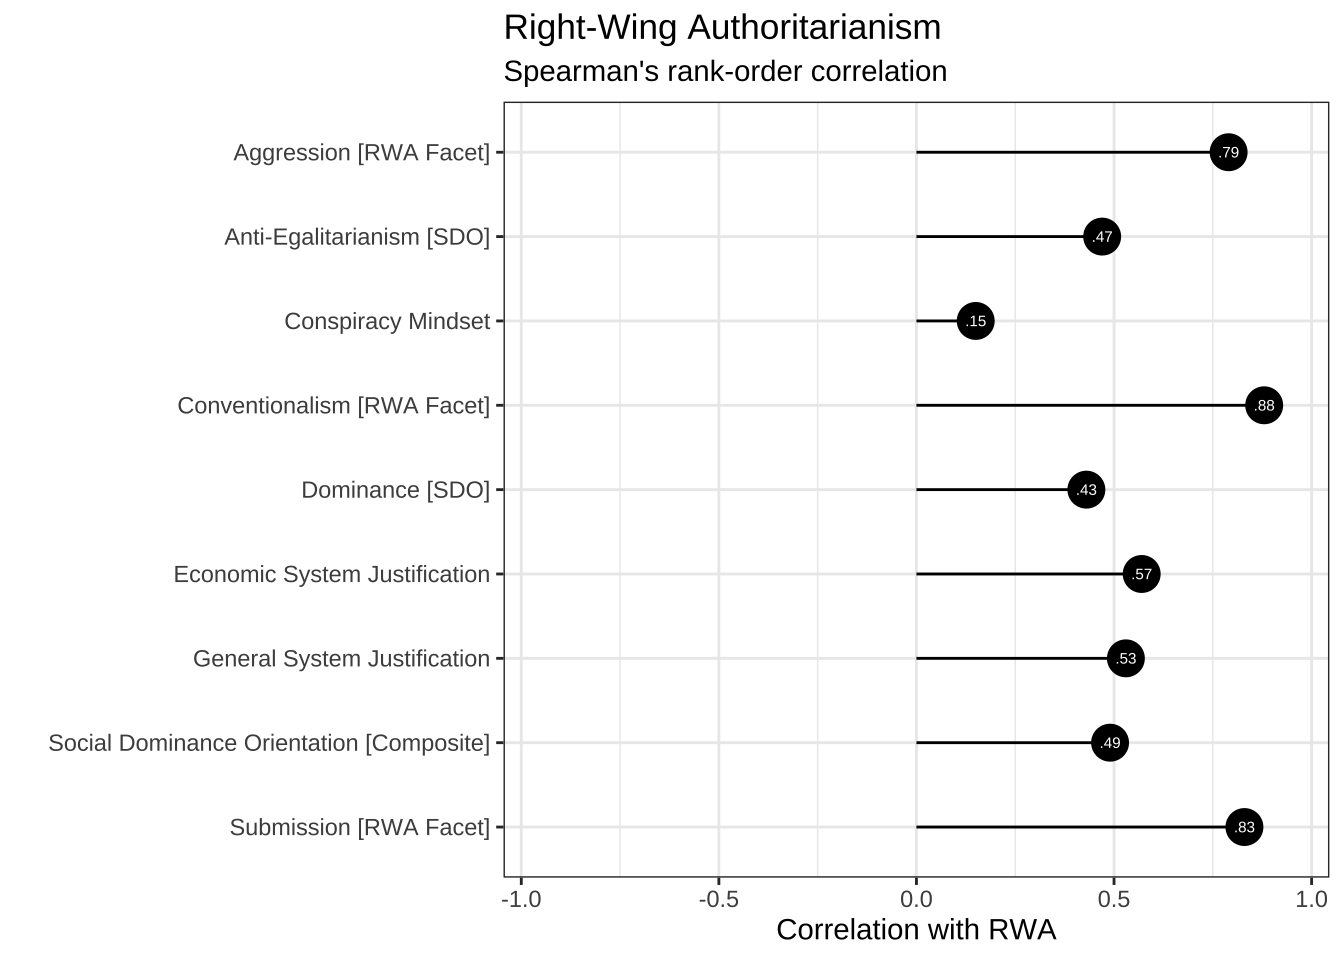
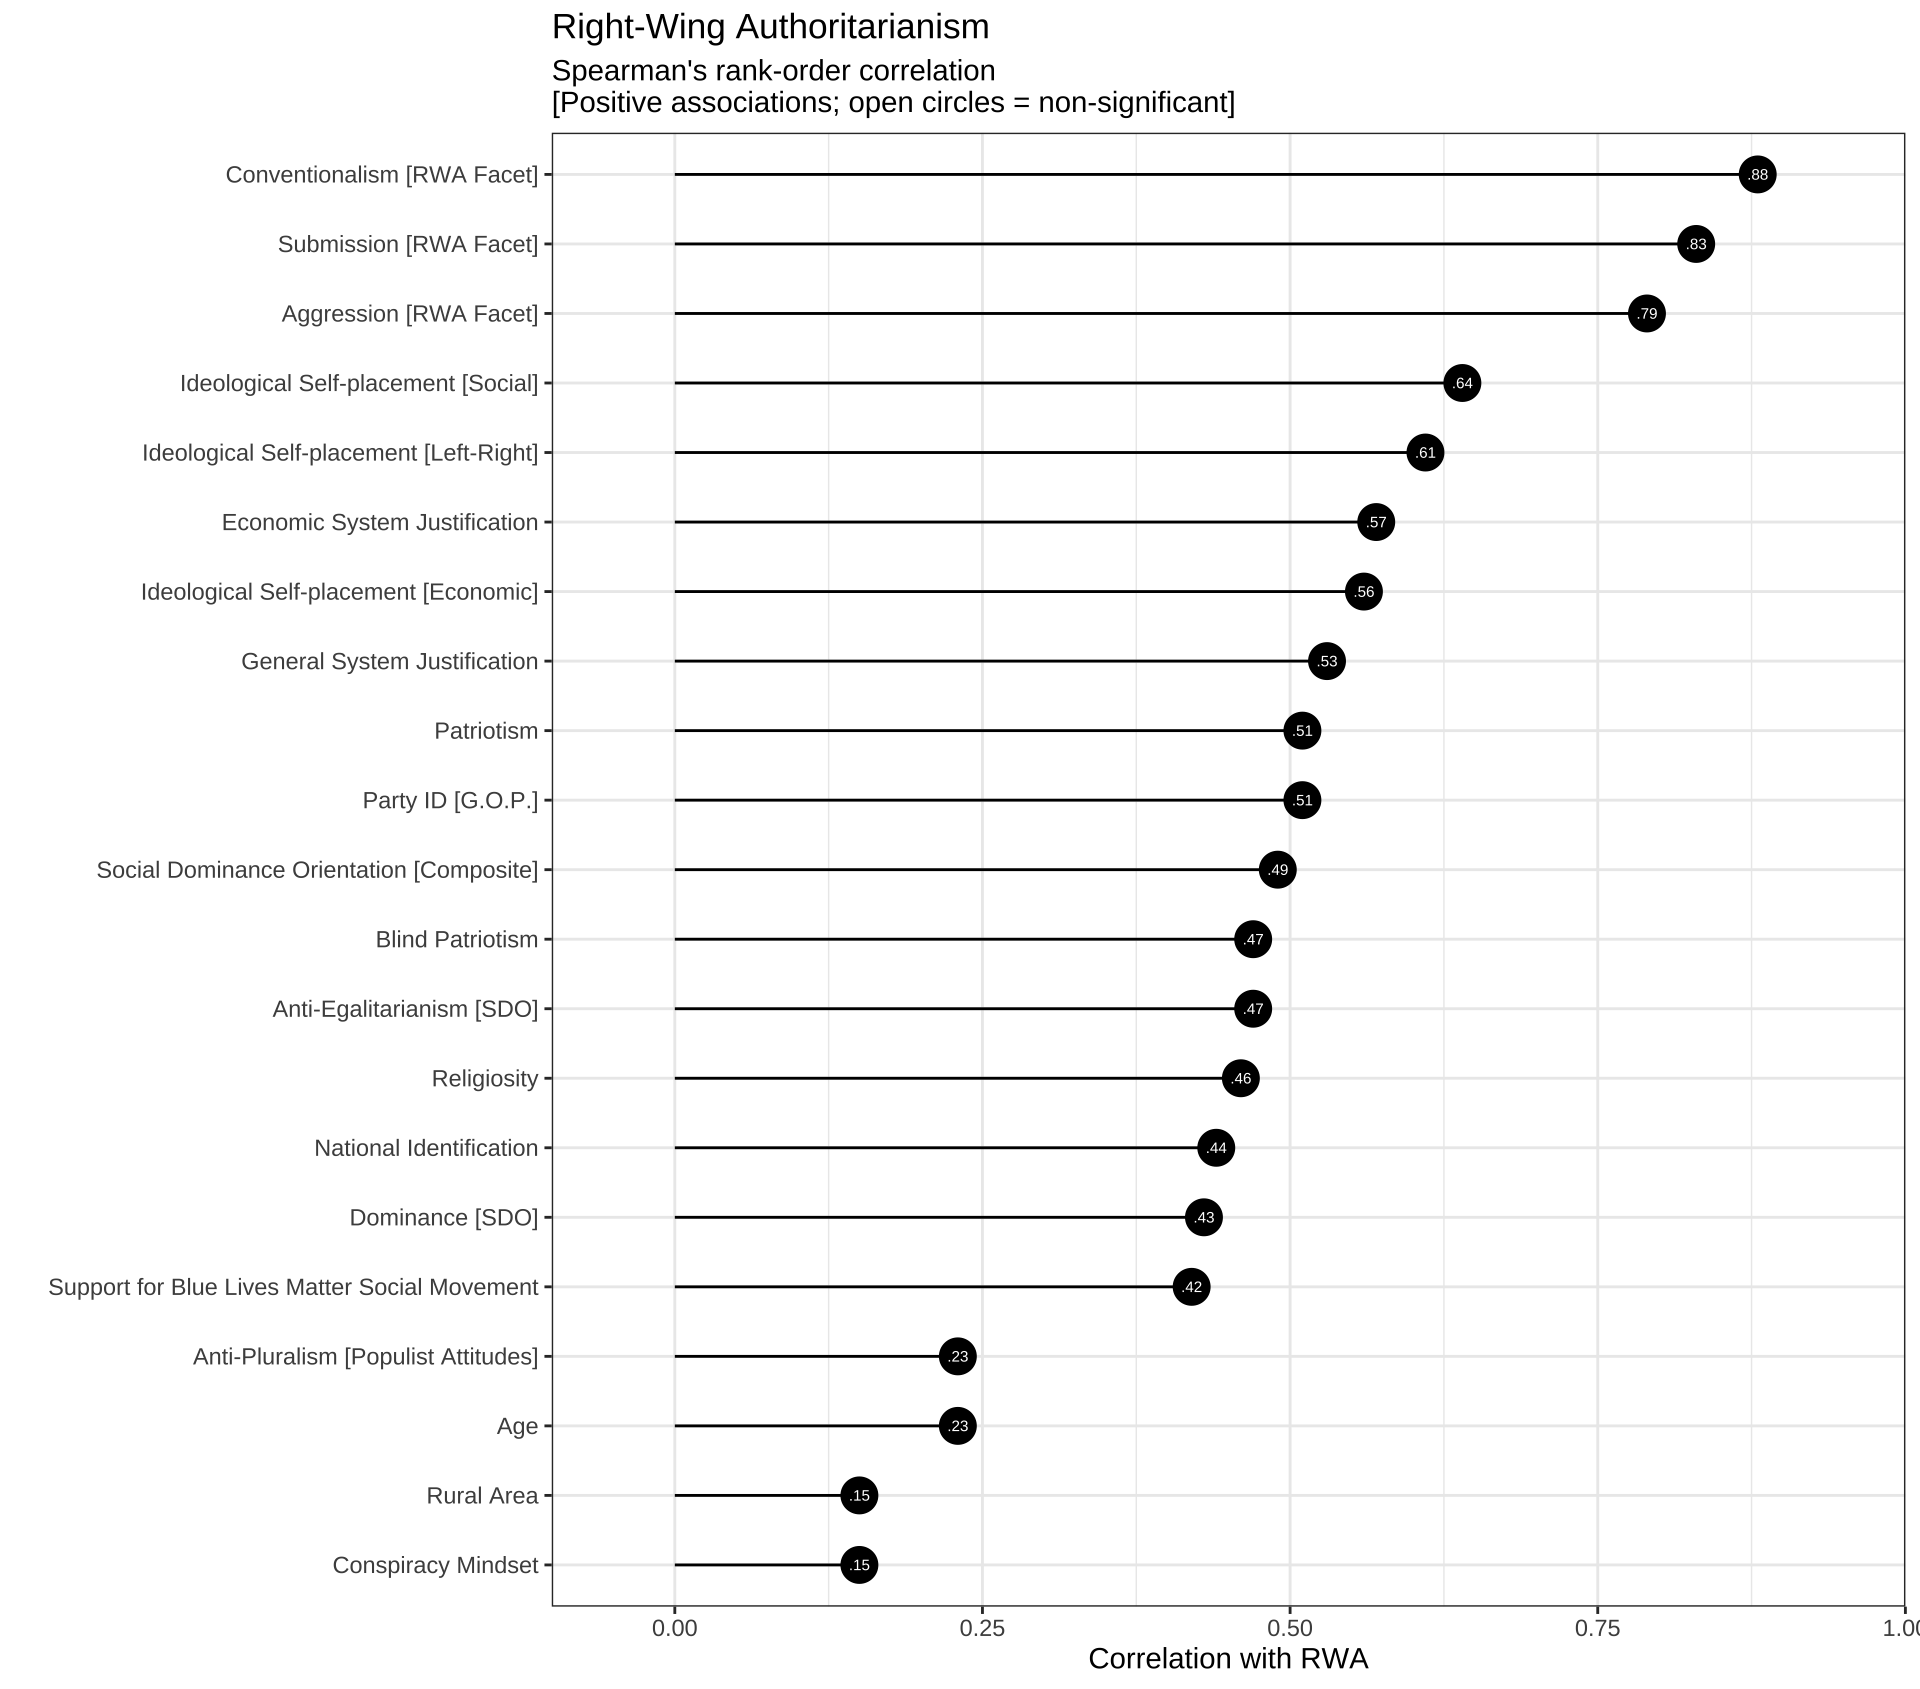
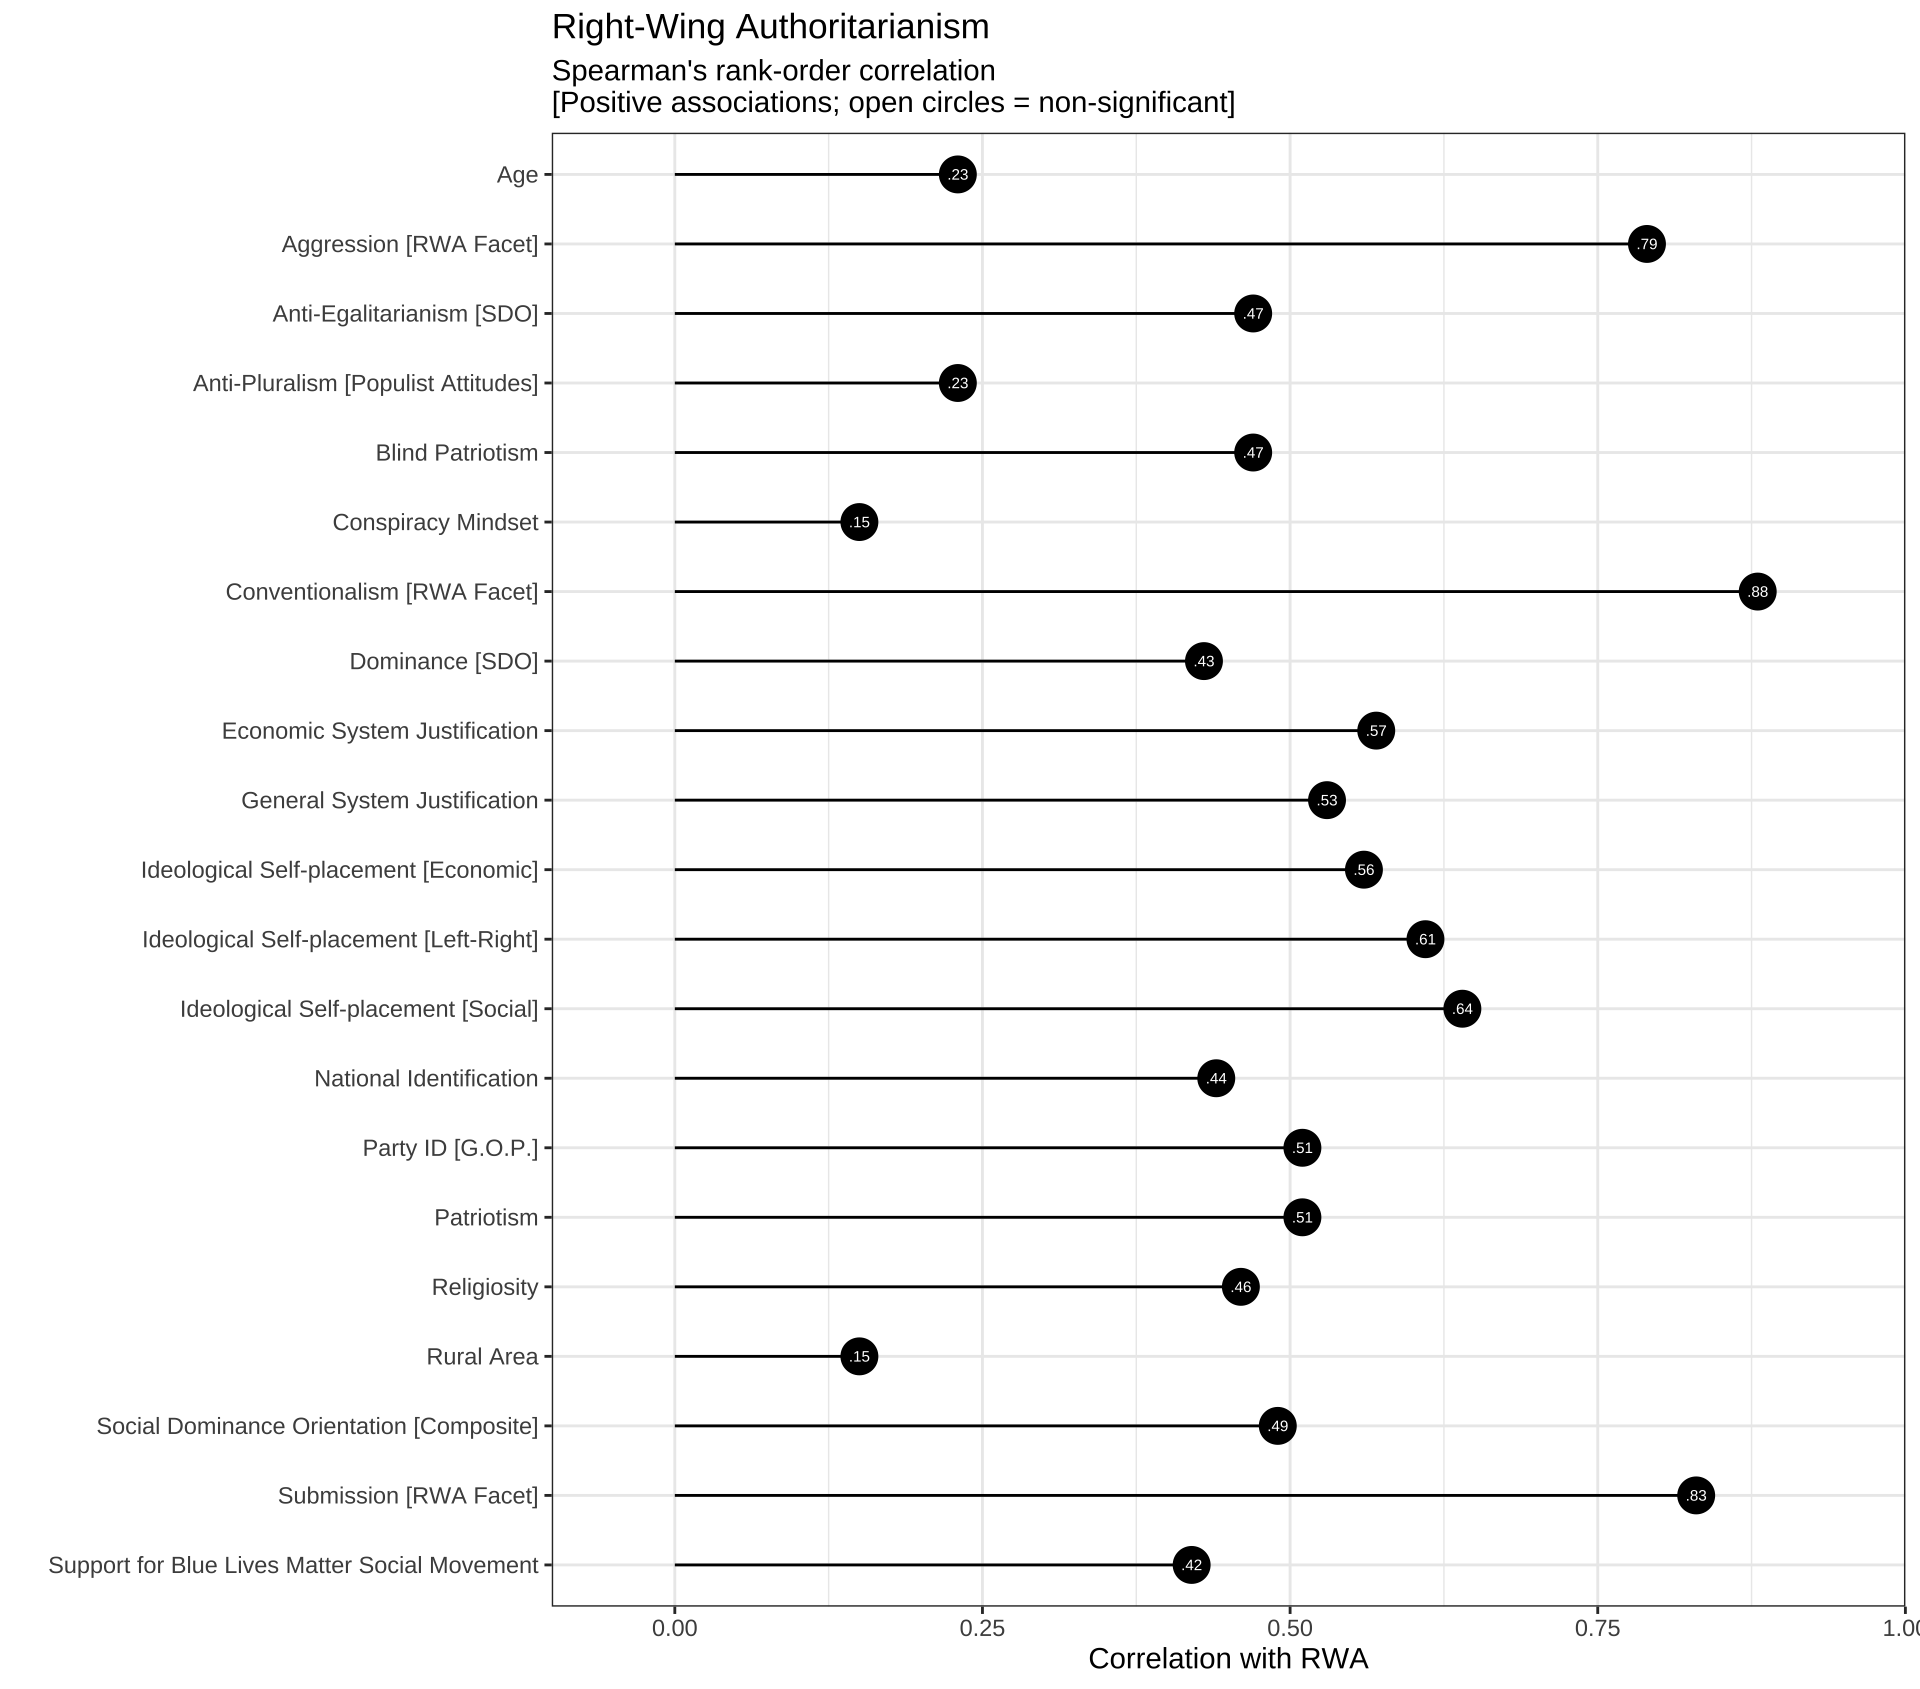
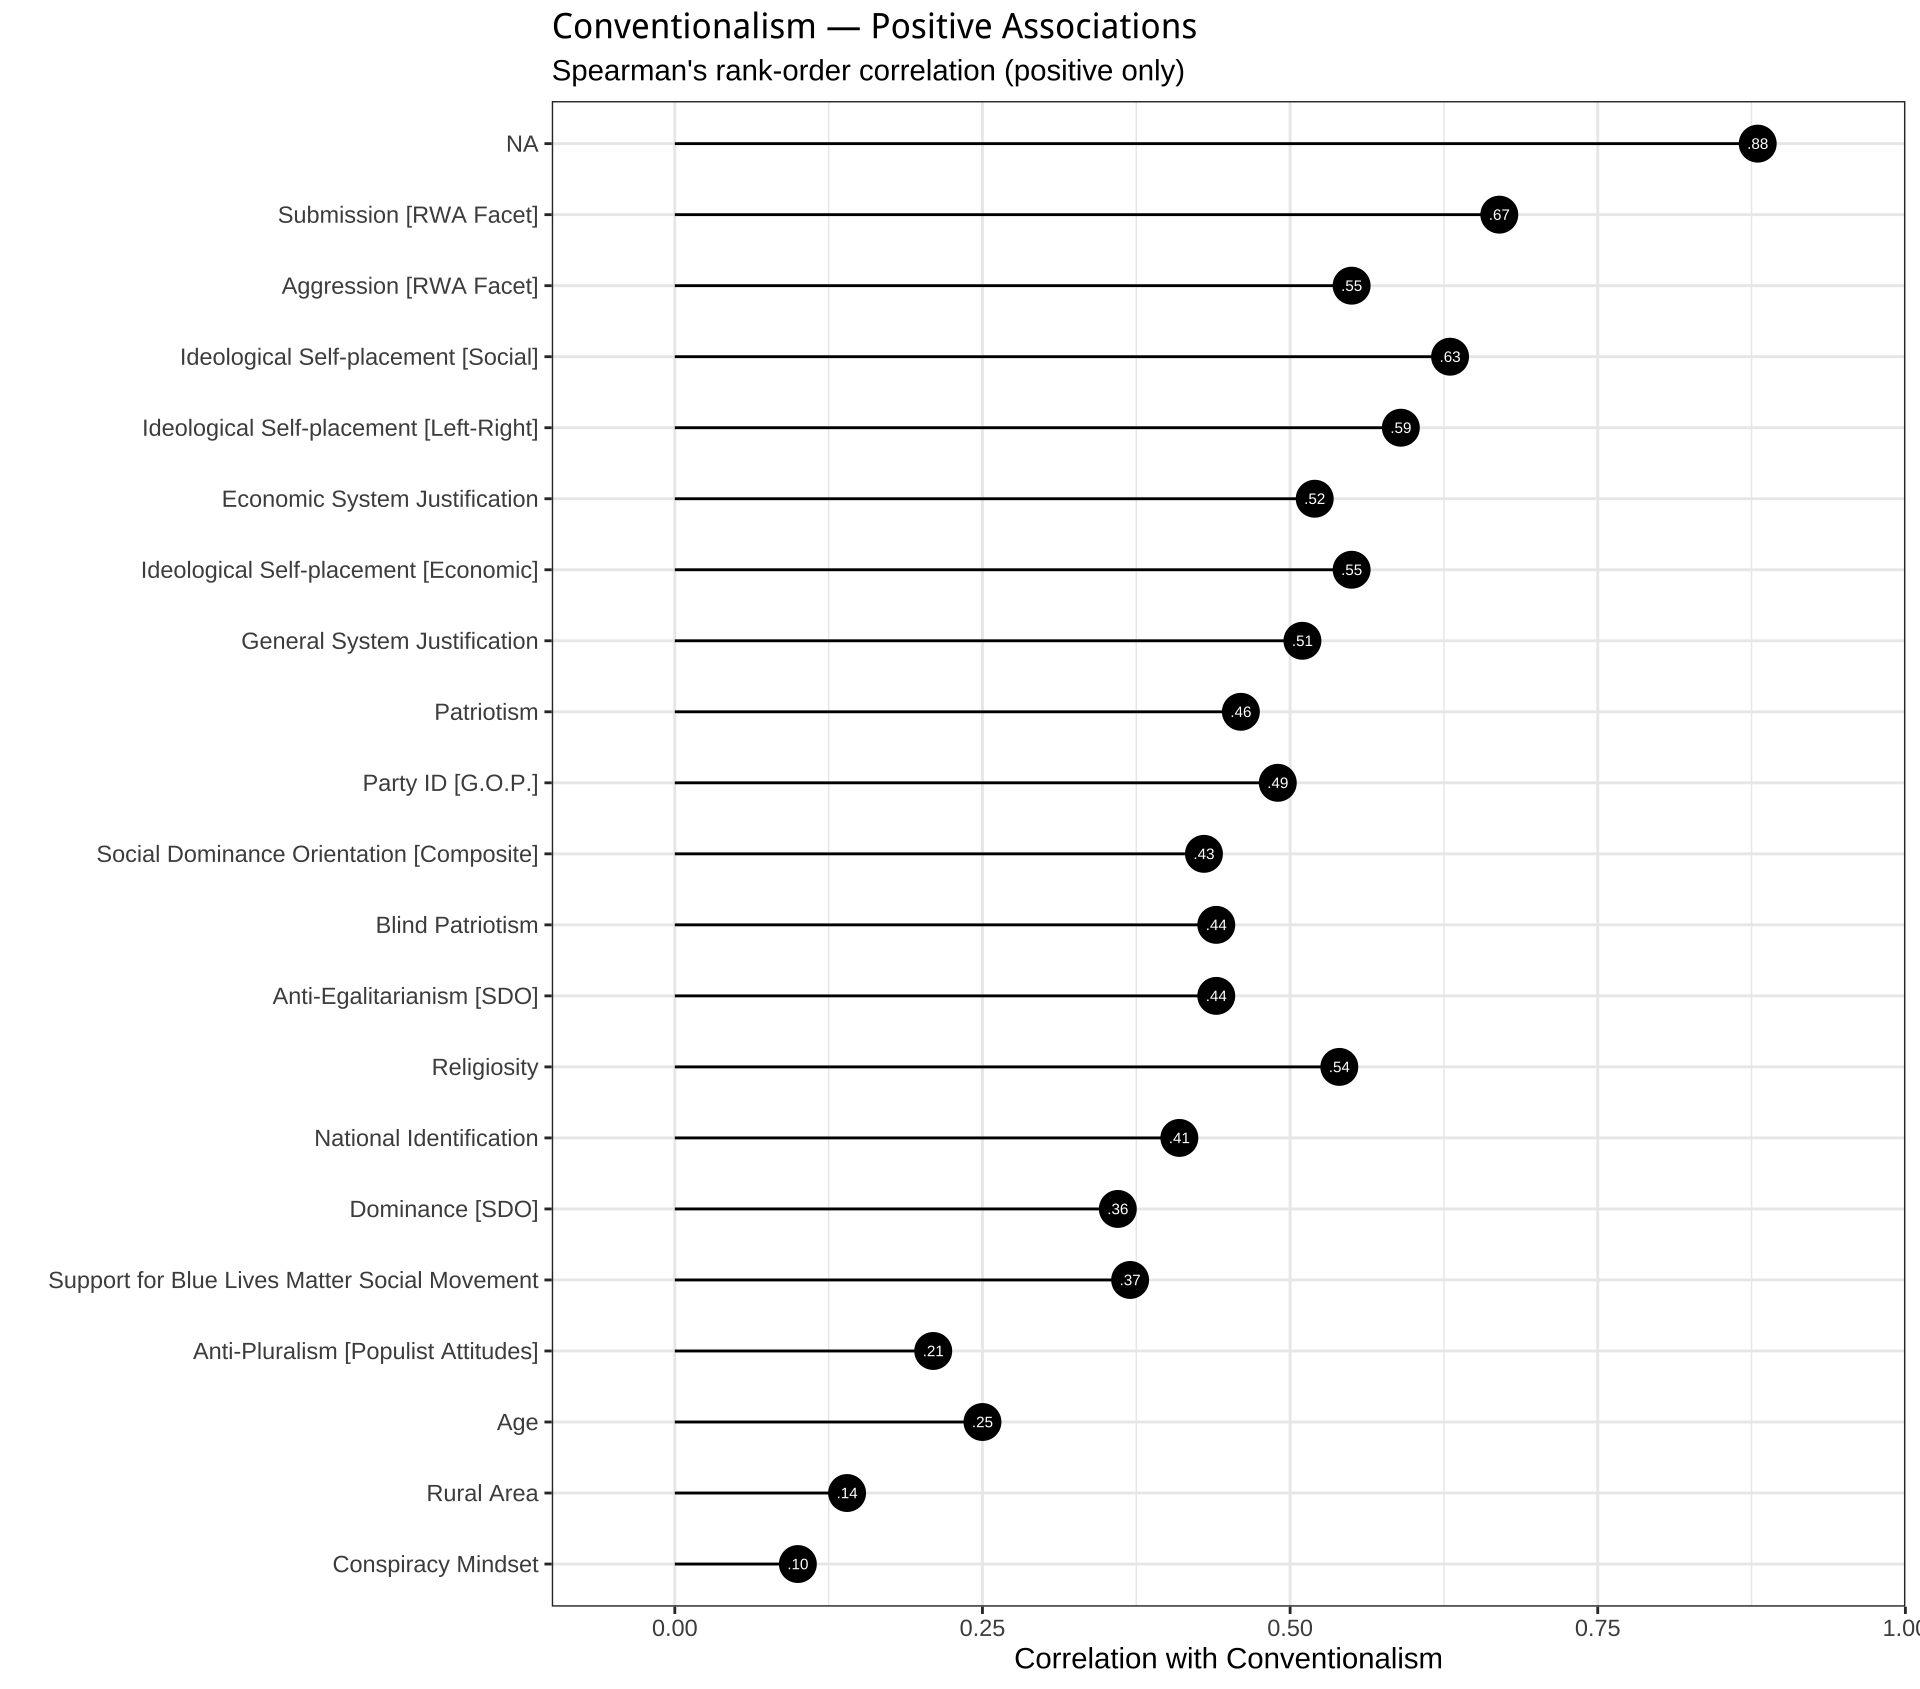
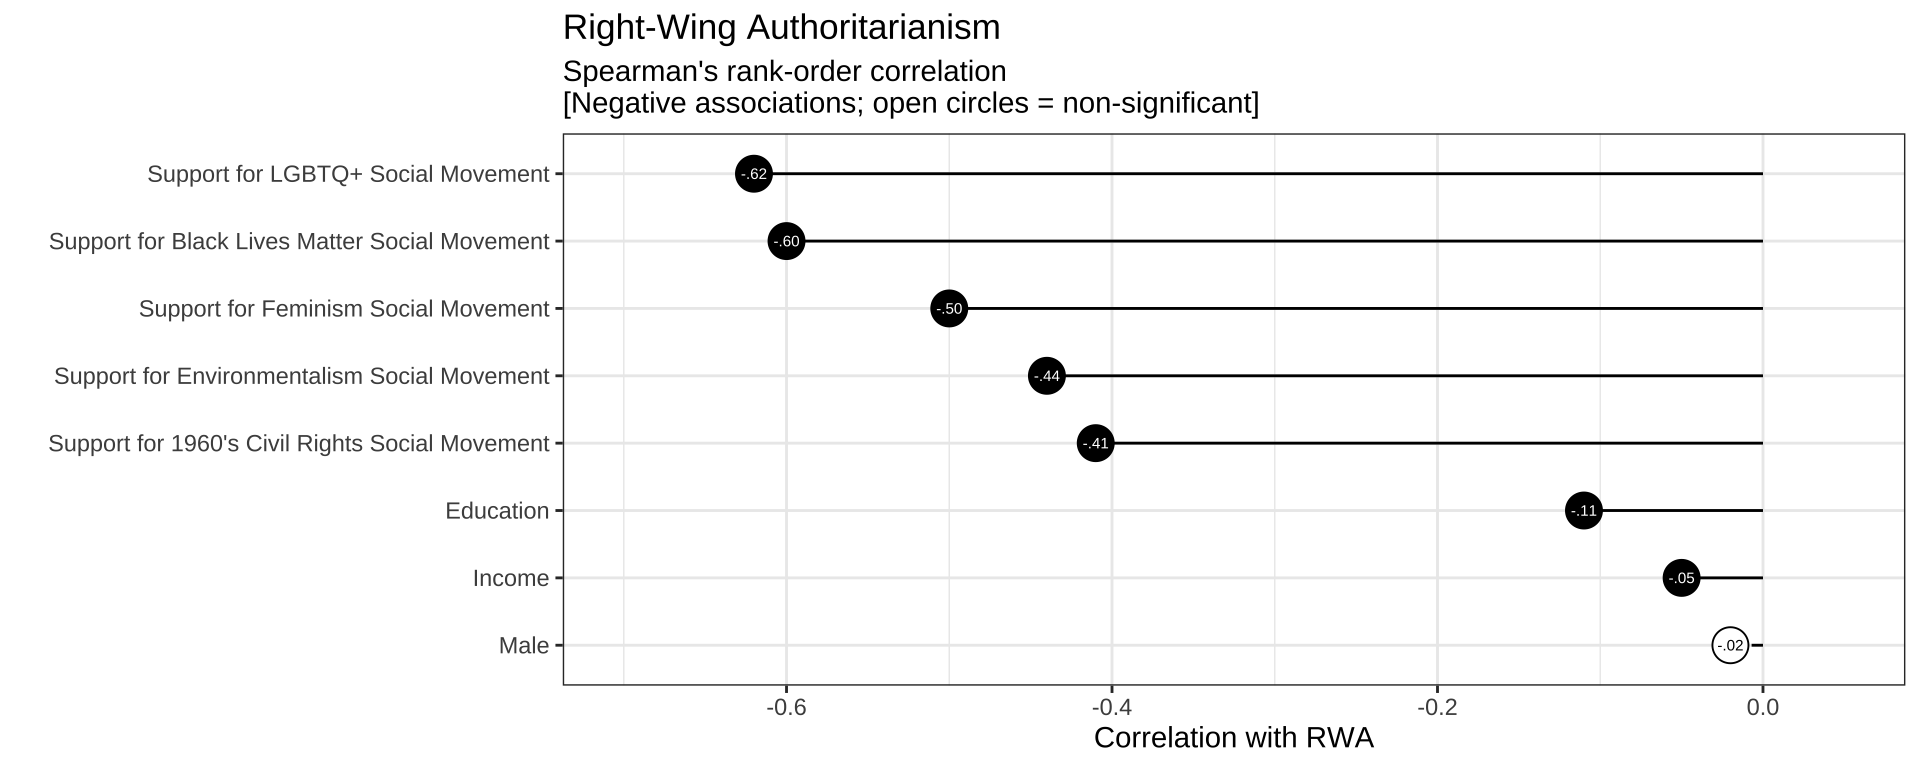
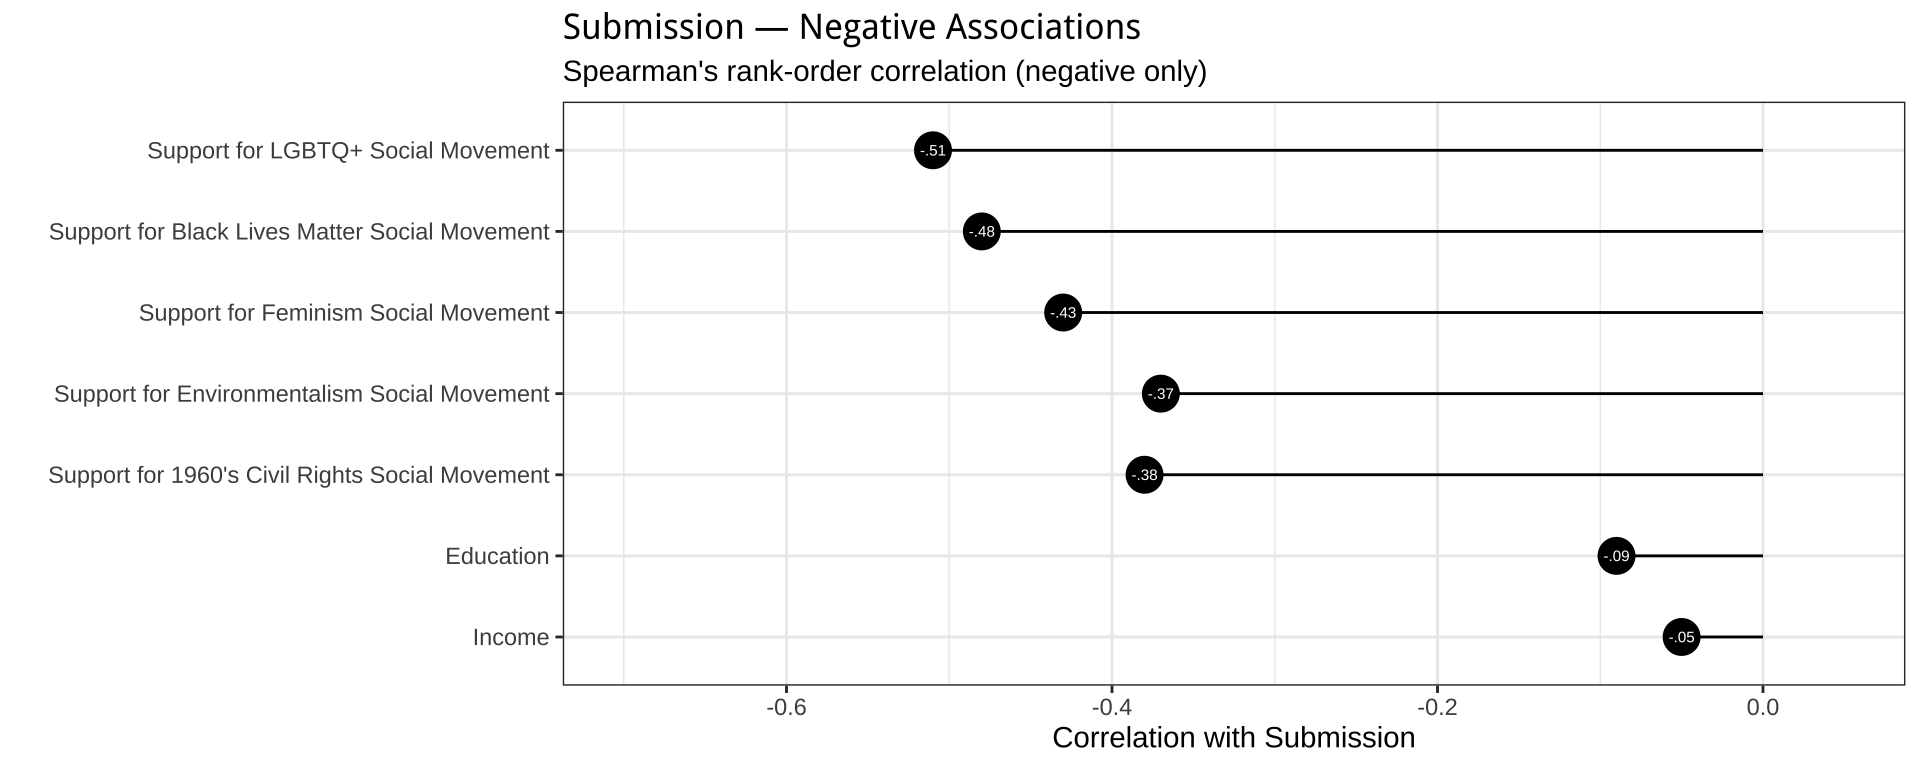
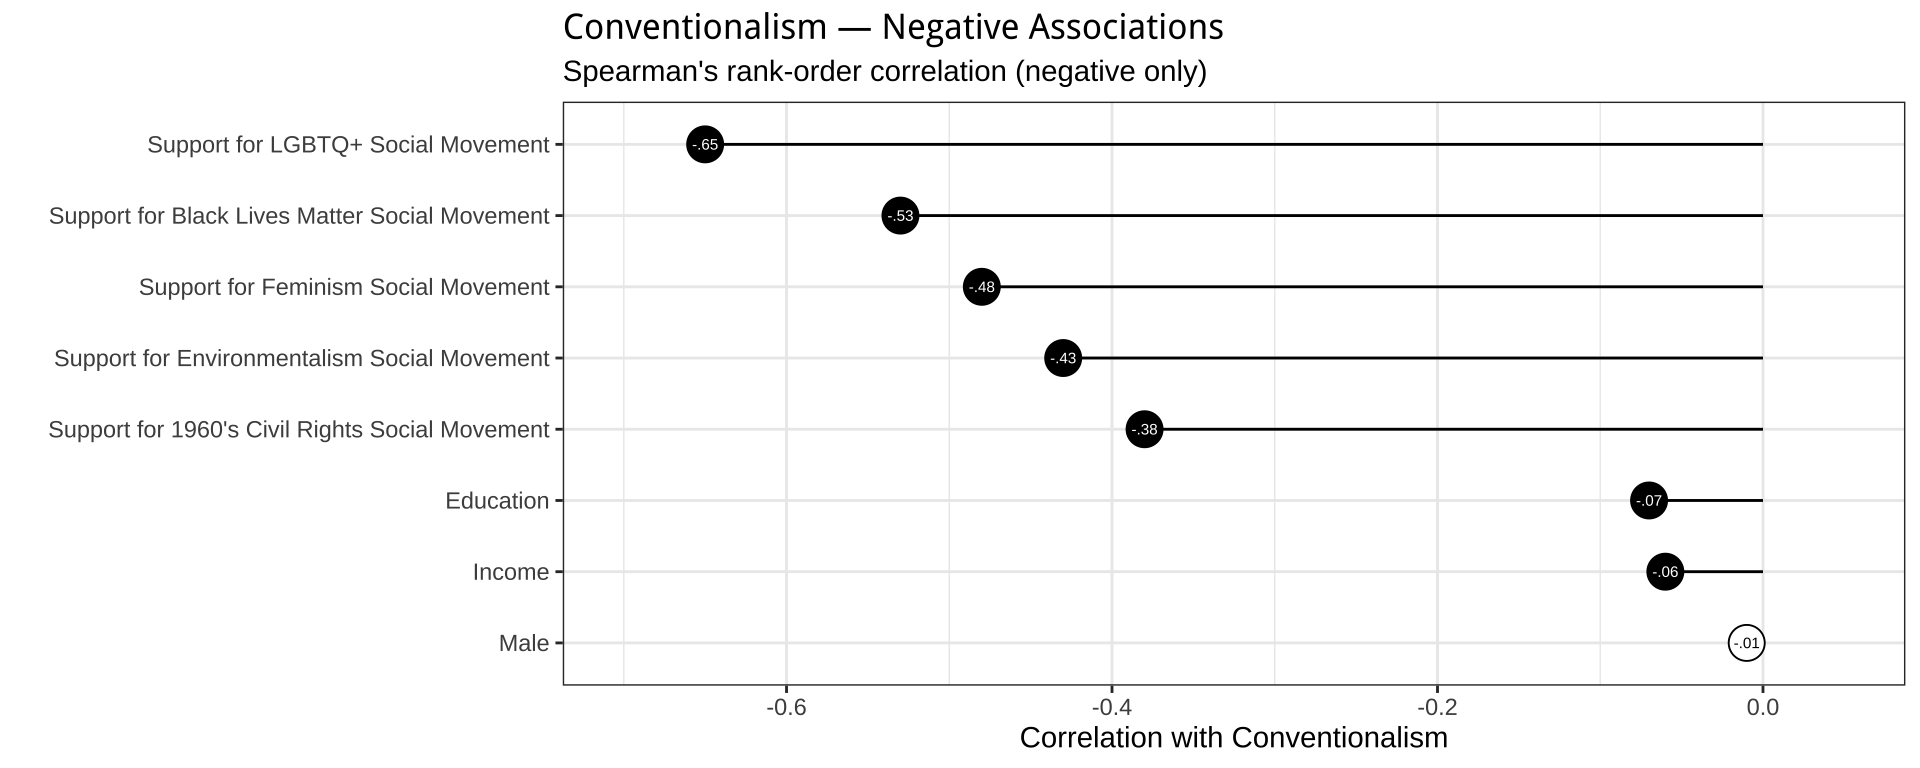
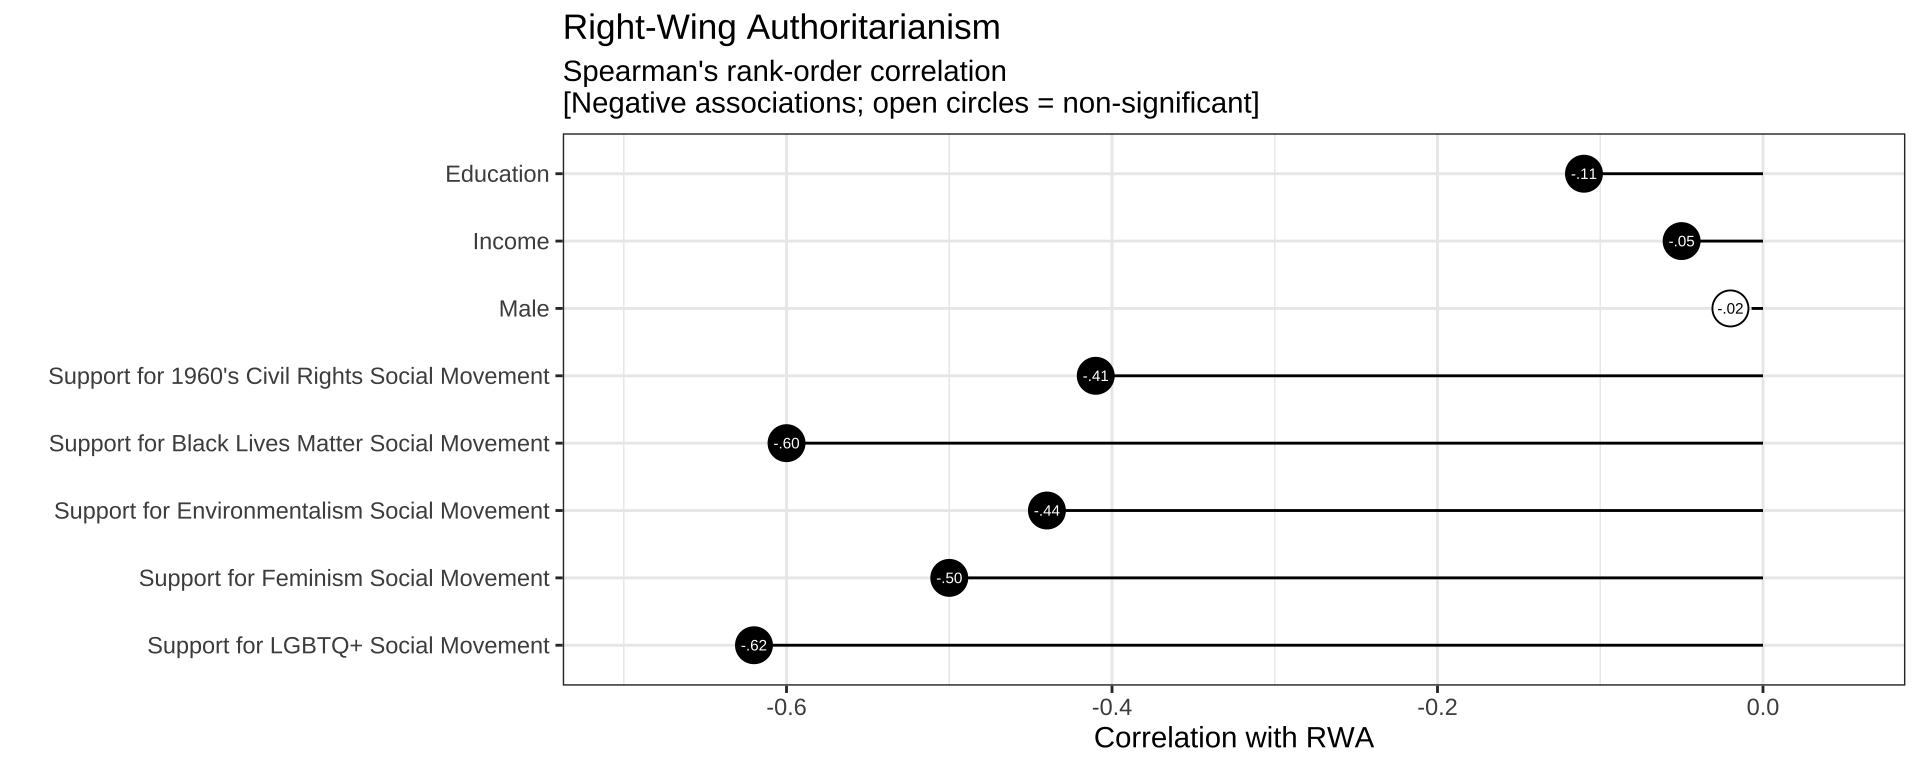
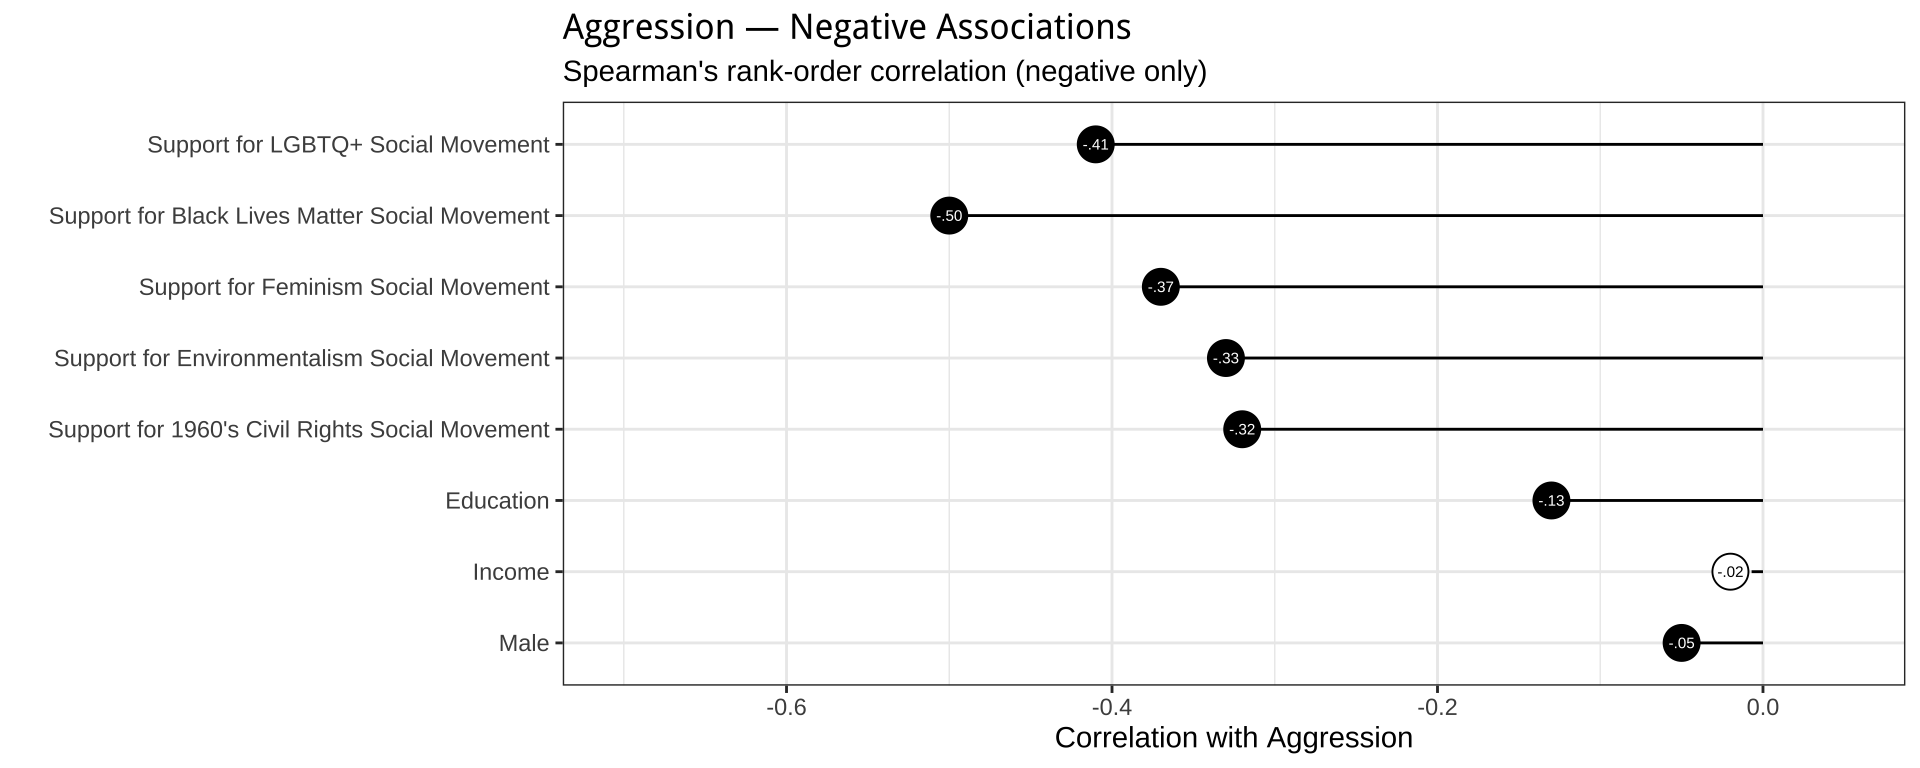
5.4 Positive and Negative correlates of Right-Wing Authoritarianism


6 Elastic Net Analysis
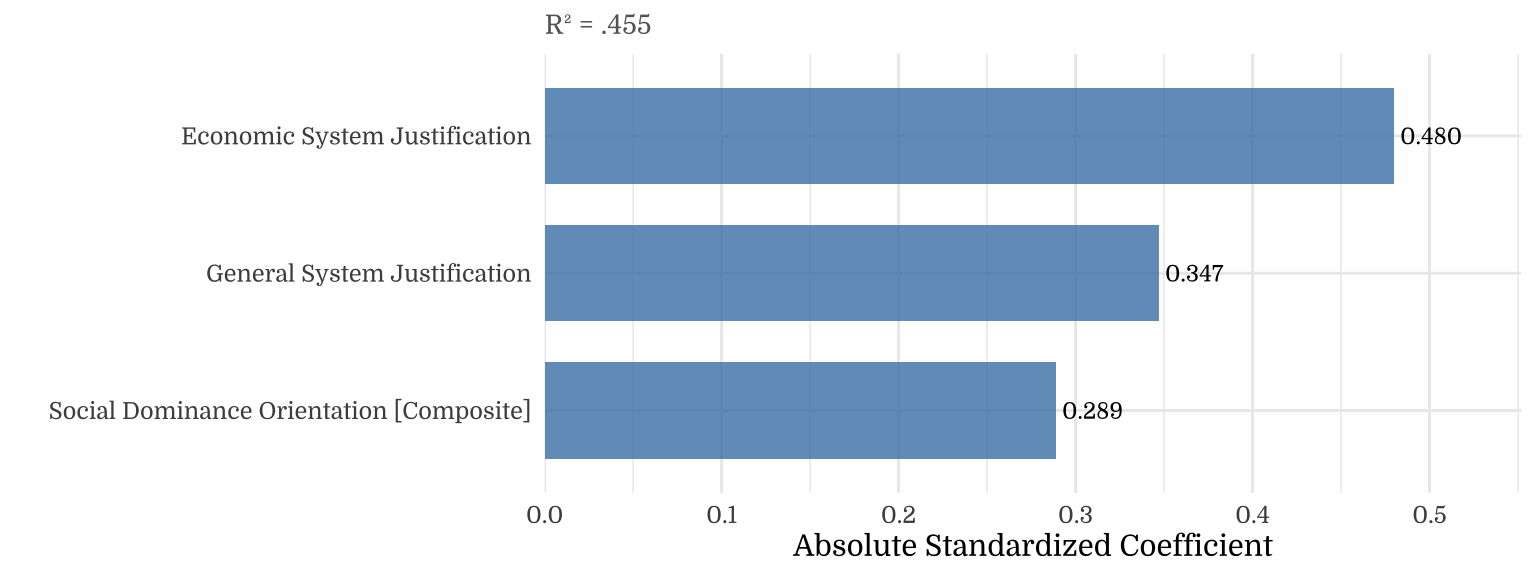
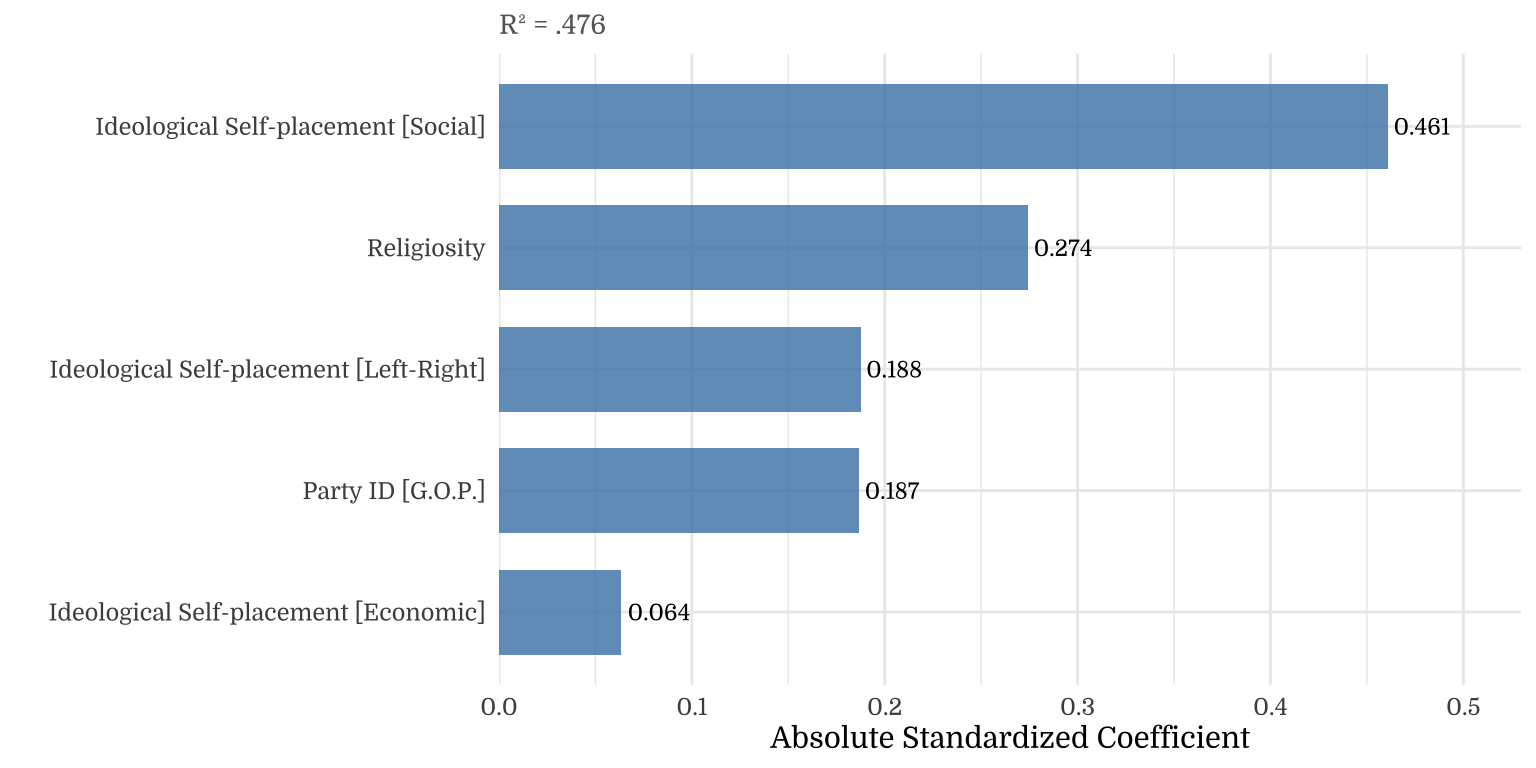
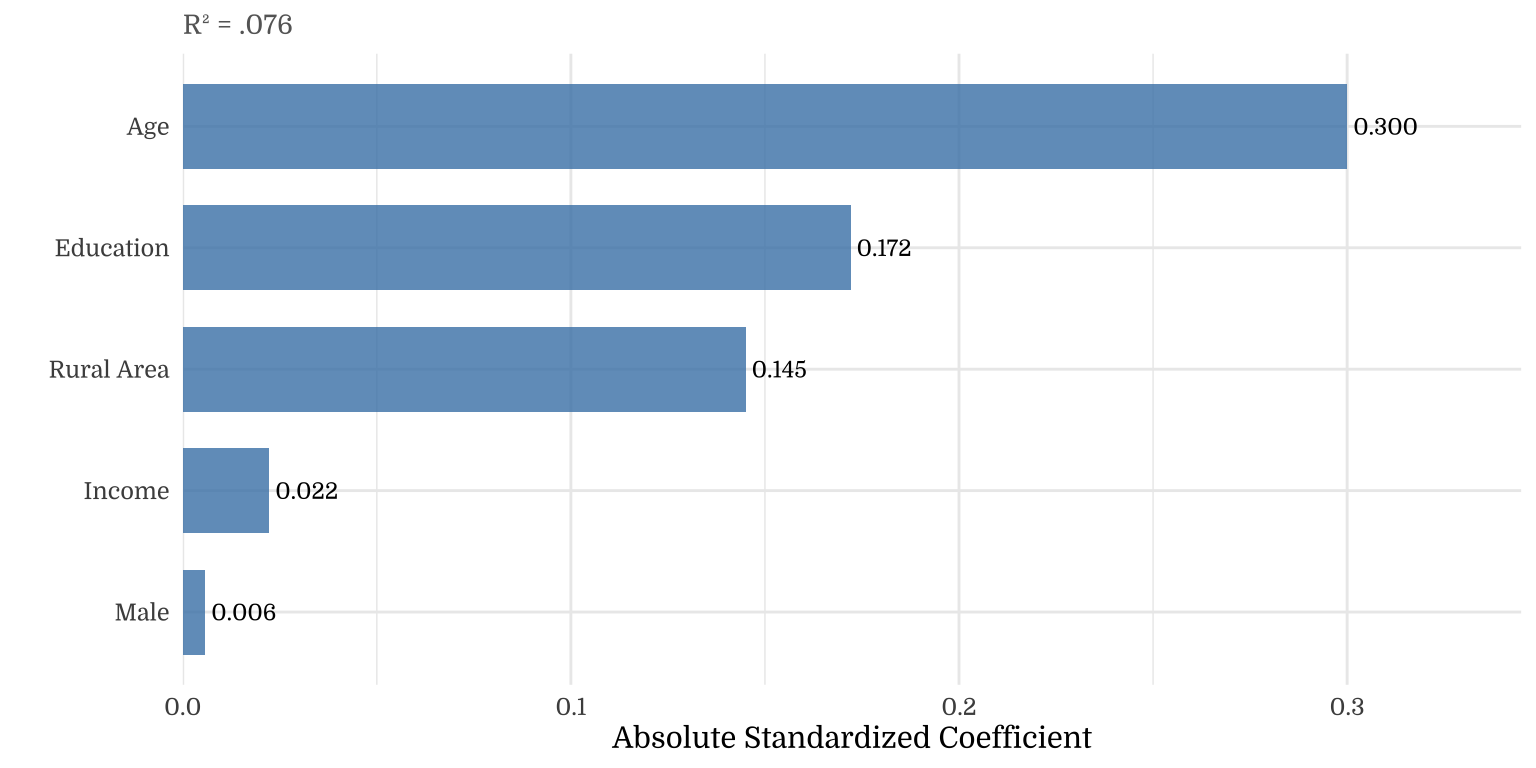
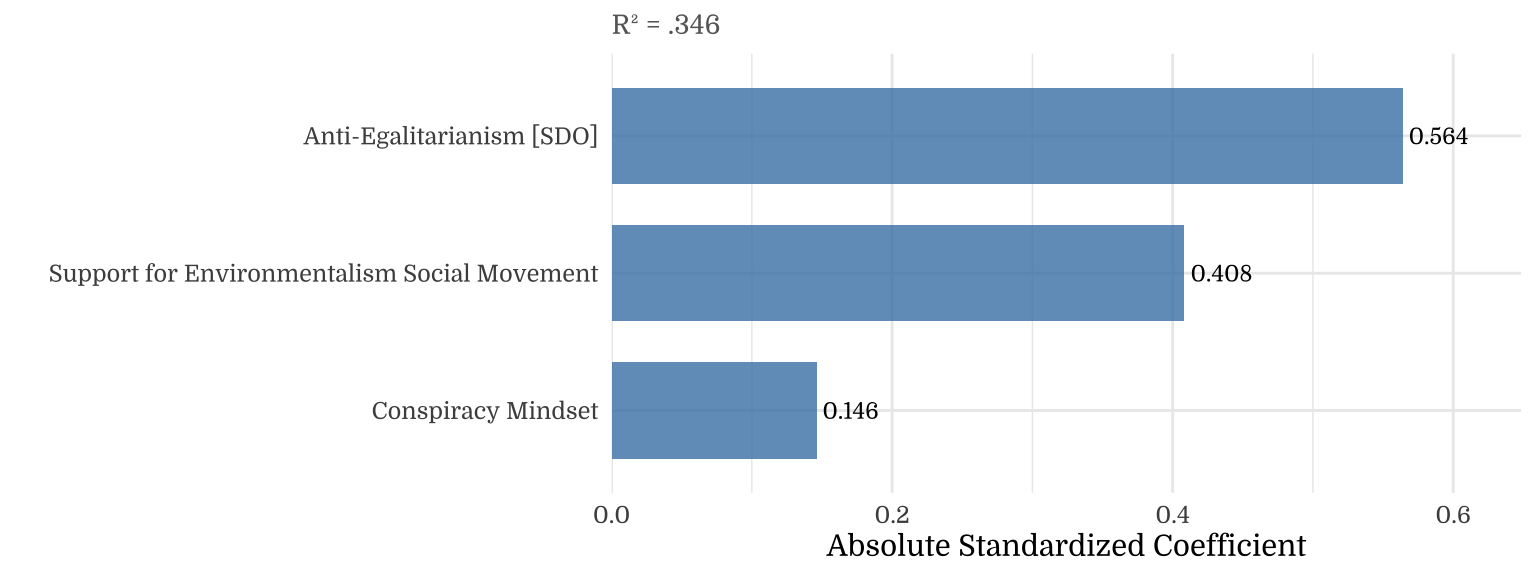
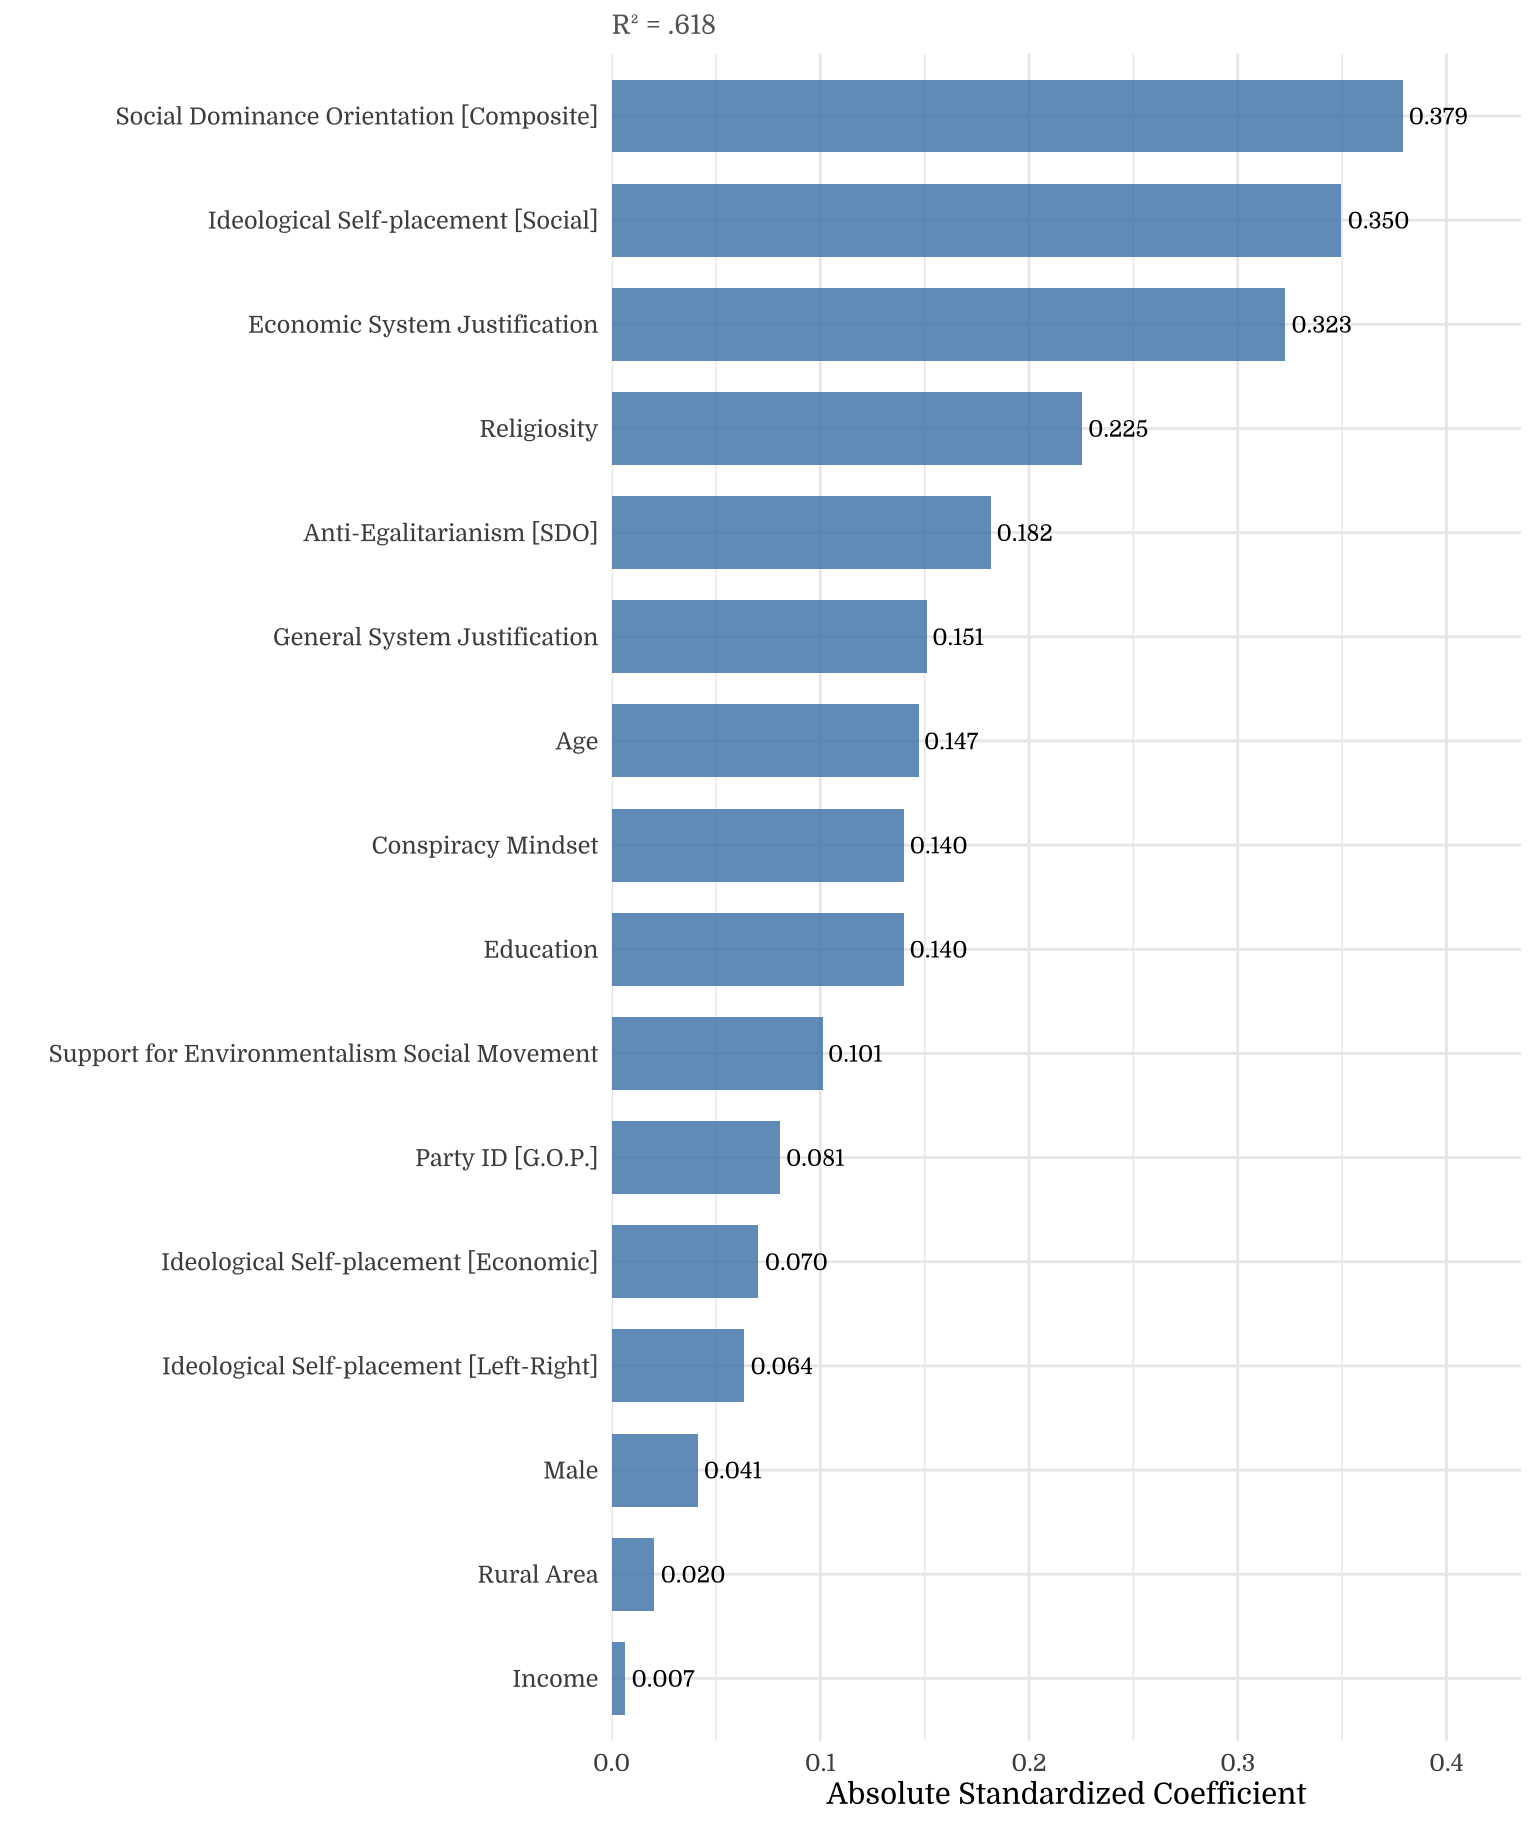
| Variable Group | # Predictors | R² |
|---|---|---|
| Political Psychology | 3 | .455 |
| Ideology & Partisanship | 5 | .476 |
| Demographics | 5 | .076 |
| Attitudes | 3 | .346 |
| Everything | 16 | .618 |
3.1 Social Class
Note on the Raincloud Plots