| year | N | N (valid facet) | Mean | SD |
|---|---|---|---|---|
| 2016 | 1500 | 1500 | 5.20 | 1.47 |
| 2018 | 2759 | 2759 | 5.05 | 1.57 |
| 2020 | 2000 | 2000 | 5.00 | 1.43 |
Right-Wing Authoritarianism — Cross-Year Comparison
A Politico-Psychological Analysis Across Waves (Multi-Facet)
2 Study Overview
2.0.1 2016 Sample
2.0.2 Sample
N=1500
To conduct a exploratory and a confirmatory large surveys during the general election, we hired a professional survey firm (SSI, a US-based market research company that recruits participants from a panel of 7,139,027 American citizens; more information can be found at www.surveysampling.com (now https://www.dynata.com/) to recruit a nationally representative sample of 1,500 Americans (50.7% women) who completed study materials during the general election from August 16-September 9, 2016. (Information about sampling and exclusion criteria is included in the Supplement). The age distribution was as follows: 18-24 (12.9%), 25-34 (17.6%), 35-44 (17.5%), 45-54 (19.5%), 55-65 (15.6%) and older than 65 (16.9%). The ethnic breakdown was: White/European American (82.5%), Black/African American (7.7%), Latino (5.9%) and “Other” (4.0%). Concerning religion, 67.6% identified as Christian, 17.1% as religiously affiliated but not Christian, and 15.3% as Atheist/Agnostic. With respect to education 35.1% indicated “high school only or lower,” 31.4 % indicated “some college,” and 33.6% indicated having received a “Bachelor” or “Graduate” degree. 2424 participants were directed to the survey, 1885 of which finished the survey (attrition rate 22%).
We followed recommendations to minimize the problem of careless responding in online studies. Specifically, we employed 10 random attention questions and time controls to check for data quality. There were 385 participants who failed more than one attention check or finished the survey in under ~22 minutes and were therefore excluded from the sample. For the 1500 participants who successfully finished the survey, completion time was 67 minutes on average (MD: 51min).
2.0.3 2018 Sample
2.0.4 Sample
N=TBD
Sample description for the 2018 PPBS CINT Post-election study to be added.
2.0.5 2020 Sample
2.0.6 Sample
N=TBD
Sample description for the 2020 PPBS CINT study to be added.
3 Descriptives
3.1 Overall + Subfacet Descriptives
| year | Facet | N | Mean | SD | Median |
|---|---|---|---|---|---|
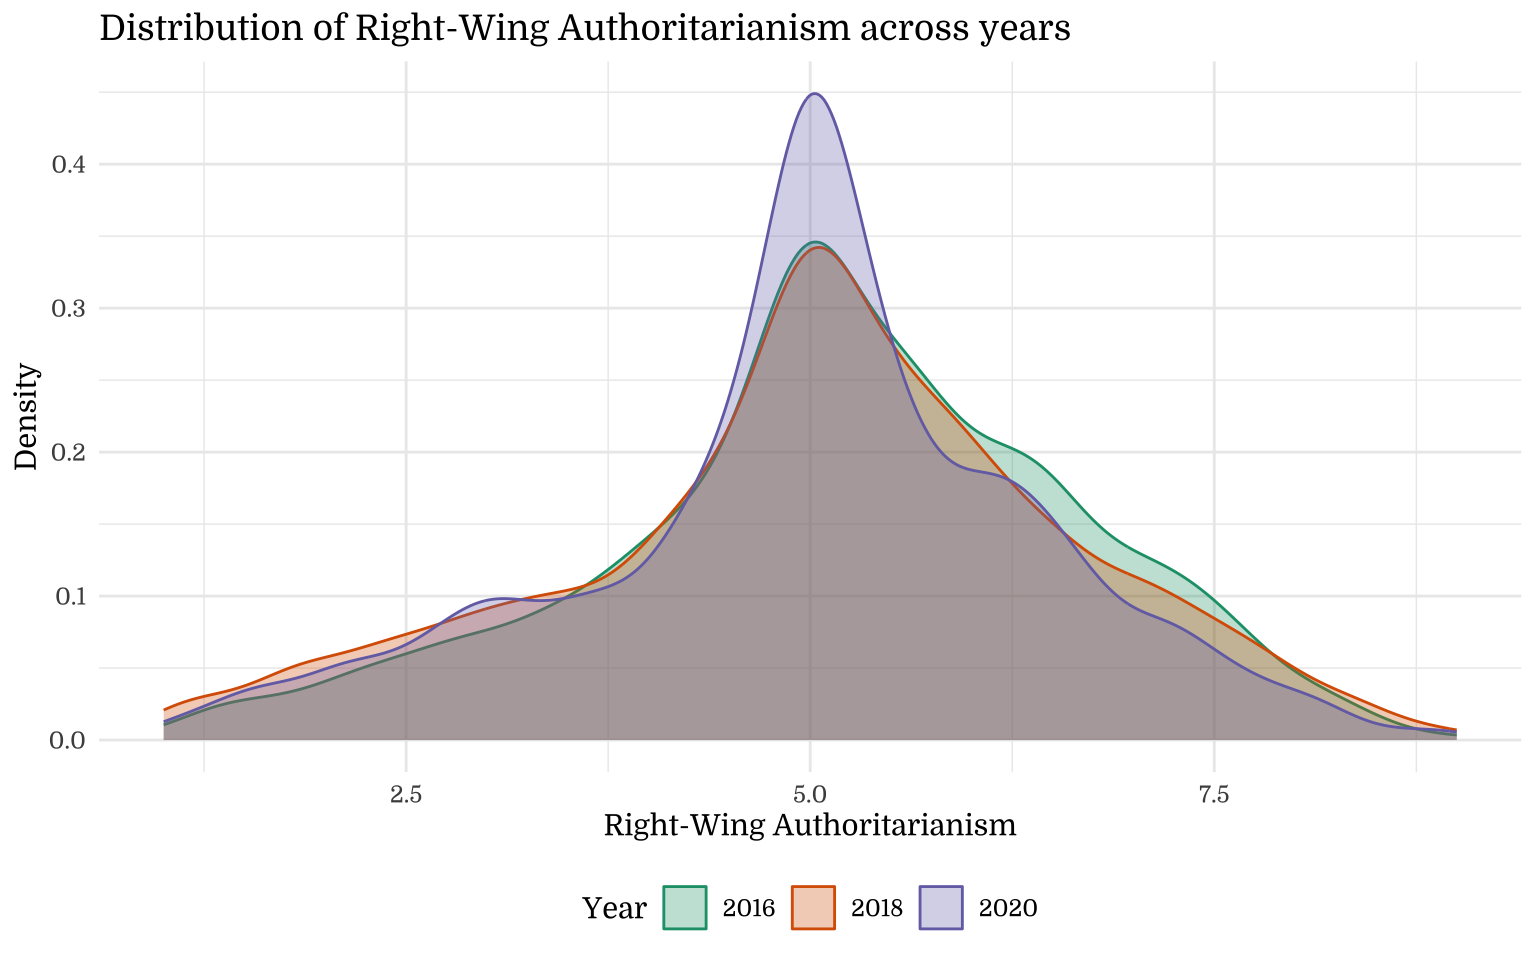
| 2016 | RWA | 1500 | 5.20 | 1.47 | 5.17 |
| 2018 | RWA | 2759 | 5.05 | 1.57 | 5.08 |
| 2020 | RWA | 2000 | 5.00 | 1.43 | 5.00 |
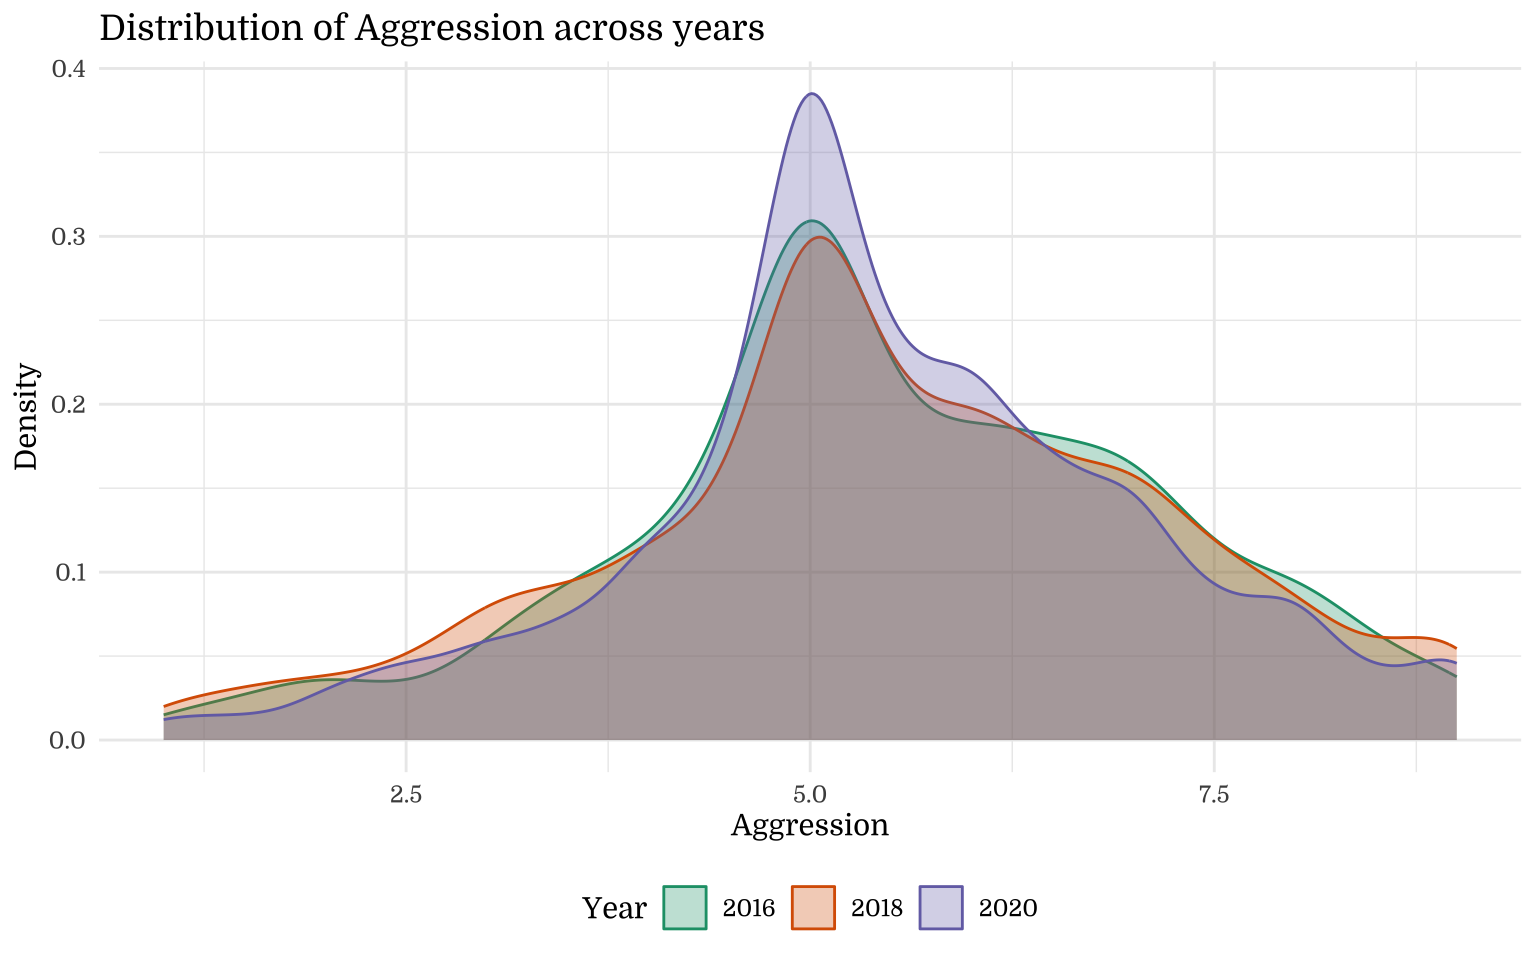
| 2016 | Aggression | 1500 | 5.52 | 1.66 | 5.25 |
| 2018 | Aggression | 2759 | 5.49 | 1.75 | 5.50 |
| 2020 | Aggression | 2000 | 5.49 | 1.57 | 5.25 |
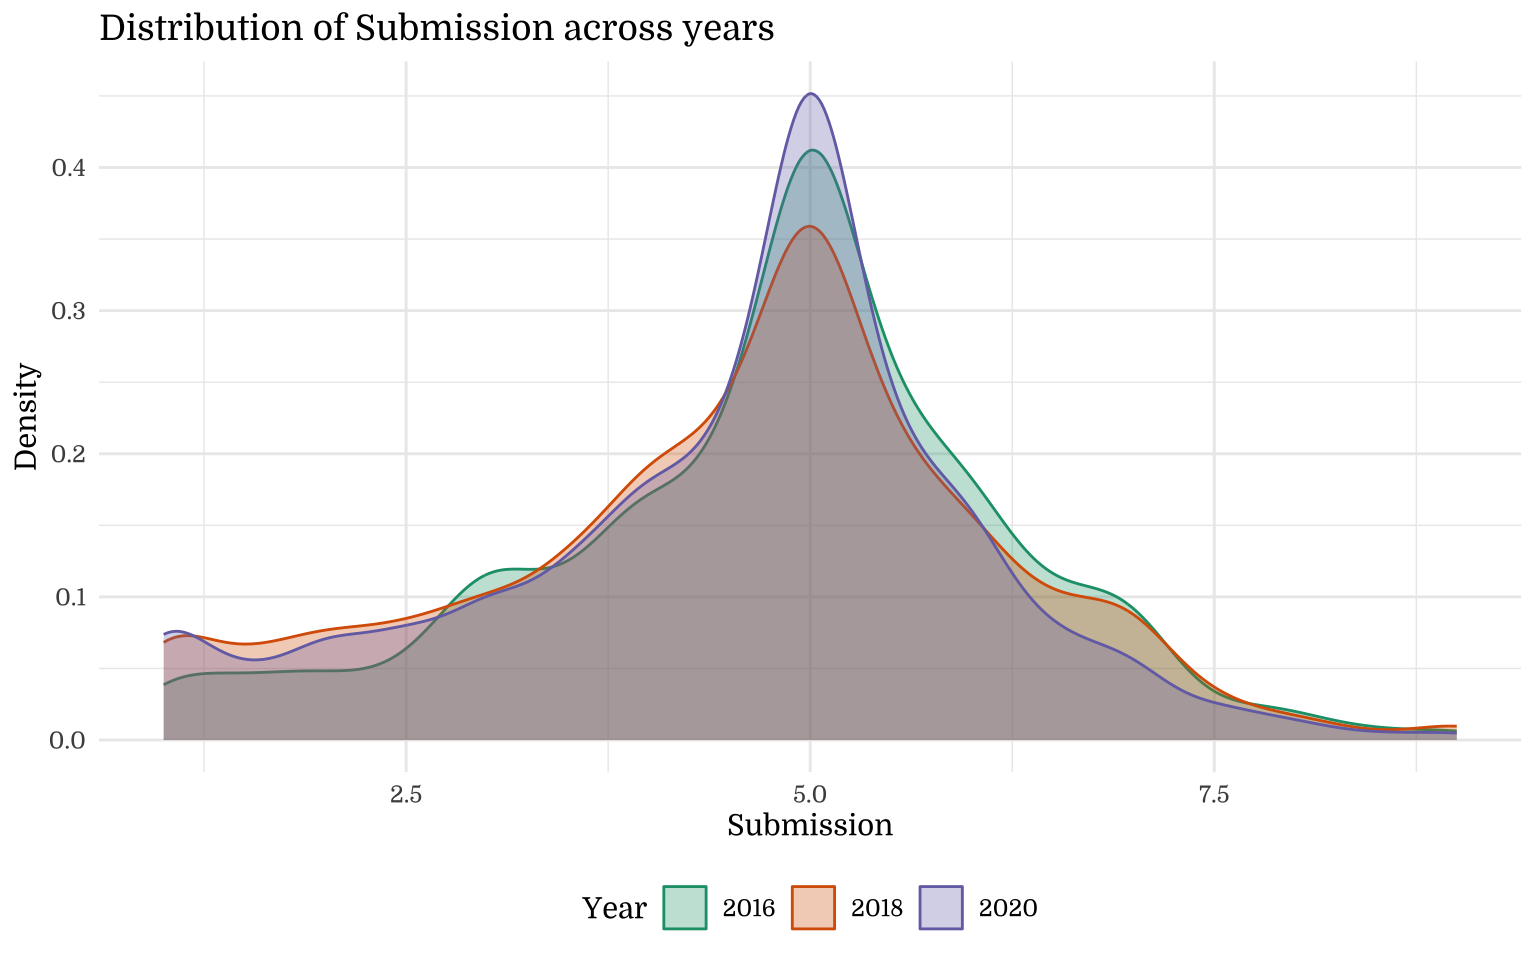
| 2016 | Submission | 1500 | 4.76 | 1.48 | 5.00 |
| 2018 | Submission | 2759 | 4.55 | 1.62 | 4.75 |
| 2020 | Submission | 2000 | 4.52 | 1.52 | 5.00 |
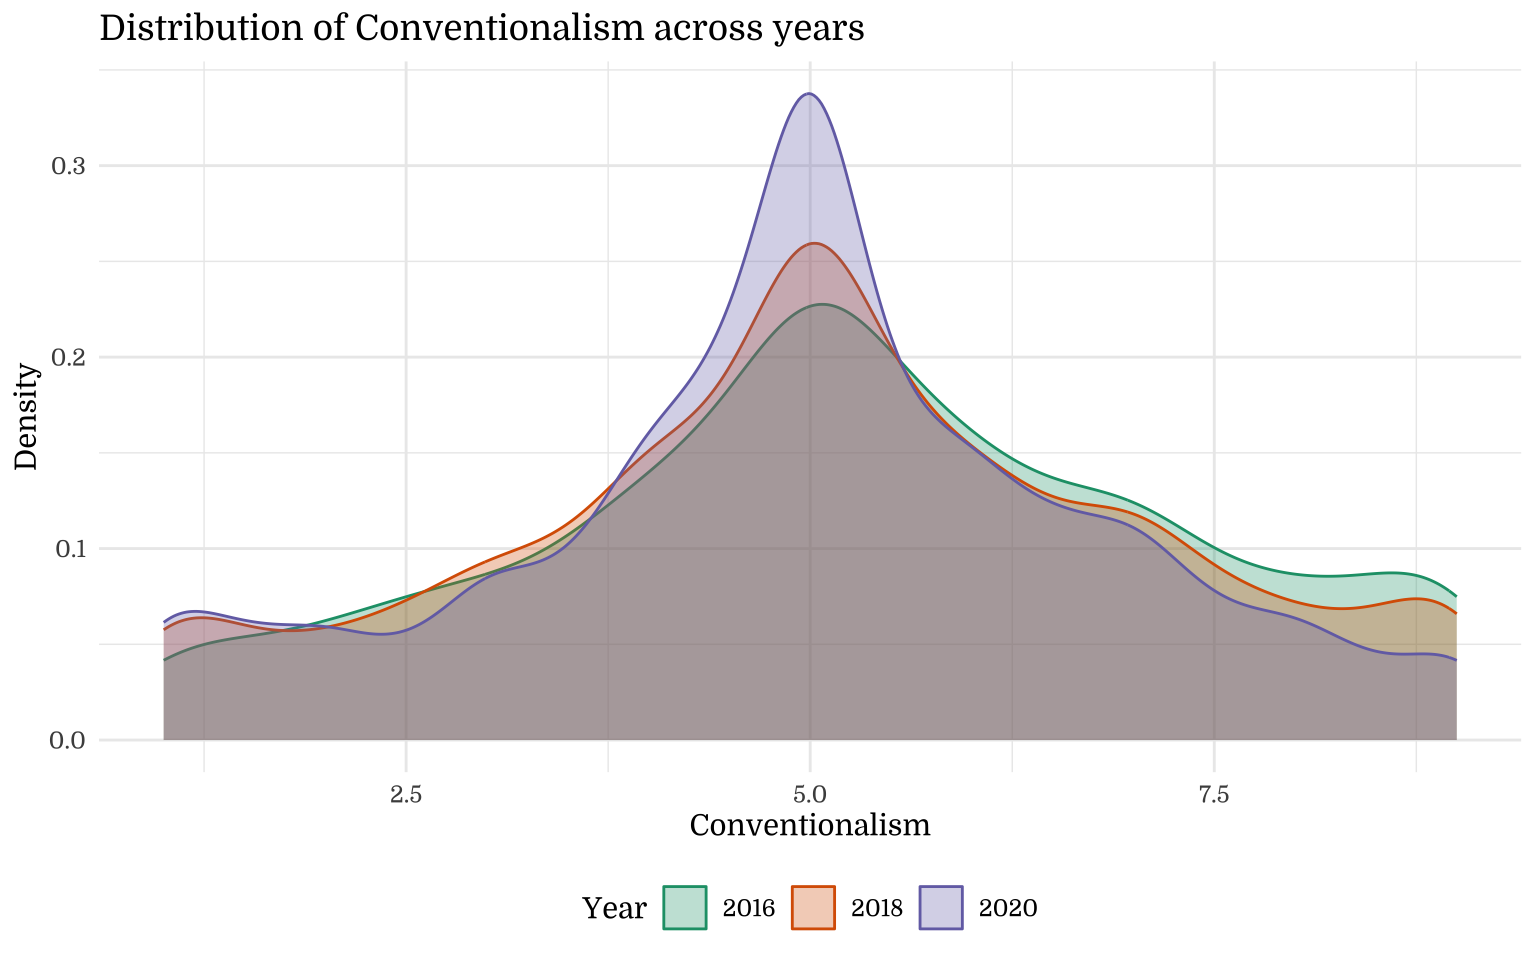
| 2016 | Conventionalism | 1500 | 5.30 | 2.03 | 5.25 |
| 2018 | Conventionalism | 2759 | 5.12 | 2.00 | 5.00 |
| 2020 | Conventionalism | 2000 | 4.99 | 1.86 | 5.00 |
3.2 Density Plots
3.2.1 Overall
3.2.2 Aggression
3.2.3 Submission
3.2.4 Conventionalism
4 Demographics
4.1 Sex
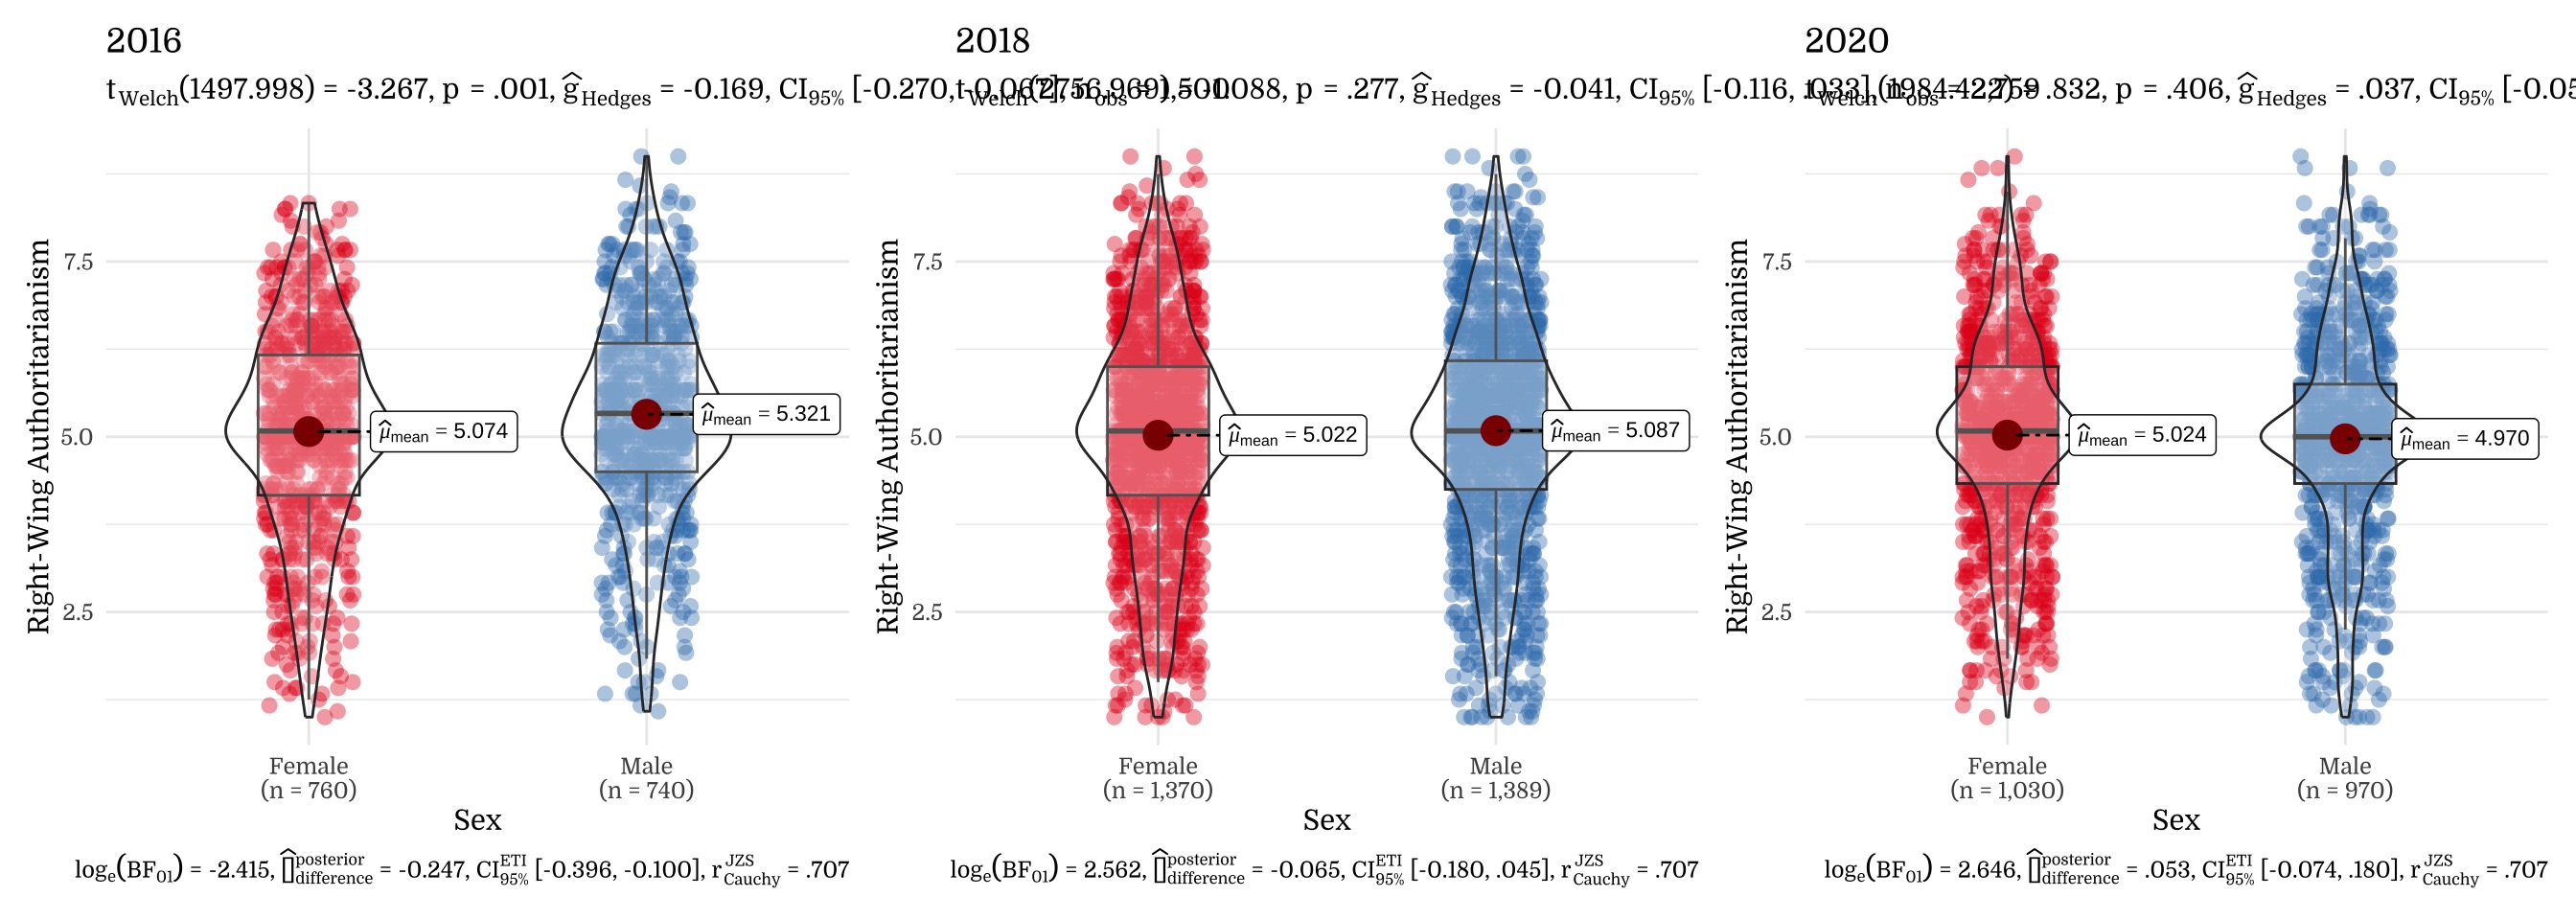
4.1.1 Overall: Pooled Model
| Right-Wing Authoritarianism | |||
|---|---|---|---|
| Predictors | Estimates | CI | p |
| (Intercept) | 5.07 | 4.97 – 5.18 | <.001 |
| Sex [Male] | 0.25 | 0.09 – 0.40 | .001 |
| year [2018] | -0.05 | -0.19 – 0.08 | .442 |
| year [2020] | -0.05 | -0.19 – 0.09 | .484 |
| Sex [Male] × year [2018] | -0.18 | -0.37 – 0.01 | .059 |
| Sex [Male] × year [2020] | -0.30 | -0.50 – -0.10 | .003 |
| Observations | 6259 | ||
| R2 / R2 adjusted | .004 / .004 | ||
4.1.2 Overall: Raincloud
4.1.3 Aggression: Sex Model
| Aggression | |||
|---|---|---|---|
| Predictors | Estimates | CI | p |
| (Intercept) | 5.45 | 5.33 – 5.57 | <.001 |
| Sex [Male] | 0.15 | -0.02 – 0.32 | .091 |
| year [2018] | 0.08 | -0.07 – 0.22 | .321 |
| year [2020] | 0.11 | -0.05 – 0.27 | .165 |
| Sex [Male] × year [2018] | -0.23 | -0.44 – -0.01 | .036 |
| Sex [Male] × year [2020] | -0.30 | -0.53 – -0.08 | .008 |
| Observations | 6259 | ||
| R2 / R2 adjusted | .002 / .001 | ||
4.1.4 Submission: Sex Model
| Submission | |||
|---|---|---|---|
| Predictors | Estimates | CI | p |
| (Intercept) | 4.66 | 4.55 – 4.78 | <.001 |
| Sex [Male] | 0.20 | 0.04 – 0.35 | .014 |
| year [2018] | -0.20 | -0.34 – -0.06 | .004 |
| year [2020] | -0.17 | -0.31 – -0.02 | .026 |
| Sex [Male] × year [2018] | -0.02 | -0.22 – 0.17 | .830 |
| Sex [Male] × year [2020] | -0.16 | -0.37 – 0.04 | .122 |
| Observations | 6259 | ||
| R2 / R2 adjusted | .006 / .006 | ||
4.1.5 Conventionalism: Sex Model
| Conventionalism | |||
|---|---|---|---|
| Predictors | Estimates | CI | p |
| (Intercept) | 5.10 | 4.97 – 5.24 | <.001 |
| Sex [Male] | 0.40 | 0.20 – 0.60 | <.001 |
| year [2018] | -0.03 | -0.21 – 0.14 | .722 |
| year [2020] | -0.10 | -0.28 – 0.09 | .303 |
| Sex [Male] × year [2018] | -0.30 | -0.55 – -0.05 | .017 |
| Sex [Male] × year [2020] | -0.43 | -0.69 – -0.17 | .001 |
| Observations | 6259 | ||
| R2 / R2 adjusted | .006 / .005 | ||
4.2 Age
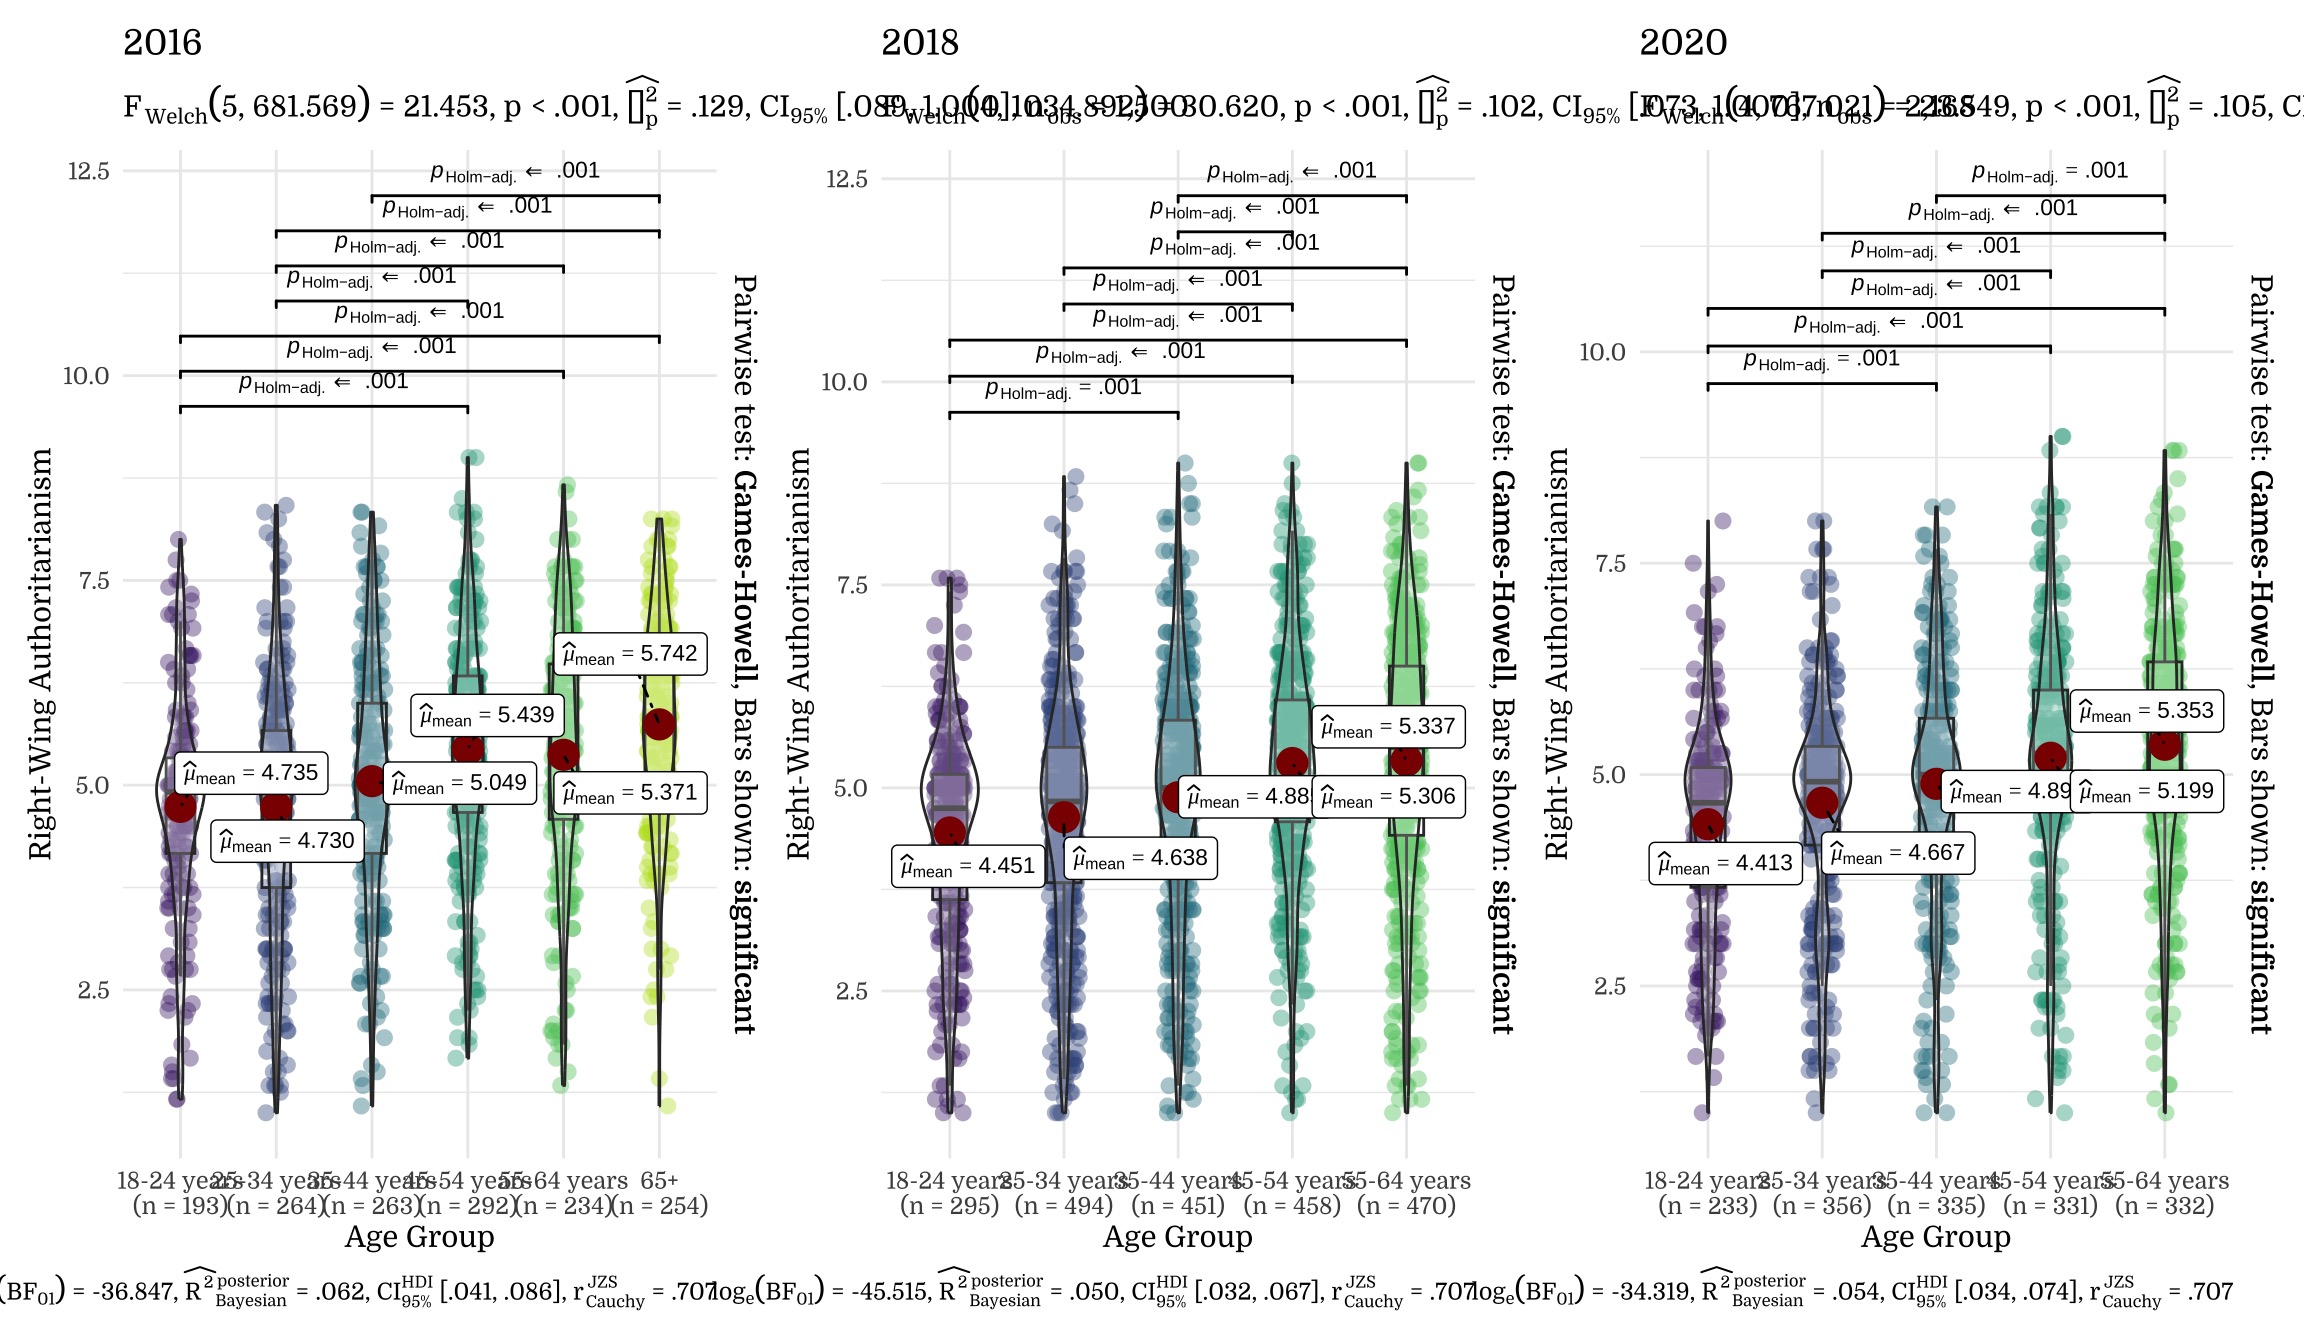
4.2.1 Overall: Pooled Model
| Right-Wing Authoritarianism | |||
|---|---|---|---|
| Predictors | Estimates | CI | p |
| (Intercept) | 4.74 | 4.53 – 4.94 | <.001 |
| Age25-34 years | -0.01 | -0.28 – 0.27 | .968 |
| Age35-44 years | 0.31 | 0.04 – 0.59 | .024 |
| Age45-54 years | 0.70 | 0.44 – 0.97 | <.001 |
| Age55-64 years | 0.64 | 0.36 – 0.91 | <.001 |
| Age [65+] | 1.01 | 0.73 – 1.28 | <.001 |
| Age [65+ years] | 0.84 | 0.60 – 1.07 | <.001 |
| year [2018] | -0.28 | -0.55 – -0.02 | .036 |
| year [2020] | -0.32 | -0.60 – -0.04 | .024 |
| Age25-34 years:year2018 | 0.19 | -0.15 – 0.54 | .273 |
| Age35-44 years:year2018 | 0.12 | -0.23 – 0.47 | .495 |
| Age45-54 years:year2018 | 0.15 | -0.19 – 0.49 | .385 |
| Age55-64 years:year2018 | 0.25 | -0.10 – 0.60 | .163 |
| Age [65+ years] × year [2018] |
0.12 | -0.19 – 0.43 | .441 |
| Age25-34 years:year2020 | 0.26 | -0.10 – 0.62 | .161 |
| Age35-44 years:year2020 | 0.16 | -0.20 – 0.53 | .378 |
| Age45-54 years:year2020 | 0.08 | -0.28 – 0.44 | .654 |
| Age55-64 years:year2020 | 0.30 | -0.07 – 0.68 | .108 |
| Observations | 6259 | ||
| R2 / R2 adjusted | .056 / .053 | ||
4.2.2 Overall: Raincloud
4.2.3 Aggression: Age Model
| Aggression | |||
|---|---|---|---|
| Predictors | Estimates | CI | p |
| (Intercept) | 5.02 | 4.79 – 5.25 | <.001 |
| Age25-34 years | 0.22 | -0.08 – 0.53 | .156 |
| Age35-44 years | 0.42 | 0.12 – 0.73 | .007 |
| Age45-54 years | 0.79 | 0.49 – 1.09 | <.001 |
| Age55-64 years | 0.50 | 0.19 – 0.82 | .002 |
| Age [65+] | 0.94 | 0.64 – 1.25 | <.001 |
| Age [65+ years] | 0.53 | 0.26 – 0.79 | <.001 |
| year [2018] | 0.00 | -0.30 – 0.30 | .988 |
| year [2020] | 0.02 | -0.29 – 0.33 | .904 |
| Age25-34 years:year2018 | -0.13 | -0.51 – 0.26 | .526 |
| Age35-44 years:year2018 | -0.17 | -0.56 – 0.22 | .406 |
| Age45-54 years:year2018 | -0.10 | -0.49 – 0.28 | .604 |
| Age55-64 years:year2018 | 0.27 | -0.13 – 0.67 | .180 |
|
Age [65+ years] × year [2018] |
0.23 | -0.13 – 0.58 | .208 |
| Age25-34 years:year2020 | -0.07 | -0.48 – 0.34 | .737 |
| Age35-44 years:year2020 | -0.04 | -0.46 – 0.37 | .835 |
| Age45-54 years:year2020 | -0.13 | -0.53 – 0.28 | .545 |
| Age55-64 years:year2020 | 0.33 | -0.09 – 0.75 | .119 |
| Observations | 6259 | ||
| R2 / R2 adjusted | .032 / .029 | ||
4.2.4 Submission: Age Model
| Submission | |||
|---|---|---|---|
| Predictors | Estimates | CI | p |
| (Intercept) | 4.58 | 4.36 – 4.79 | <.001 |
| Age25-34 years | -0.21 | -0.49 – 0.08 | .150 |
| Age35-44 years | 0.08 | -0.20 – 0.37 | .580 |
| Age45-54 years | 0.38 | 0.10 – 0.66 | .008 |
| Age55-64 years | 0.32 | 0.02 – 0.61 | .034 |
| Age [65+] | 0.51 | 0.22 – 0.79 | .001 |
| Age [65+ years] | 0.67 | 0.42 – 0.91 | <.001 |
| year [2018] | -0.54 | -0.82 – -0.26 | <.001 |
| year [2020] | -0.56 | -0.85 – -0.27 | <.001 |
| Age25-34 years:year2018 | 0.43 | 0.07 – 0.79 | .020 |
| Age35-44 years:year2018 | 0.33 | -0.04 – 0.69 | .077 |
| Age45-54 years:year2018 | 0.39 | 0.03 – 0.74 | .034 |
| Age55-64 years:year2018 | 0.40 | 0.04 – 0.77 | .032 |
|
Age [65+ years] × year [2018] |
0.09 | -0.24 – 0.42 | .585 |
| Age25-34 years:year2020 | 0.49 | 0.11 – 0.87 | .012 |
| Age35-44 years:year2020 | 0.40 | 0.01 – 0.78 | .043 |
| Age45-54 years:year2020 | 0.31 | -0.07 – 0.69 | .113 |
| Age55-64 years:year2020 | 0.41 | 0.02 – 0.80 | .039 |
| Observations | 6259 | ||
| R2 / R2 adjusted | .031 / .029 | ||
4.2.5 Conventionalism: Age Model
| Conventionalism | |||
|---|---|---|---|
| Predictors | Estimates | CI | p |
| (Intercept) | 4.61 | 4.34 – 4.88 | <.001 |
| Age25-34 years | -0.03 | -0.38 – 0.32 | .872 |
| Age35-44 years | 0.44 | 0.08 – 0.79 | .016 |
| Age45-54 years | 0.94 | 0.59 – 1.28 | <.001 |
| Age55-64 years | 1.09 | 0.73 – 1.45 | <.001 |
| Age [65+] | 1.57 | 1.21 – 1.92 | <.001 |
| Age [65+ years] | 1.32 | 1.02 – 1.63 | <.001 |
| year [2018] | -0.31 | -0.66 – 0.03 | .074 |
| year [2020] | -0.42 | -0.79 – -0.06 | .022 |
| Age25-34 years:year2018 | 0.28 | -0.17 – 0.72 | .225 |
| Age35-44 years:year2018 | 0.20 | -0.25 – 0.65 | .384 |
| Age45-54 years:year2018 | 0.17 | -0.27 – 0.61 | .455 |
| Age55-64 years:year2018 | 0.08 | -0.38 – 0.53 | .743 |
|
Age [65+ years] × year [2018] |
0.05 | -0.35 – 0.46 | .803 |
| Age25-34 years:year2020 | 0.36 | -0.11 – 0.83 | .135 |
| Age35-44 years:year2020 | 0.14 | -0.33 – 0.62 | .559 |
| Age45-54 years:year2020 | 0.07 | -0.40 – 0.54 | .781 |
| Age55-64 years:year2020 | 0.17 | -0.31 – 0.65 | .486 |
| Observations | 6259 | ||
| R2 / R2 adjusted | .069 / .066 | ||
4.3 Income
4.3.1 Overall: Pooled Model
| Right-Wing Authoritarianism | |||
|---|---|---|---|
| Predictors | Estimates | CI | p |
| (Intercept) | 5.02 | 4.80 – 5.24 | <.001 |
| Income [$15,000-$24,999] | 0.24 | -0.07 – 0.55 | .137 |
| Income [$25,000-$34,999] | 0.26 | -0.05 – 0.58 | .097 |
| Income [$35,000-$49,999] | 0.18 | -0.11 – 0.48 | .225 |
| Income [$50,000-$74,999] | 0.23 | -0.05 – 0.51 | .101 |
| Income [$75,000-$99,999] | 0.28 | -0.03 – 0.59 | .072 |
| Income [$100,000-$149,999] |
0.09 | -0.23 – 0.41 | .578 |
| Income [$150,000 +] | -0.02 | -0.40 – 0.35 | .896 |
| year [2018] | -0.05 | -0.33 – 0.22 | .711 |
| year [2020] | -0.02 | -0.32 – 0.27 | .878 |
| Income [$15,000-$24,999] × year [2018] |
-0.23 | -0.62 – 0.17 | .261 |
| Income [$25,000-$34,999] × year [2018] |
0.01 | -0.39 – 0.41 | .950 |
| Income [$35,000-$49,999] × year [2018] |
0.09 | -0.29 – 0.46 | .649 |
| Income [$50,000-$74,999] × year [2018] |
0.09 | -0.26 – 0.44 | .609 |
| Income [$75,000-$99,999] × year [2018] |
-0.22 | -0.60 – 0.16 | .259 |
| Income [$100,000-$149,999] × year [2018] |
-0.25 | -0.64 – 0.14 | .213 |
| Income [$150,000 +] × year [2018] |
-0.13 | -0.57 – 0.31 | .564 |
| Income [$15,000-$24,999] × year [2020] |
-0.03 | -0.45 – 0.40 | .906 |
| Income [$25,000-$34,999] × year [2020] |
-0.18 | -0.60 – 0.25 | .411 |
| Income [$35,000-$49,999] × year [2020] |
-0.05 | -0.45 – 0.35 | .800 |
| Income [$50,000-$74,999] × year [2020] |
-0.29 | -0.67 – 0.08 | .125 |
| Income [$75,000-$99,999] × year [2020] |
-0.30 | -0.71 – 0.11 | .152 |
| Income [$100,000-$149,999] × year [2020] |
-0.20 | -0.61 – 0.21 | .342 |
| Income [$150,000 +] × year [2020] |
-0.09 | -0.55 – 0.37 | .694 |
| Observations | 6259 | ||
| R2 / R2 adjusted | .012 / .008 | ||
4.3.2 Aggression: Income Model
| Aggression | |||
|---|---|---|---|
| Predictors | Estimates | CI | p |
| (Intercept) | 5.31 | 5.07 – 5.56 | <.001 |
| Income [$15,000-$24,999] | 0.27 | -0.07 – 0.62 | .124 |
| Income [$25,000-$34,999] | 0.29 | -0.05 – 0.64 | .097 |
| Income [$35,000-$49,999] | 0.31 | -0.02 – 0.64 | .063 |
| Income [$50,000-$74,999] | 0.27 | -0.05 – 0.58 | .094 |
| Income [$75,000-$99,999] | 0.20 | -0.14 – 0.54 | .250 |
|
Income [$100,000-$149,999] |
0.11 | -0.24 – 0.47 | .528 |
| Income [$150,000 +] | 0.14 | -0.28 – 0.55 | .523 |
| year [2018] | 0.04 | -0.27 – 0.35 | .796 |
| year [2020] | 0.03 | -0.30 – 0.35 | .868 |
|
Income [$15,000-$24,999] × year [2018] |
-0.30 | -0.74 – 0.14 | .185 |
|
Income [$25,000-$34,999] × year [2018] |
-0.06 | -0.50 – 0.39 | .799 |
|
Income [$35,000-$49,999] × year [2018] |
-0.04 | -0.46 – 0.37 | .848 |
|
Income [$50,000-$74,999] × year [2018] |
0.09 | -0.30 – 0.48 | .656 |
|
Income [$75,000-$99,999] × year [2018] |
0.03 | -0.40 – 0.45 | .892 |
|
Income [$100,000-$149,999] × year [2018] |
-0.15 | -0.59 – 0.28 | .490 |
|
Income [$150,000 +] × year [2018] |
-0.19 | -0.68 – 0.30 | .440 |
|
Income [$15,000-$24,999] × year [2020] |
0.09 | -0.38 – 0.56 | .714 |
|
Income [$25,000-$34,999] × year [2020] |
-0.12 | -0.59 – 0.36 | .622 |
|
Income [$35,000-$49,999] × year [2020] |
-0.04 | -0.48 – 0.41 | .876 |
|
Income [$50,000-$74,999] × year [2020] |
-0.11 | -0.53 – 0.30 | .590 |
|
Income [$75,000-$99,999] × year [2020] |
-0.13 | -0.58 – 0.33 | .588 |
|
Income [$100,000-$149,999] × year [2020] |
0.04 | -0.42 – 0.50 | .871 |
|
Income [$150,000 +] × year [2020] |
-0.11 | -0.62 – 0.40 | .675 |
| Observations | 6259 | ||
| R2 / R2 adjusted | .006 / .003 | ||
4.3.3 Submission: Income Model
| Submission | |||
|---|---|---|---|
| Predictors | Estimates | CI | p |
| (Intercept) | 4.67 | 4.44 – 4.90 | <.001 |
| Income [$15,000-$24,999] | 0.18 | -0.14 – 0.50 | .279 |
| Income [$25,000-$34,999] | 0.14 | -0.18 – 0.46 | .396 |
| Income [$35,000-$49,999] | 0.06 | -0.24 – 0.37 | .680 |
| Income [$50,000-$74,999] | 0.16 | -0.13 – 0.45 | .287 |
| Income [$75,000-$99,999] | 0.19 | -0.12 – 0.51 | .230 |
|
Income [$100,000-$149,999] |
0.02 | -0.31 – 0.35 | .903 |
| Income [$150,000 +] | -0.17 | -0.56 – 0.21 | .377 |
| year [2018] | -0.09 | -0.38 – 0.19 | .521 |
| year [2020] | -0.03 | -0.33 – 0.28 | .869 |
|
Income [$15,000-$24,999] × year [2018] |
-0.22 | -0.63 – 0.18 | .283 |
|
Income [$25,000-$34,999] × year [2018] |
0.09 | -0.32 – 0.50 | .668 |
|
Income [$35,000-$49,999] × year [2018] |
0.10 | -0.29 – 0.48 | .614 |
|
Income [$50,000-$74,999] × year [2018] |
0.01 | -0.35 – 0.37 | .950 |
|
Income [$75,000-$99,999] × year [2018] |
-0.25 | -0.65 – 0.14 | .210 |
|
Income [$100,000-$149,999] × year [2018] |
-0.36 | -0.76 – 0.05 | .085 |
|
Income [$150,000 +] × year [2018] |
-0.12 | -0.58 – 0.33 | .593 |
|
Income [$15,000-$24,999] × year [2020] |
-0.12 | -0.56 – 0.32 | .585 |
|
Income [$25,000-$34,999] × year [2020] |
-0.25 | -0.69 – 0.19 | .269 |
|
Income [$35,000-$49,999] × year [2020] |
-0.10 | -0.51 – 0.31 | .637 |
|
Income [$50,000-$74,999] × year [2020] |
-0.38 | -0.76 – 0.01 | .056 |
|
Income [$75,000-$99,999] × year [2020] |
-0.26 | -0.68 – 0.16 | .230 |
|
Income [$100,000-$149,999] × year [2020] |
-0.33 | -0.75 – 0.10 | .131 |
|
Income [$150,000 +] × year [2020] |
-0.03 | -0.51 – 0.44 | .895 |
| Observations | 6259 | ||
| R2 / R2 adjusted | .014 / .010 | ||
4.3.4 Conventionalism: Income Model
| Conventionalism | |||
|---|---|---|---|
| Predictors | Estimates | CI | p |
| (Intercept) | 5.08 | 4.79 – 5.37 | <.001 |
| Income [$15,000-$24,999] | 0.26 | -0.15 – 0.66 | .214 |
| Income [$25,000-$34,999] | 0.36 | -0.05 – 0.77 | .086 |
| Income [$35,000-$49,999] | 0.17 | -0.21 – 0.55 | .385 |
| Income [$50,000-$74,999] | 0.28 | -0.09 – 0.64 | .136 |
| Income [$75,000-$99,999] | 0.45 | 0.05 – 0.85 | .028 |
|
Income [$100,000-$149,999] |
0.14 | -0.28 – 0.56 | .521 |
| Income [$150,000 +] | -0.04 | -0.52 – 0.45 | .883 |
| year [2018] | -0.10 | -0.46 – 0.26 | .574 |
| year [2020] | -0.07 | -0.45 – 0.31 | .717 |
|
Income [$15,000-$24,999] × year [2018] |
-0.16 | -0.67 – 0.36 | .551 |
|
Income [$25,000-$34,999] × year [2018] |
0.01 | -0.51 – 0.53 | .982 |
|
Income [$35,000-$49,999] × year [2018] |
0.20 | -0.29 – 0.69 | .419 |
|
Income [$50,000-$74,999] × year [2018] |
0.17 | -0.28 – 0.63 | .457 |
|
Income [$75,000-$99,999] × year [2018] |
-0.44 | -0.93 – 0.06 | .087 |
|
Income [$100,000-$149,999] × year [2018] |
-0.24 | -0.75 – 0.28 | .366 |
|
Income [$150,000 +] × year [2018] |
-0.07 | -0.65 – 0.50 | .810 |
|
Income [$15,000-$24,999] × year [2020] |
-0.04 | -0.60 – 0.51 | .879 |
|
Income [$25,000-$34,999] × year [2020] |
-0.17 | -0.73 – 0.39 | .553 |
|
Income [$35,000-$49,999] × year [2020] |
-0.02 | -0.54 – 0.50 | .940 |
|
Income [$50,000-$74,999] × year [2020] |
-0.38 | -0.87 – 0.10 | .123 |
|
Income [$75,000-$99,999] × year [2020] |
-0.51 | -1.04 – 0.02 | .061 |
|
Income [$100,000-$149,999] × year [2020] |
-0.31 | -0.85 – 0.23 | .261 |
|
Income [$150,000 +] × year [2020] |
-0.14 | -0.74 – 0.47 | .659 |
| Observations | 6259 | ||
| R2 / R2 adjusted | .012 / .008 | ||
4.4 Ethnicity
4.4.1 Overall: Pooled Model
| Right-Wing Authoritarianism | |||
|---|---|---|---|
| Predictors | Estimates | CI | p |
| (Intercept) | 5.28 | 5.20 – 5.36 | <.001 |
| Ethnicity [Black/African American] |
-0.49 | -0.77 – -0.20 | .001 |
| Ethnicity [Latino] | -0.55 | -0.87 – -0.23 | .001 |
| Ethnicity [Asian/Pacific Islander] |
-0.61 | -1.16 – -0.06 | .031 |
| Ethnicity [Native American] |
0.19 | -0.62 – 1.01 | .642 |
| Ethnicity [Other] | -0.45 | -1.14 – 0.25 | .207 |
| Ethnicity [White] | -0.38 | -1.28 – 0.51 | .401 |
| Ethnicity [Hispanic/Latino] |
-0.94 | -1.89 – 0.01 | .052 |
| Ethnicity [Middle Eastern] |
-0.66 | -2.21 – 0.88 | .400 |
| Ethnicity [Middle Eastern] |
-2.04 | -4.29 – 0.21 | .076 |
| year [2018] | 0.33 | -0.65 – 1.30 | .512 |
| year [2020] | 0.18 | -0.71 – 1.07 | .698 |
| Ethnicity [Black/African American] × year [2018] |
-0.22 | -1.24 – 0.80 | .672 |
| Ethnicity [Asian/Pacific Islander] × year [2018] |
-0.05 | -1.21 – 1.11 | .933 |
| Ethnicity [Native American] × year [2018] |
-0.71 | -2.20 – 0.78 | .350 |
| Ethnicity [Other] × year [2018] |
-1.38 | -2.22 – -0.53 | .001 |
| Ethnicity [White] × year [2018] |
-0.07 | -0.48 – 0.34 | .724 |
| Ethnicity [Black/African American] × year [2020] |
-0.04 | -0.99 – 0.91 | .935 |
| Ethnicity [Asian/Pacific Islander] × year [2020] |
-0.27 | -1.35 – 0.81 | .624 |
| Ethnicity [Native American] × year [2020] |
-1.35 | -2.80 – 0.10 | .069 |
| Observations | 6259 | ||
| R2 / R2 adjusted | .018 / .015 | ||
4.5 Area
4.5.1 Overall: Pooled Model
| Right-Wing Authoritarianism | |||
|---|---|---|---|
| Predictors | Estimates | CI | p |
| (Intercept) | 5.01 | 4.92 – 5.10 | <.001 |
| Area [Rural] | 0.51 | 0.35 – 0.67 | <.001 |
| Area [Suburban] | 0.14 | -0.01 – 0.30 | .064 |
| year [2018] | -0.16 | -0.30 – -0.01 | .032 |
| year [2020] | -0.22 | -0.37 – -0.06 | .006 |
| Area [Rural] × year [2018] |
0.07 | -0.15 – 0.29 | .533 |
| Area [Suburban] × year [2018] |
-0.02 | -0.22 – 0.18 | .854 |
| Area [Rural] × year [2020] |
0.11 | -0.13 – 0.36 | .367 |
| Observations | 6259 | ||
| R2 / R2 adjusted | .025 / .024 | ||
5 Political Orientation
5.1 Overall Ideology Regression
5.1.1 Regression Table
| Right-Wing Authoritarianism → Ideology (Pooled) | Right-Wing Authoritarianism → Ideology (2016) | Right-Wing Authoritarianism → Ideology (2018) | Right-Wing Authoritarianism → Ideology (2020) | |||||||||
|---|---|---|---|---|---|---|---|---|---|---|---|---|
| Predictors | Estimates | CI | p | Estimates | CI | p | Estimates | CI | p | Estimates | CI | p |
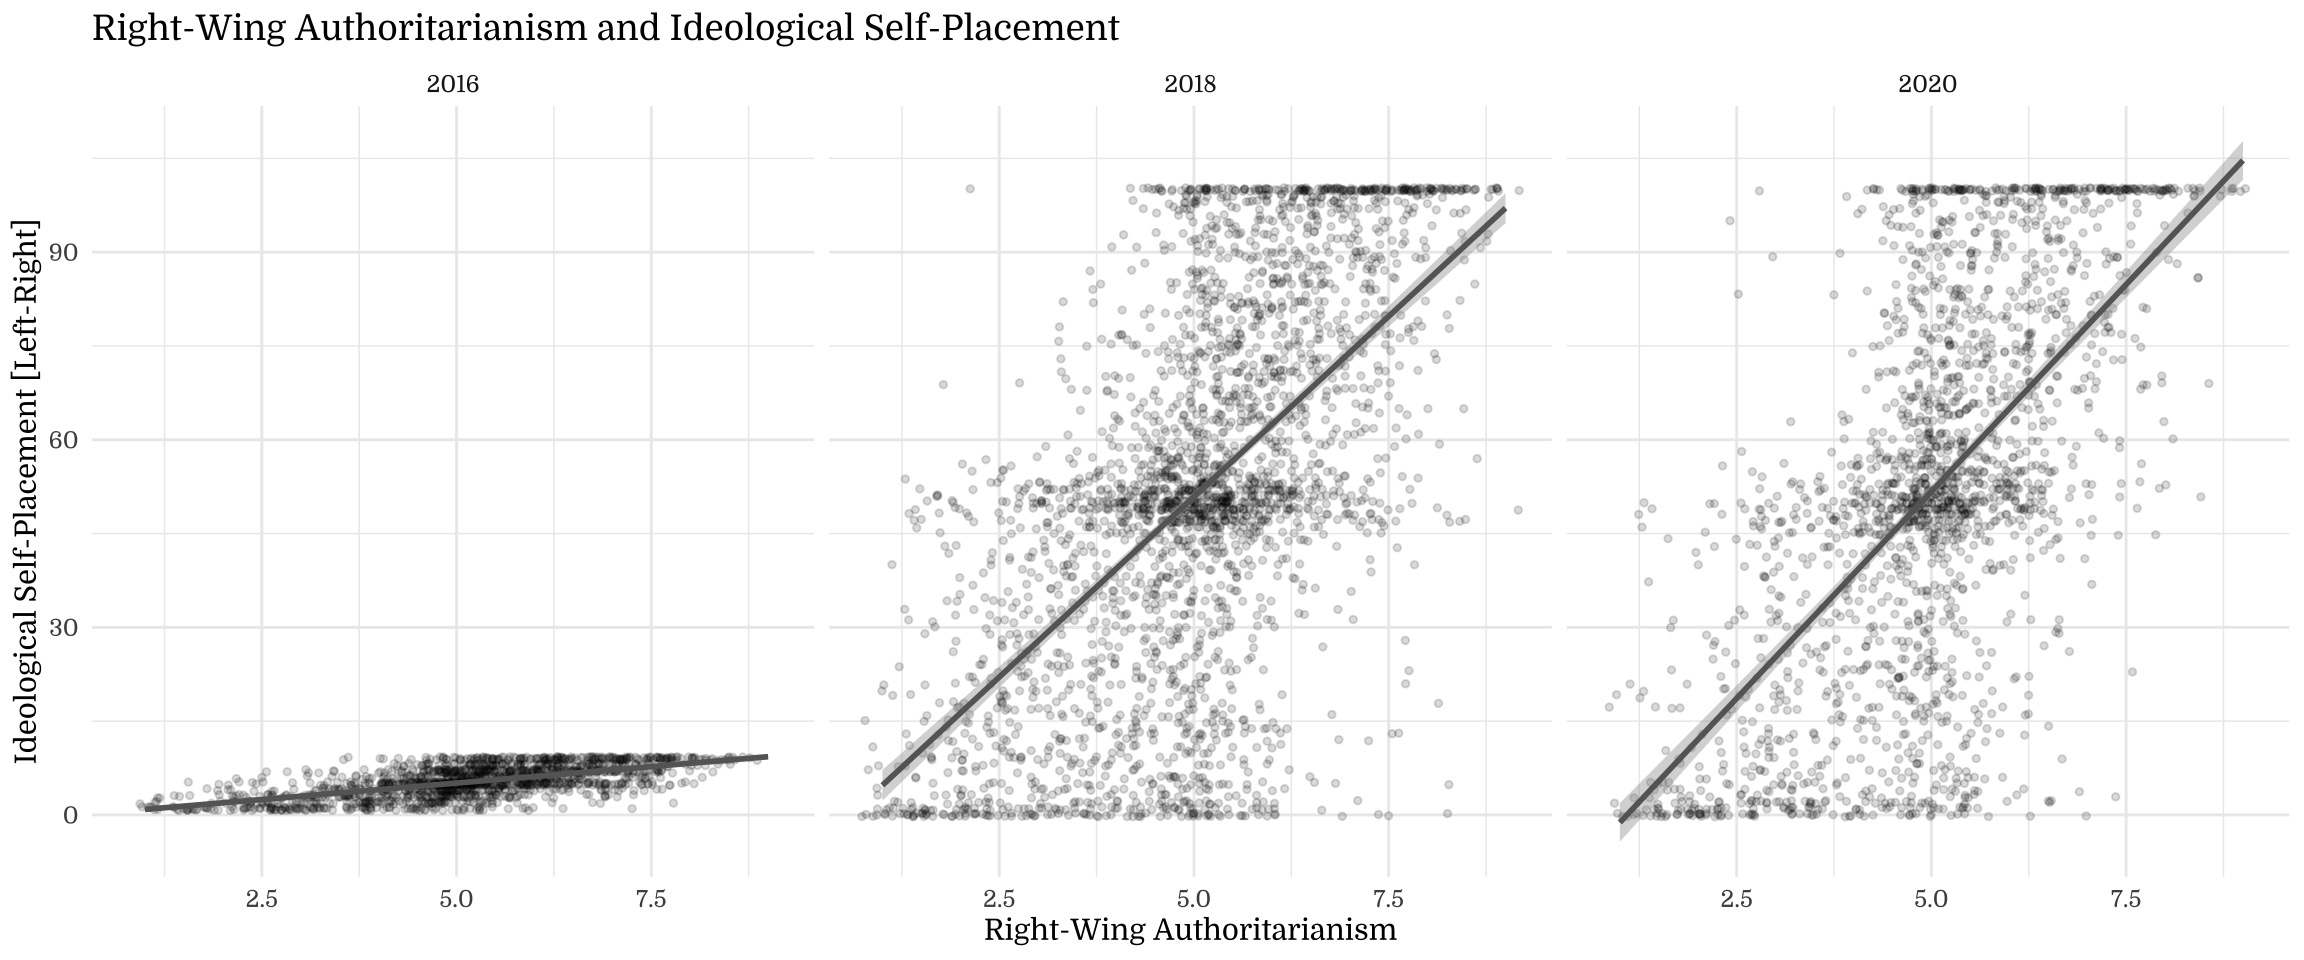
| (Intercept) | -5.76 | -10.14 – -1.39 | .010 | -0.55 | -1.05 – -0.06 | .028 | -15.16 | -19.79 – -10.53 | <.001 | -20.36 | -25.65 – -15.07 | <.001 |
| facet | 1.07 | 0.34 – 1.80 | .004 | 1.03 | 0.97 – 1.10 | <.001 | 11.69 | 11.10 – 12.28 | <.001 | 13.33 | 12.57 – 14.08 | <.001 |
| year [2018] | -7.01 | -11.65 – -2.36 | .003 | |||||||||
| year [2020] | -13.72 | -18.85 – -8.59 | <.001 | |||||||||
| Age25-34 years | 0.09 | -1.87 – 2.05 | .928 | -0.33 | -0.68 – 0.02 | .067 | -2.04 | -5.47 – 1.40 | .245 | 3.01 | -0.94 – 6.96 | .135 |
| Age35-44 years | -0.18 | -2.18 – 1.83 | .862 | -0.40 | -0.77 – -0.04 | .029 | -1.04 | -4.57 – 2.48 | .562 | 1.10 | -2.94 – 5.13 | .595 |
| Age45-54 years | 0.74 | -1.26 – 2.74 | .471 | -0.46 | -0.81 – -0.10 | .012 | 0.04 | -3.48 – 3.57 | .982 | 3.24 | -0.82 – 7.29 | .118 |
| Age55-64 years | 0.31 | -1.73 – 2.35 | .768 | -0.20 | -0.57 – 0.18 | .308 | -0.20 | -3.74 – 3.35 | .913 | 1.72 | -2.38 – 5.82 | .411 |
| Age [65+] | 0.69 | -2.50 – 3.88 | .670 | 0.50 | 0.13 – 0.87 | .008 | ||||||
| Age [65+ years] | -0.47 | -2.56 – 1.62 | .657 | -1.72 | -5.15 – 1.72 | .327 | 1.62 | -2.33 – 5.56 | .422 | |||
| Inc | 0.59 | 0.33 – 0.85 | <.001 | 0.08 | 0.03 – 0.14 | .003 | 1.40 | 0.97 – 1.83 | <.001 | -0.27 | -0.80 – 0.26 | .317 |
| Edu | 0.86 | 0.26 – 1.46 | .005 | 0.10 | -0.01 – 0.20 | .068 | 0.69 | -0.30 – 1.67 | .170 | 2.48 | 1.07 – 3.89 | .001 |
| facet × year [2018] | 10.60 | 9.73 – 11.48 | <.001 | |||||||||
| facet × year [2020] | 12.26 | 11.30 – 13.22 | <.001 | |||||||||
| Observations | 6259 | 1500 | 2759 | 2000 | ||||||||
| R2 / R2 adjusted | .606 / .605 | .424 / .421 | .382 / .380 | .394 / .391 | ||||||||
5.1.2 Scatter Plots by Year
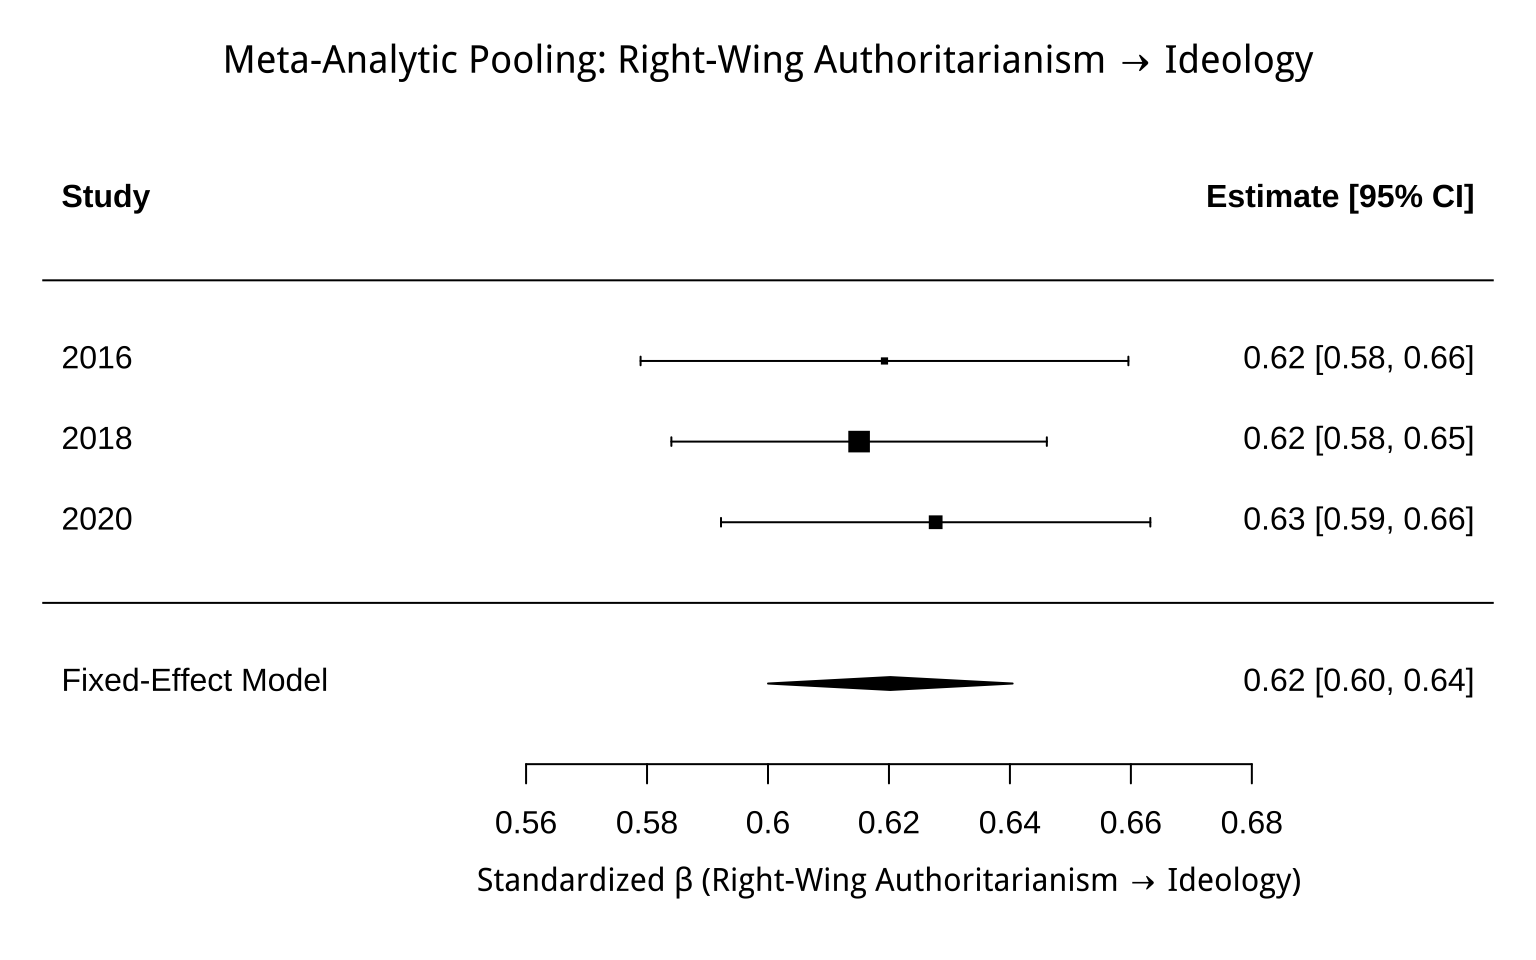
5.1.3 Forest Plot
5.2 Per-Subfacet Ideology
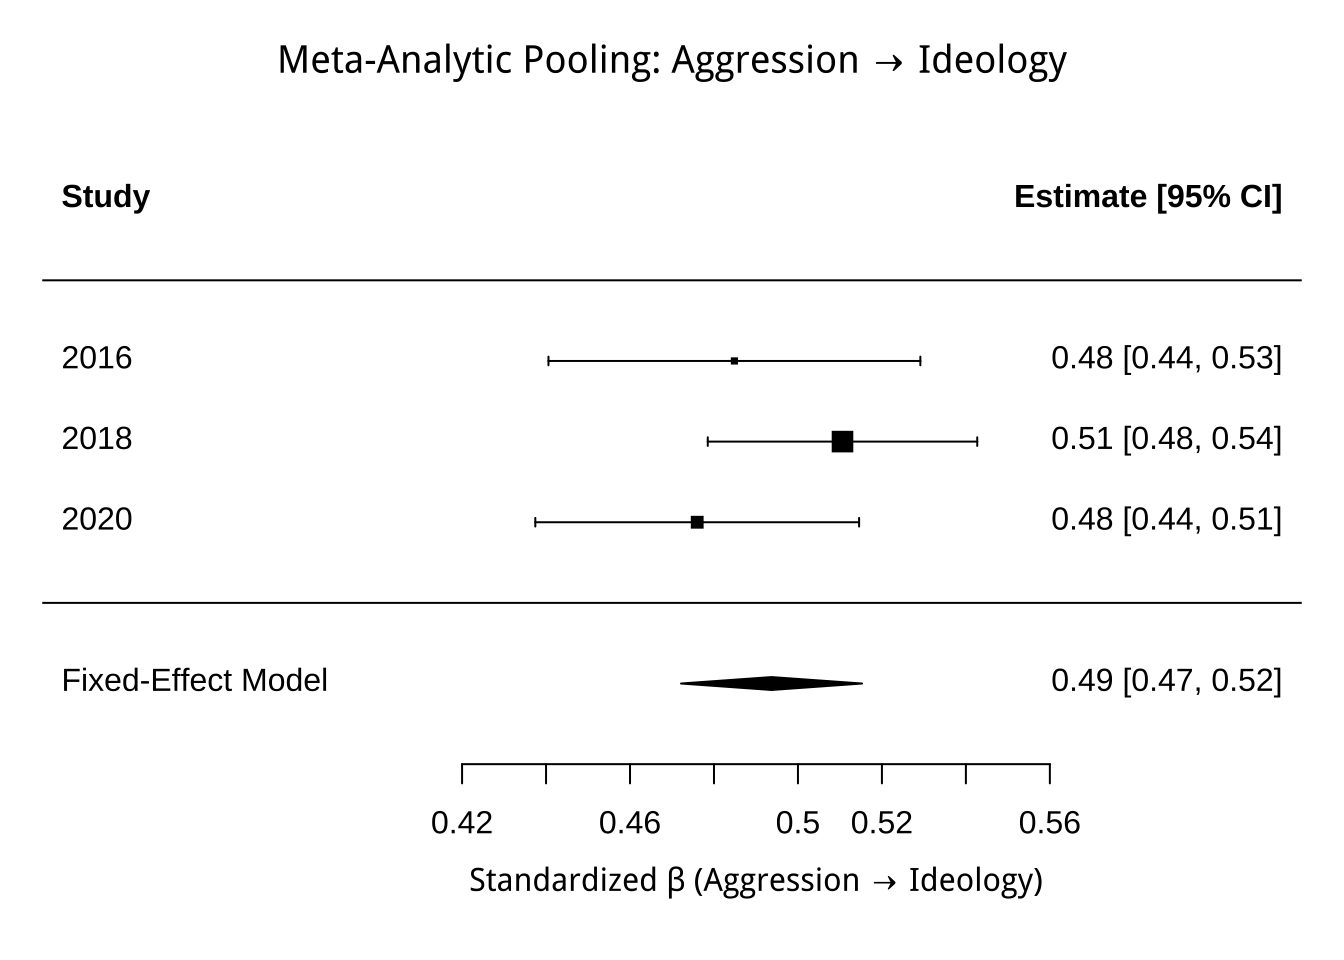
5.2.1 Aggression
| Aggression → Ideology (Pooled) | Aggression → Ideology (2016) | Aggression → Ideology (2018) | Aggression → Ideology (2020) | |||||||||
|---|---|---|---|---|---|---|---|---|---|---|---|---|
| Predictors | Estimates | CI | p | Estimates | CI | p | Estimates | CI | p | Estimates | CI | p |
| (Intercept) | 1.35 | -2.65 – 5.36 | .508 | 1.35 | 0.97 – 1.73 | <.001 | 3.81 | 0.66 – 6.96 | .018 | 0.99 | -3.28 – 5.27 | .649 |
| Aggression | 0.72 | 0.02 – 1.41 | .043 | 0.72 | 0.65 – 0.78 | <.001 | 8.69 | 8.15 – 9.24 | <.001 | 9.24 | 8.49 – 9.99 | <.001 |
| year [2018] | 2.46 | -2.43 – 7.34 | .324 | |||||||||
| year [2020] | -0.36 | -5.77 – 5.05 | .897 | |||||||||
| Aggression × year [2018] | 7.98 | 7.13 – 8.83 | <.001 | |||||||||
| Aggression × year [2020] | 8.53 | 7.58 – 9.47 | <.001 | |||||||||
| Observations | 6259 | 1500 | 2759 | 2000 | ||||||||
| R2 / R2 adjusted | .519 / .518 | .235 / .235 | .261 / .260 | .227 / .226 | ||||||||
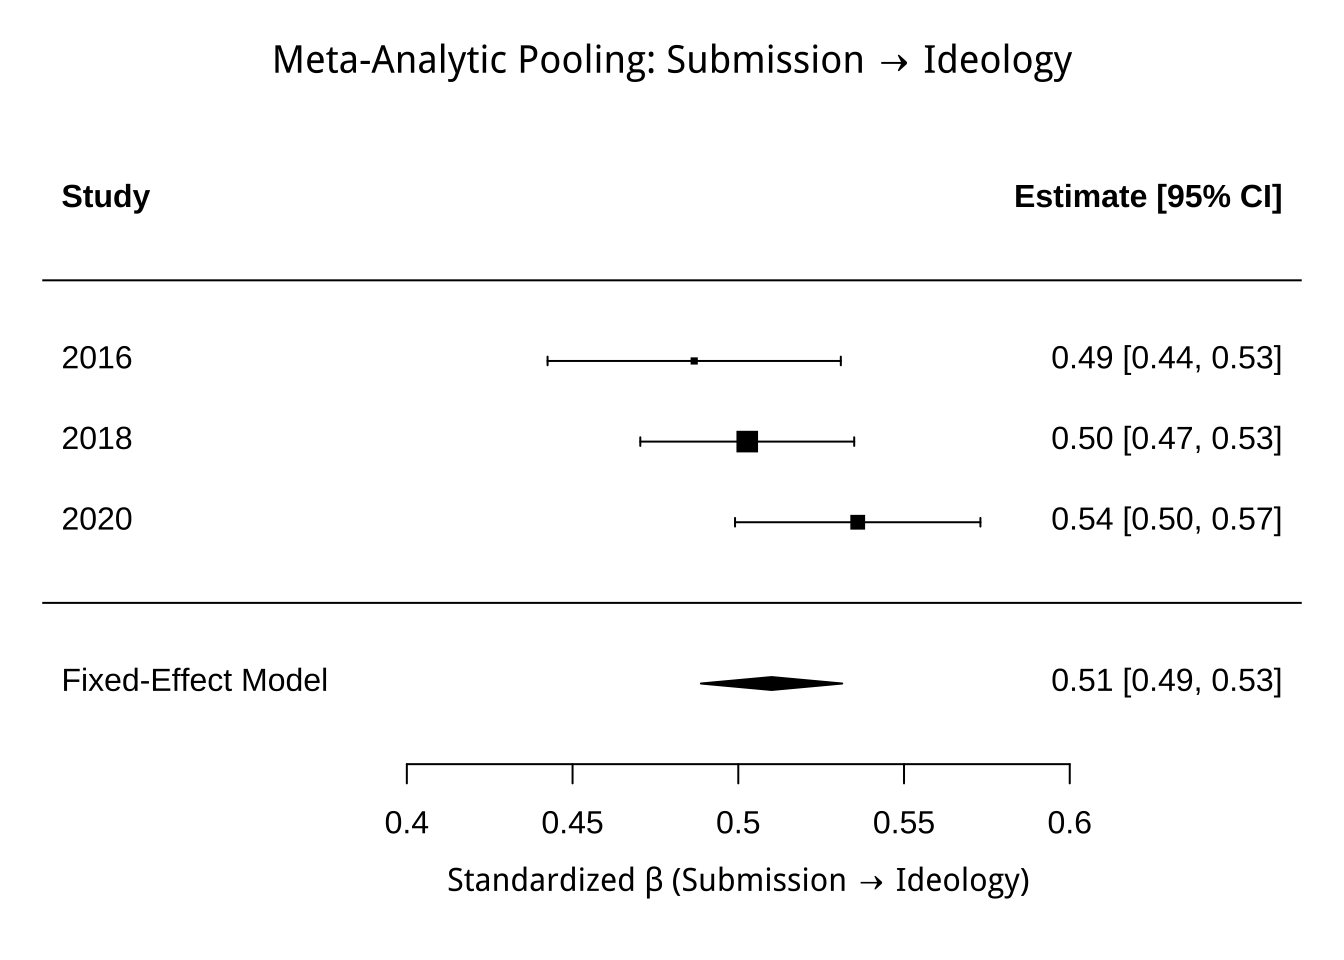
5.2.2 Submission
| Submission → Ideology (Pooled) | Submission → Ideology (2016) | Submission → Ideology (2018) | Submission → Ideology (2020) | |||||||||
|---|---|---|---|---|---|---|---|---|---|---|---|---|
| Predictors | Estimates | CI | p | Estimates | CI | p | Estimates | CI | p | Estimates | CI | p |
| (Intercept) | 1.45 | -2.39 – 5.29 | .460 | 1.45 | 1.08 – 1.82 | <.001 | 9.34 | 6.47 – 12.22 | <.001 | 3.25 | -0.28 – 6.78 | .071 |
| Submission | 0.81 | 0.04 – 1.58 | .040 | 0.81 | 0.74 – 0.88 | <.001 | 9.26 | 8.67 – 9.86 | <.001 | 10.73 | 9.99 – 11.47 | <.001 |
| year [2018] | 7.89 | 3.30 – 12.48 | .001 | |||||||||
| year [2020] | 1.80 | -3.13 – 6.73 | .474 | |||||||||
| Submission × year [2018] | 8.45 | 7.52 – 9.38 | <.001 | |||||||||
| Submission × year [2020] | 9.92 | 8.91 – 10.93 | <.001 | |||||||||
| Observations | 6259 | 1500 | 2759 | 2000 | ||||||||
| R2 / R2 adjusted | .533 / .532 | .237 / .236 | .253 / .252 | .287 / .287 | ||||||||
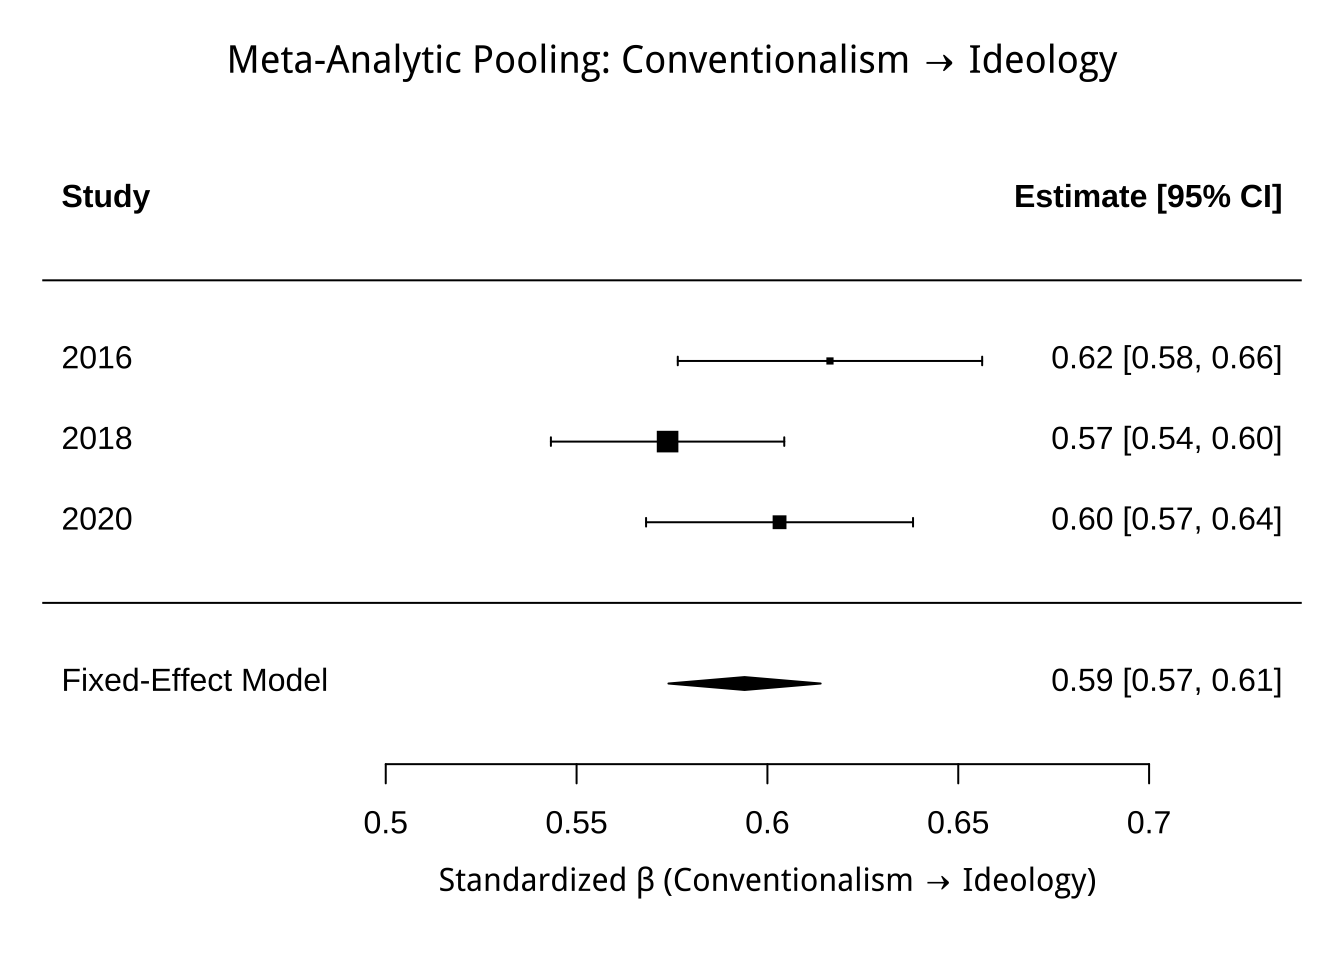
5.2.3 Conventionalism
| Conventionalism → Ideology (Pooled) | Conventionalism → Ideology (2016) | Conventionalism → Ideology (2018) | Conventionalism → Ideology (2020) | |||||||||
|---|---|---|---|---|---|---|---|---|---|---|---|---|
| Predictors | Estimates | CI | p | Estimates | CI | p | Estimates | CI | p | Estimates | CI | p |
| (Intercept) | 1.36 | -1.64 – 4.37 | .373 | 1.36 | 1.09 – 1.64 | <.001 | 7.74 | 5.23 – 10.24 | <.001 | 2.36 | -0.69 – 5.41 | .130 |
| Conventionalism | 0.74 | 0.21 – 1.27 | .006 | 0.74 | 0.70 – 0.79 | <.001 | 8.55 | 8.09 – 9.00 | <.001 | 9.89 | 9.31 – 10.46 | <.001 |
| year [2018] | 6.37 | 2.66 – 10.08 | .001 | |||||||||
| year [2020] | 0.99 | -3.03 – 5.02 | .628 | |||||||||
|
Conventionalism × year [2018] |
7.80 | 7.14 – 8.46 | <.001 | |||||||||
|
Conventionalism × year [2020] |
9.14 | 8.41 – 9.87 | <.001 | |||||||||
| Observations | 6259 | 1500 | 2759 | 2000 | ||||||||
| R2 / R2 adjusted | .582 / .581 | .380 / .380 | .329 / .329 | .364 / .364 | ||||||||
5.4 Economic Ideology
| Economic Ideology (Pooled) | Economic Ideology (2016) | Economic Ideology (2018) | Economic Ideology (2020) | |||||||||
|---|---|---|---|---|---|---|---|---|---|---|---|---|
| Predictors | Estimates | CI | p | Estimates | CI | p | Estimates | CI | p | Estimates | CI | p |
| (Intercept) | 0.53 | -3.66 – 4.71 | .806 | 0.53 | 0.11 – 0.94 | .013 | 0.63 | -2.62 – 3.89 | .703 | -9.49 | -13.57 – -5.41 | <.001 |
| facet | 0.95 | 0.18 – 1.73 | .016 | 0.95 | 0.88 – 1.03 | <.001 | 10.57 | 9.96 – 11.19 | <.001 | 12.78 | 12.00 – 13.57 | <.001 |
| year [2018] | 0.11 | -4.95 – 5.16 | .967 | |||||||||
| year [2020] | -10.02 | -15.52 – -4.51 | <.001 | |||||||||
| facet × year [2018] | 9.62 | 8.68 – 10.56 | <.001 | |||||||||
| facet × year [2020] | 11.83 | 10.79 – 12.86 | <.001 | |||||||||
| Observations | 6259 | 1500 | 2759 | 2000 | ||||||||
| R2 / R2 adjusted | .567 / .567 | .283 / .283 | .292 / .291 | .338 / .337 | ||||||||
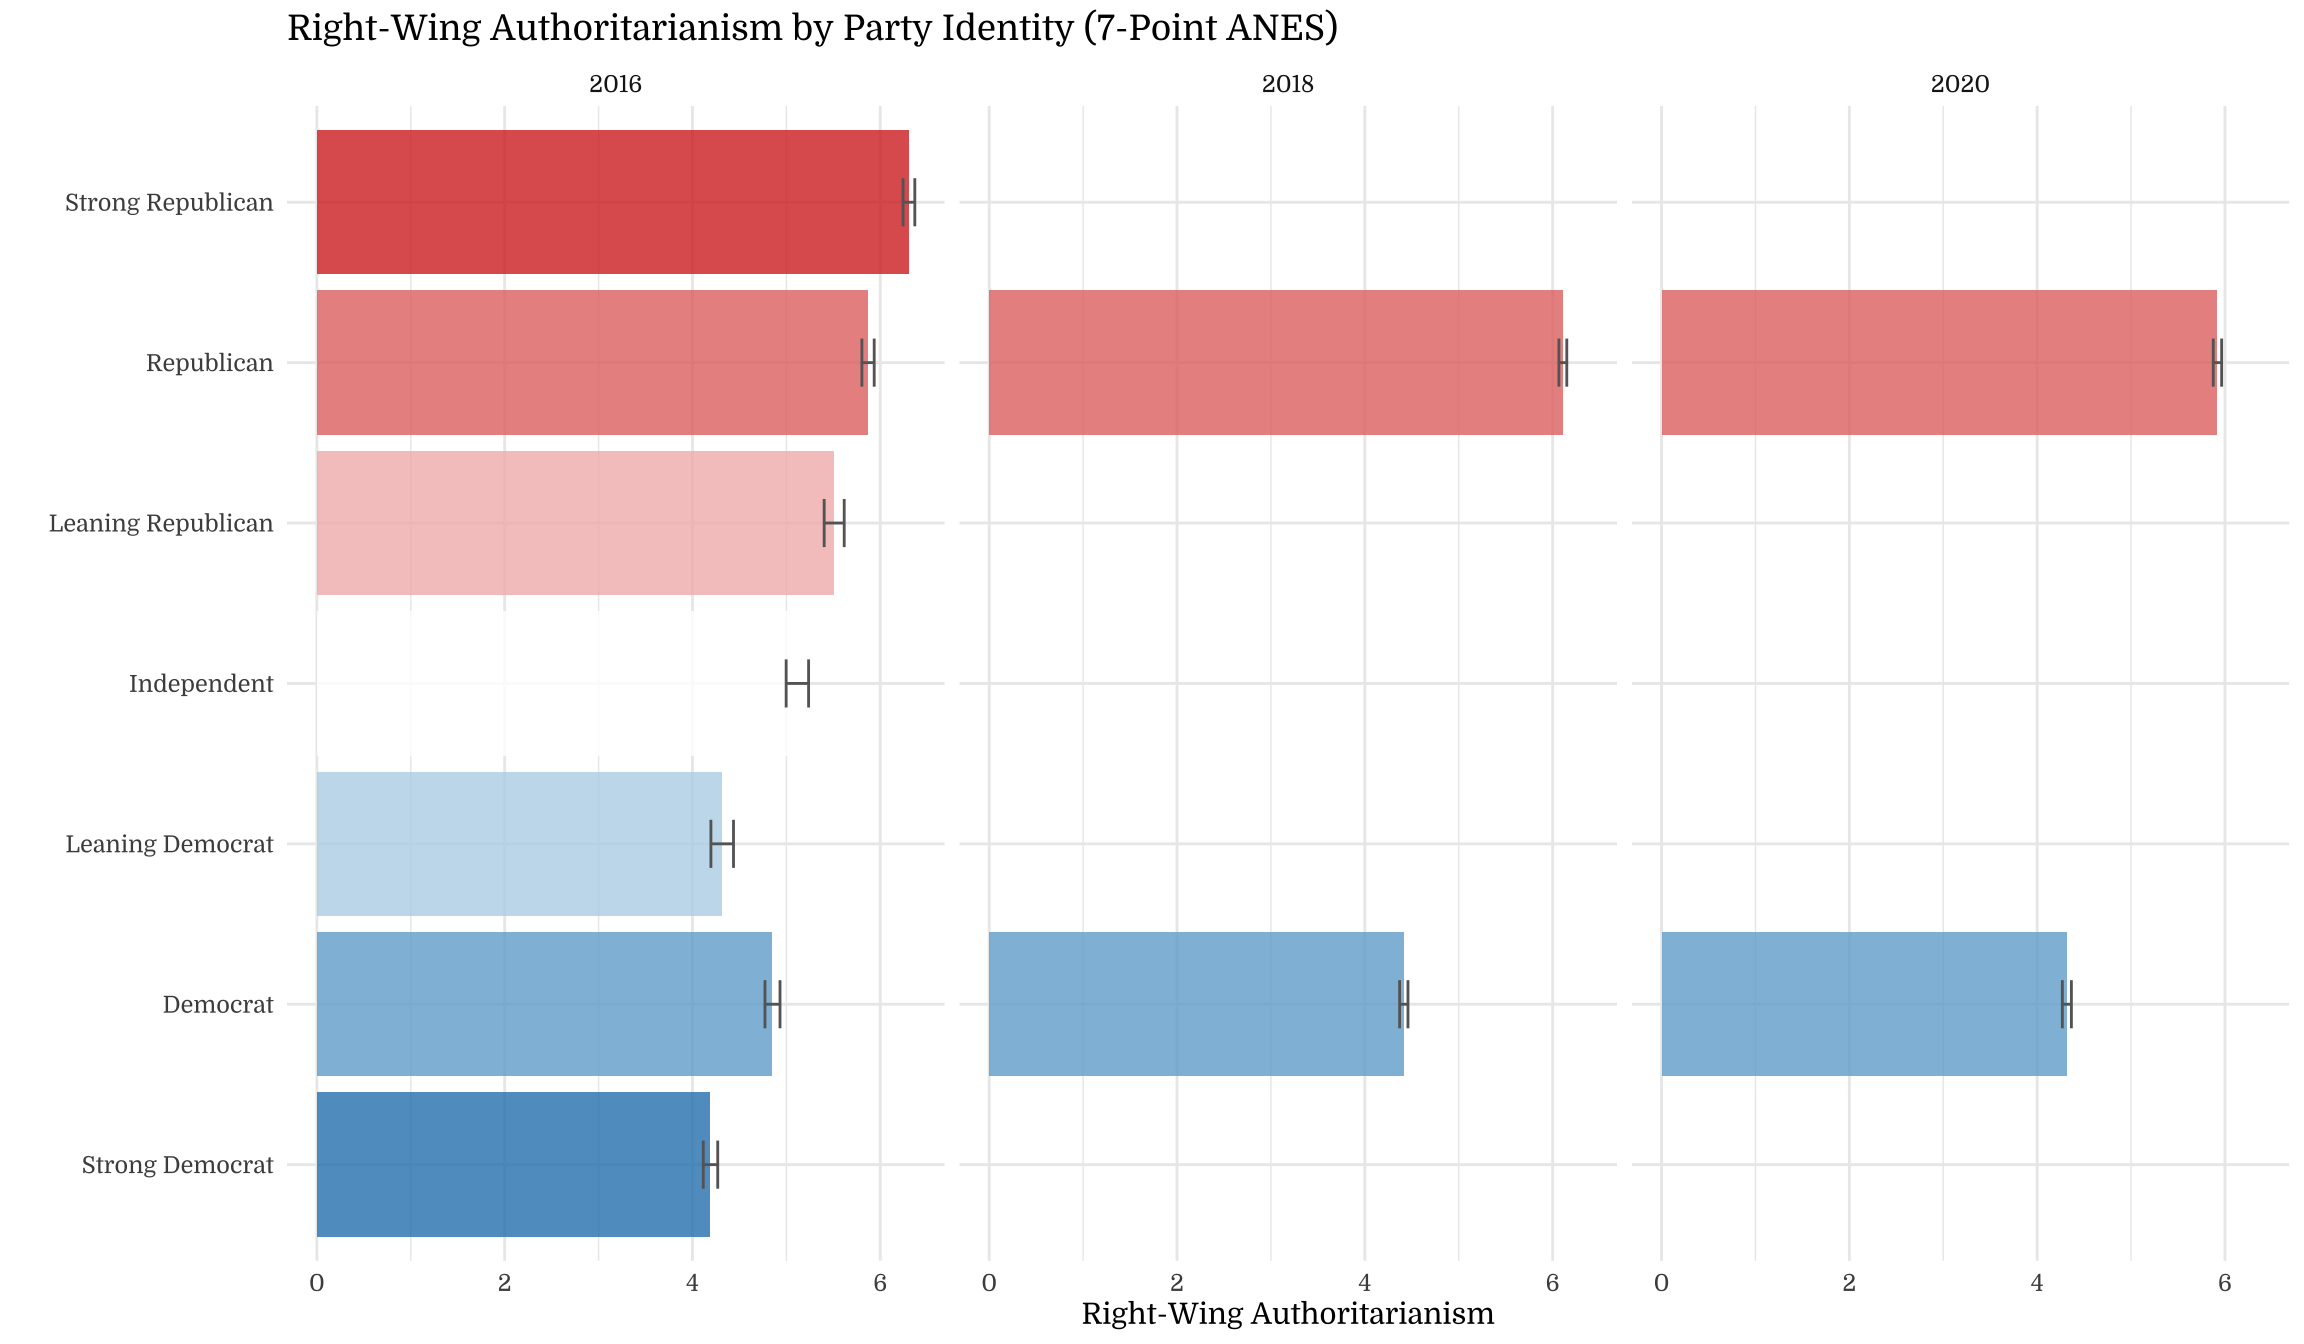
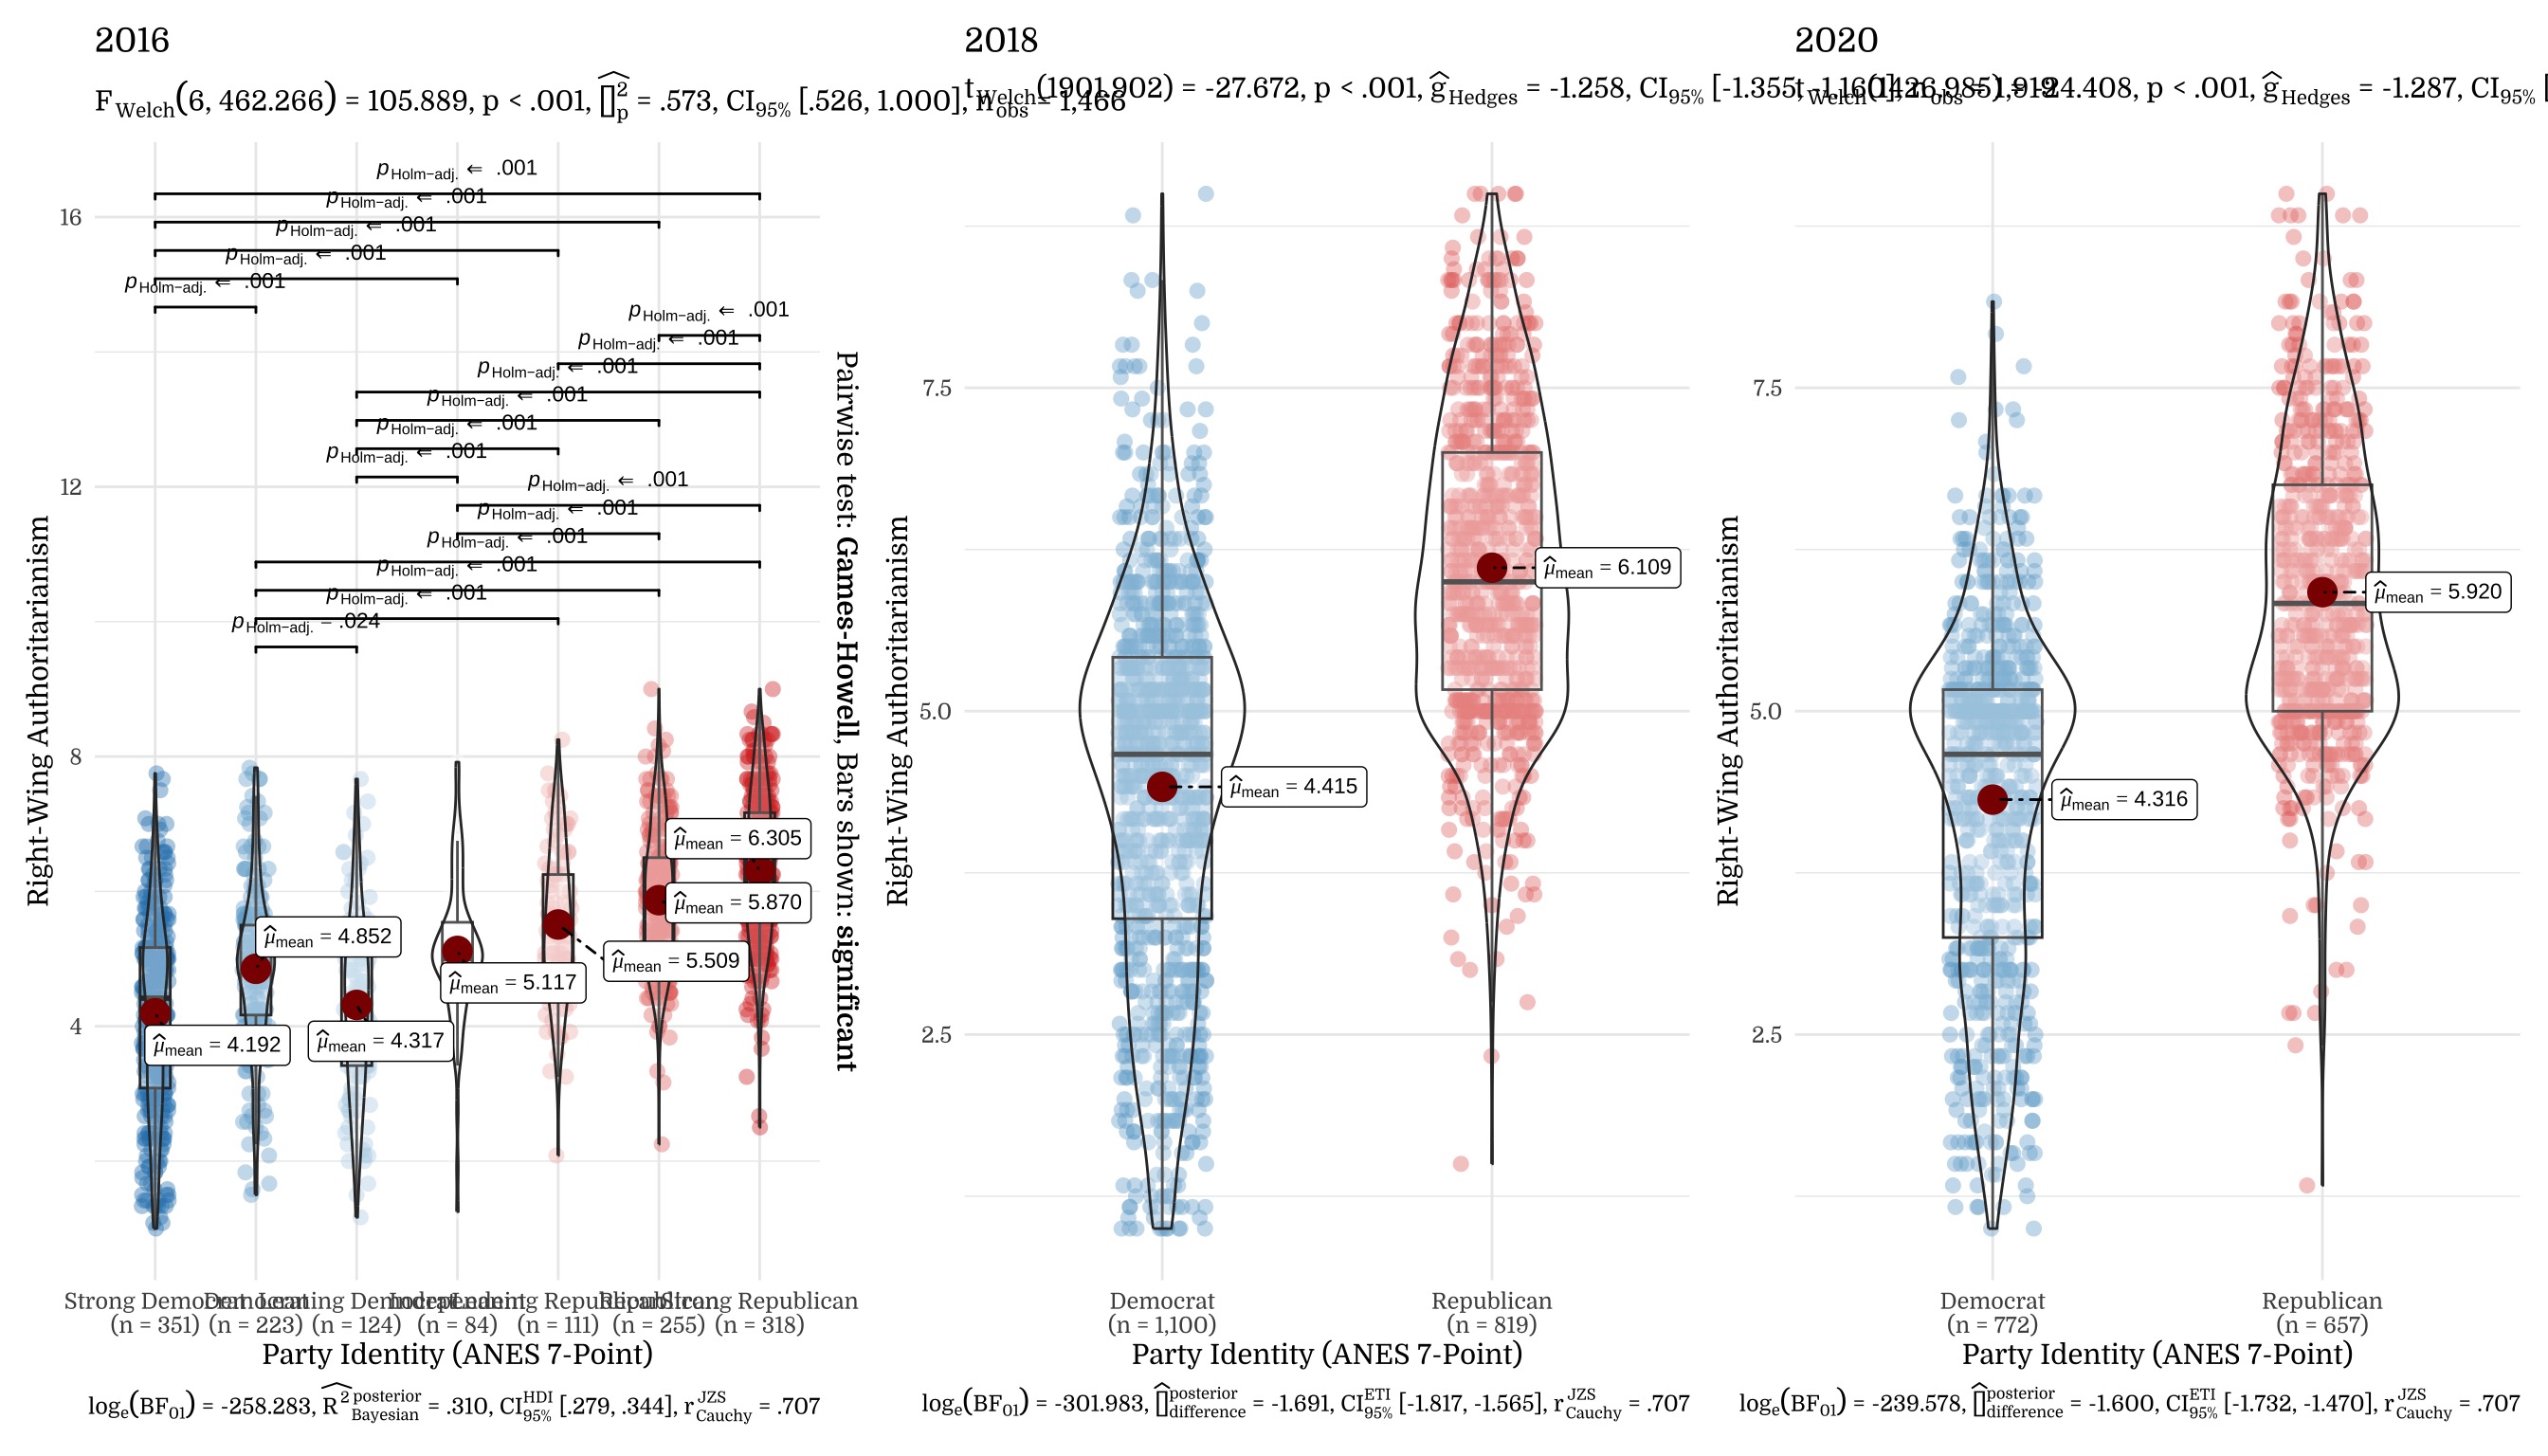
6 Party Identity Analyses
6.1 Party Identity (7-Point ANES) by Year
6.2 Party Identity Raincloud
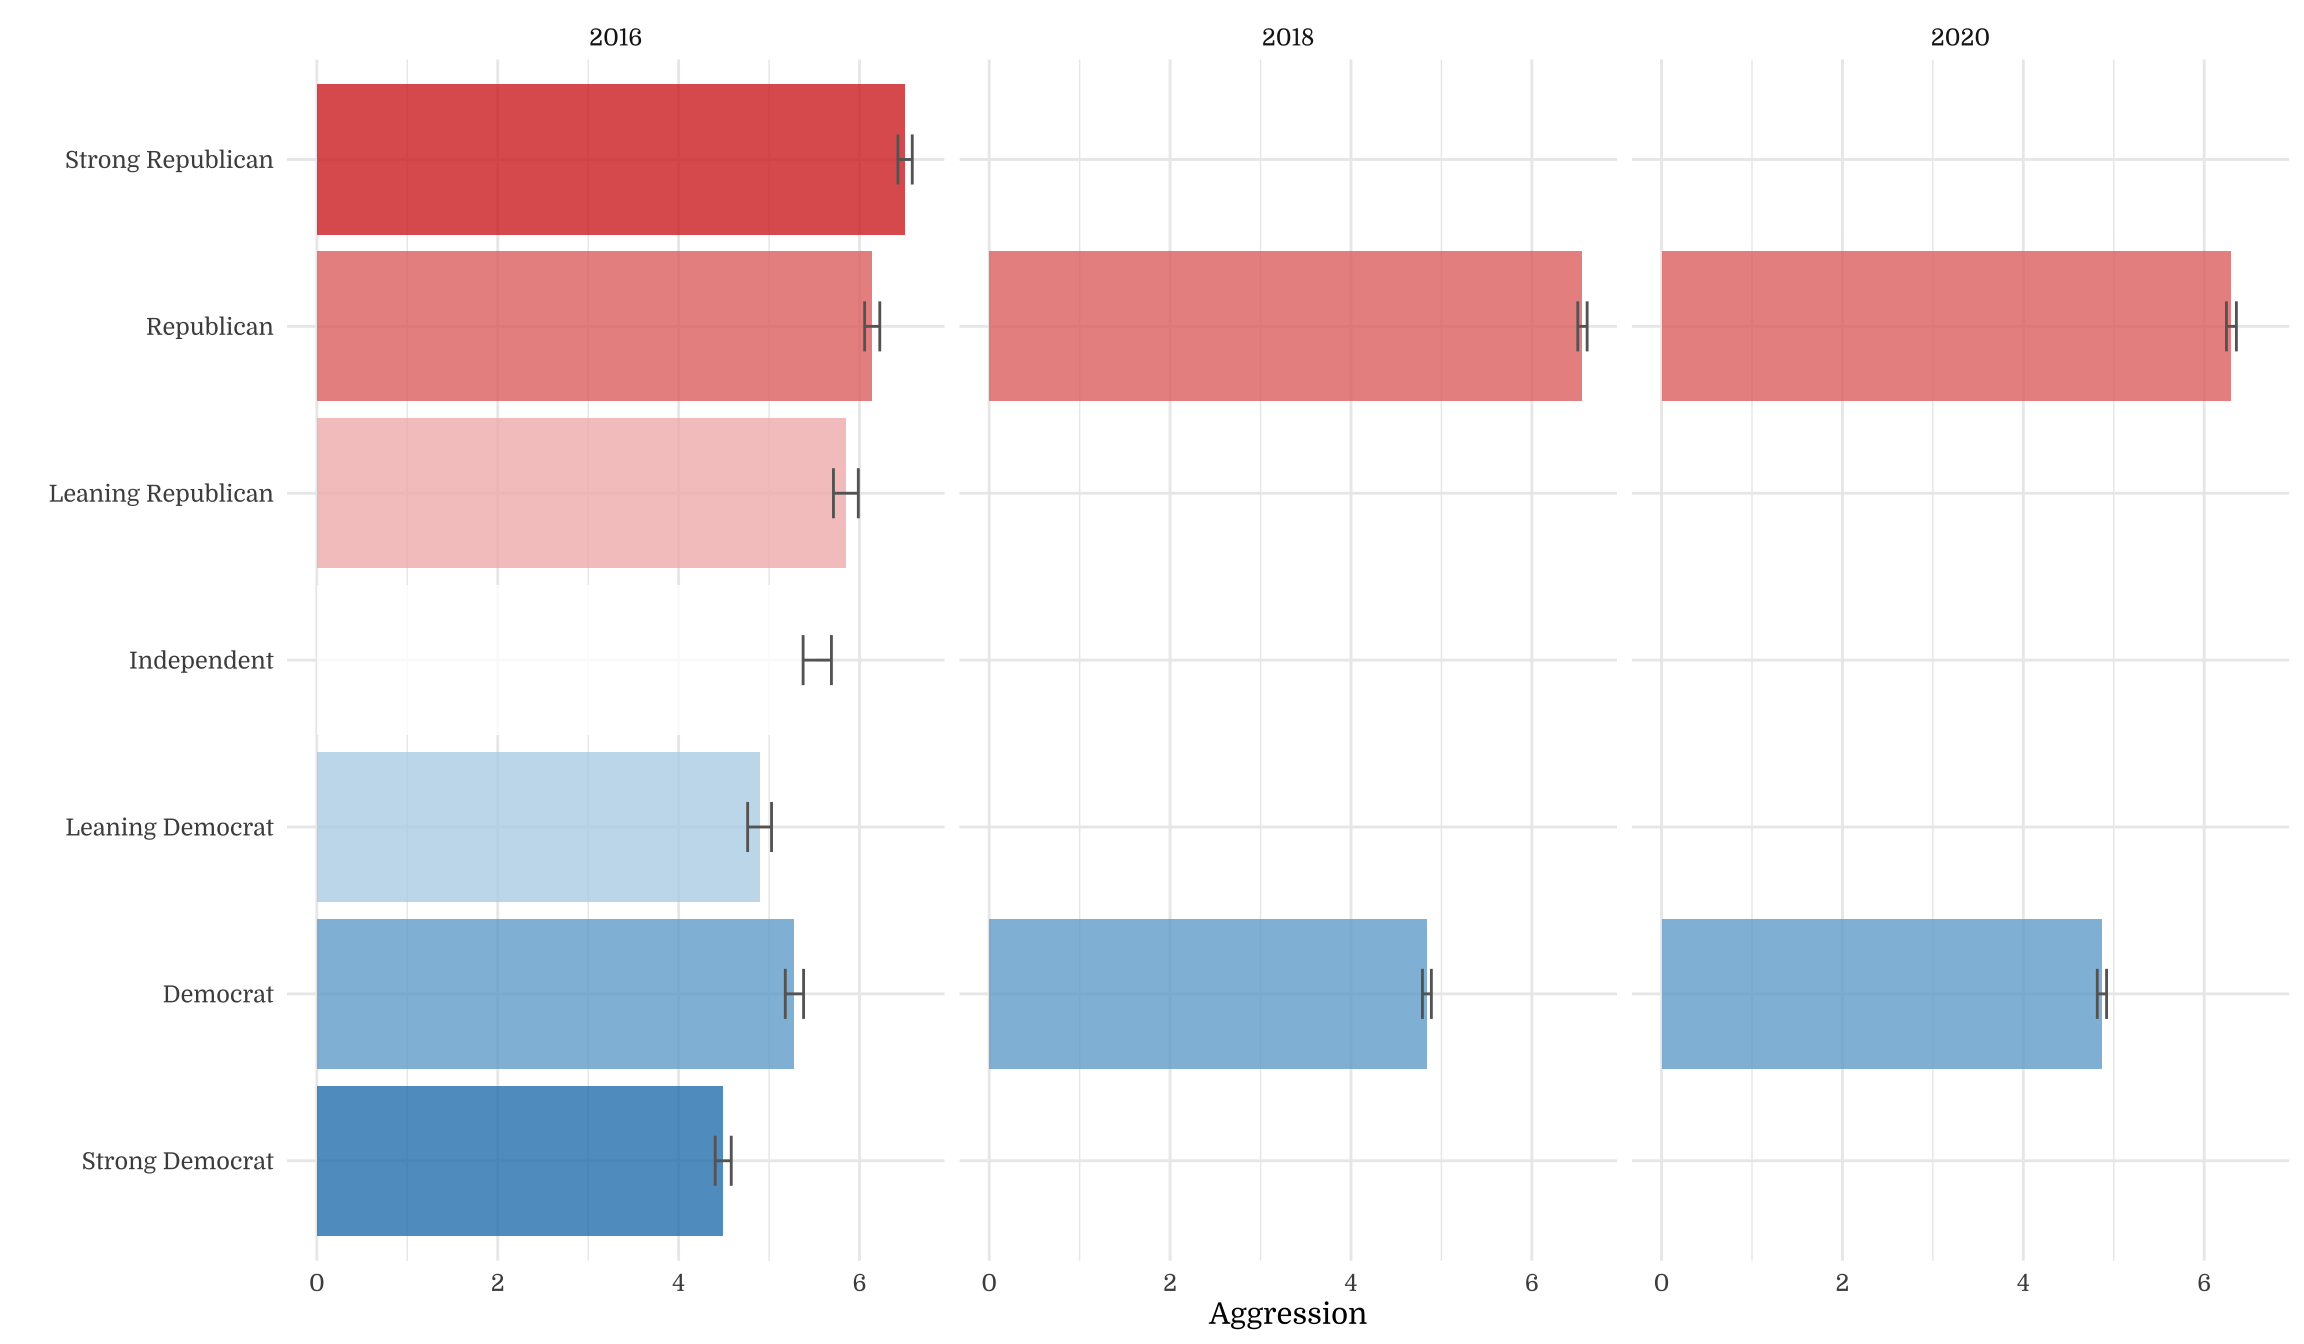
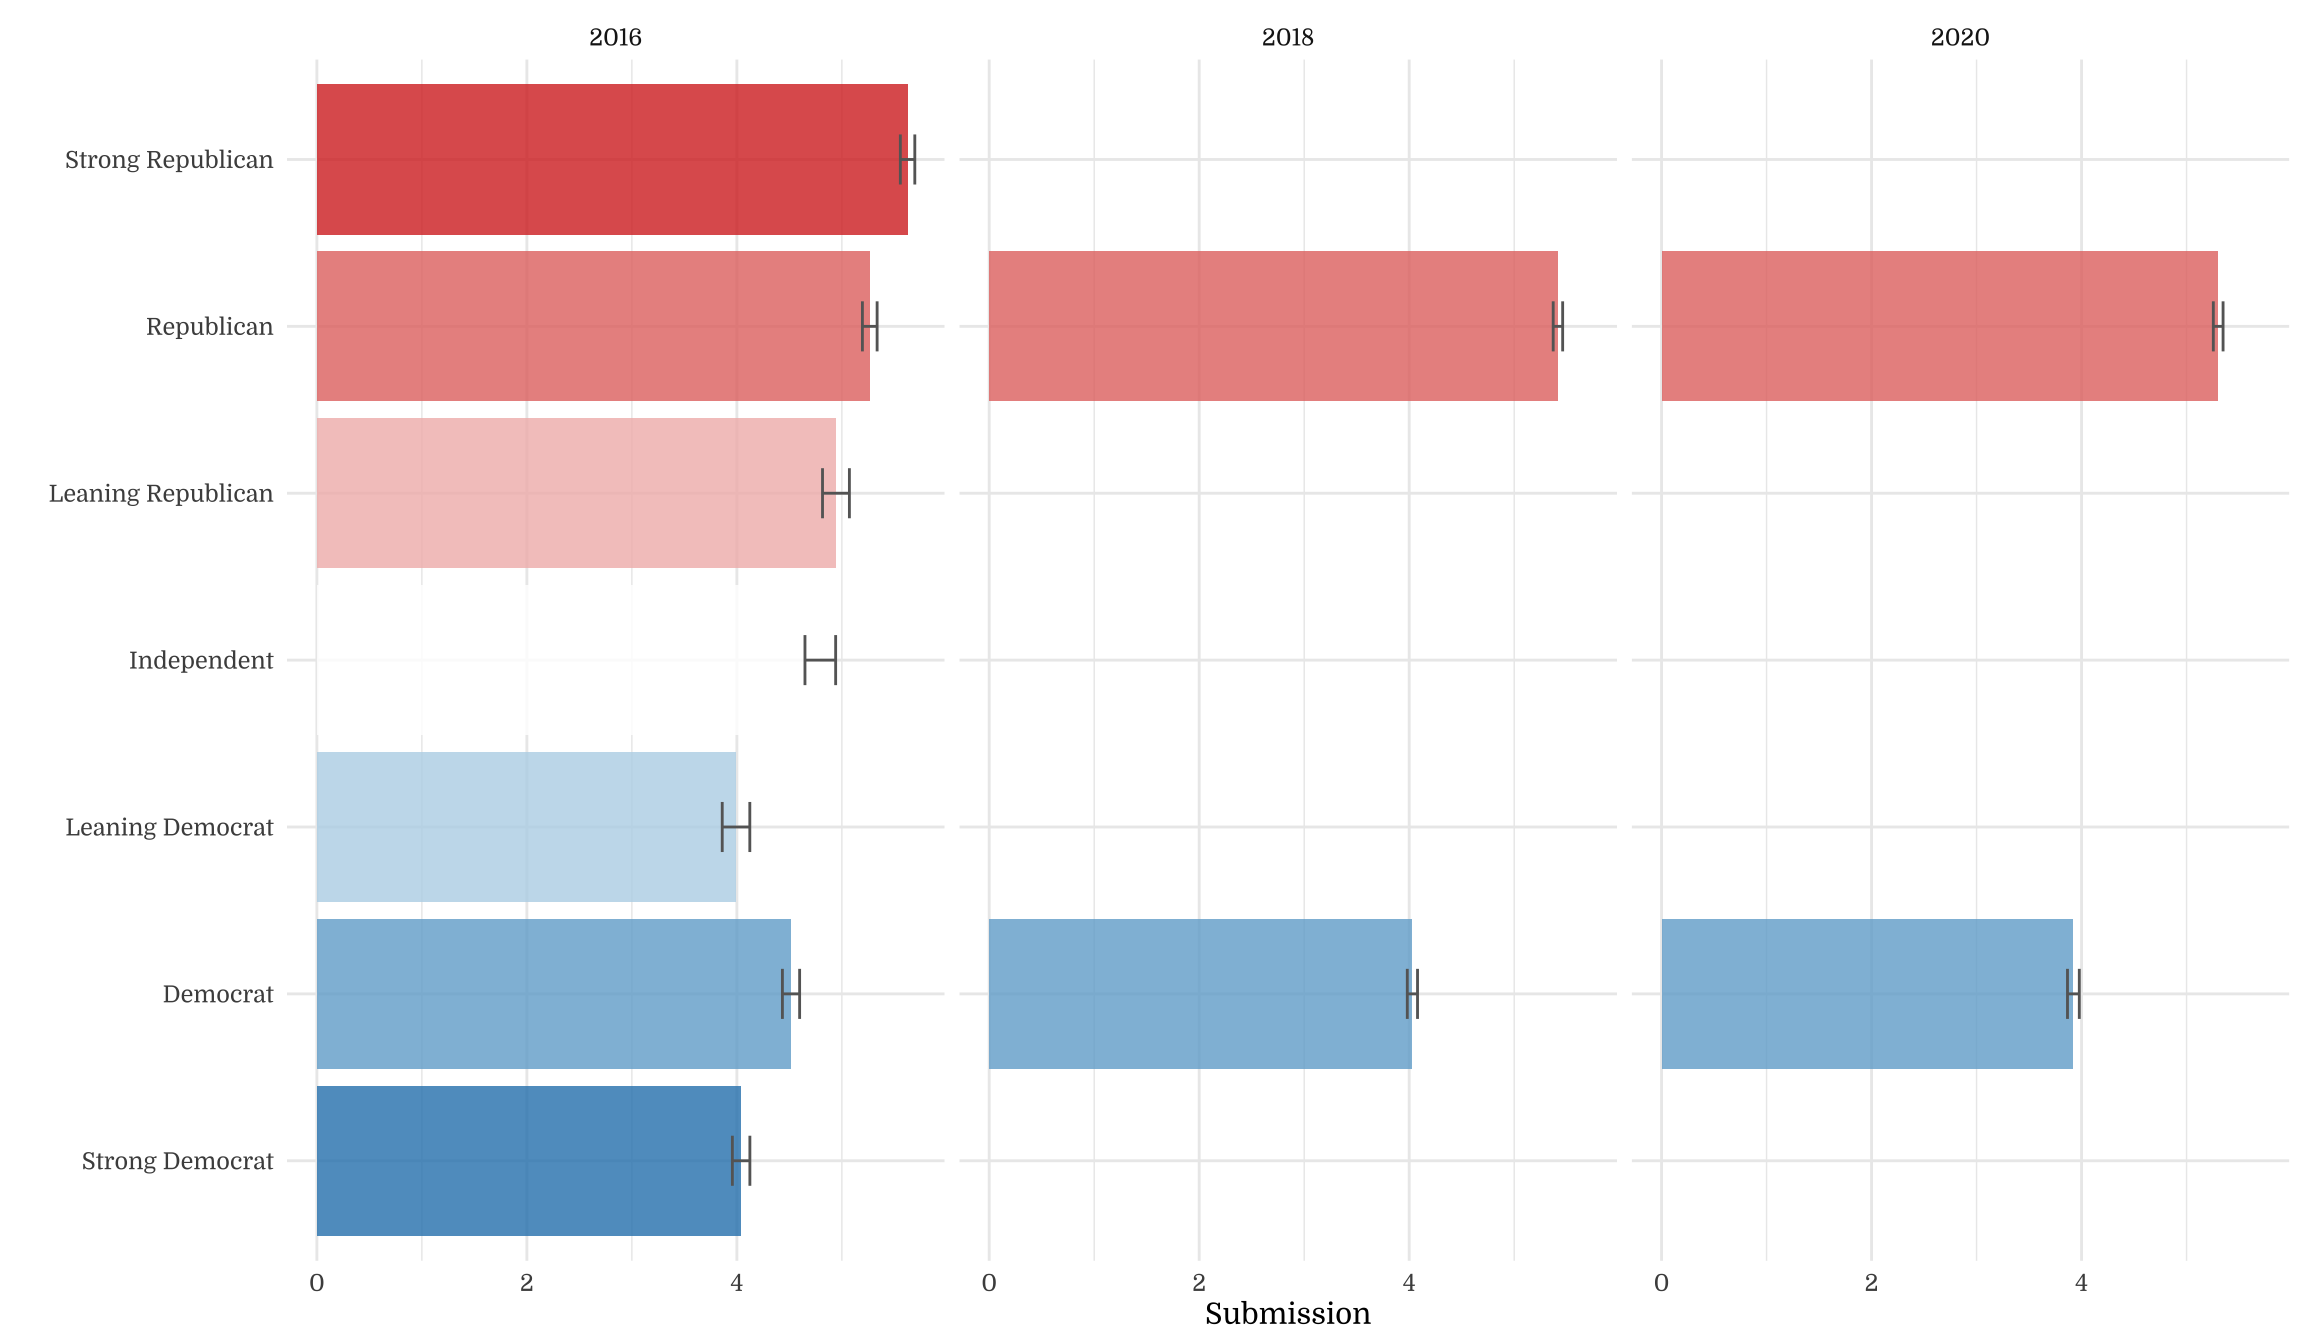
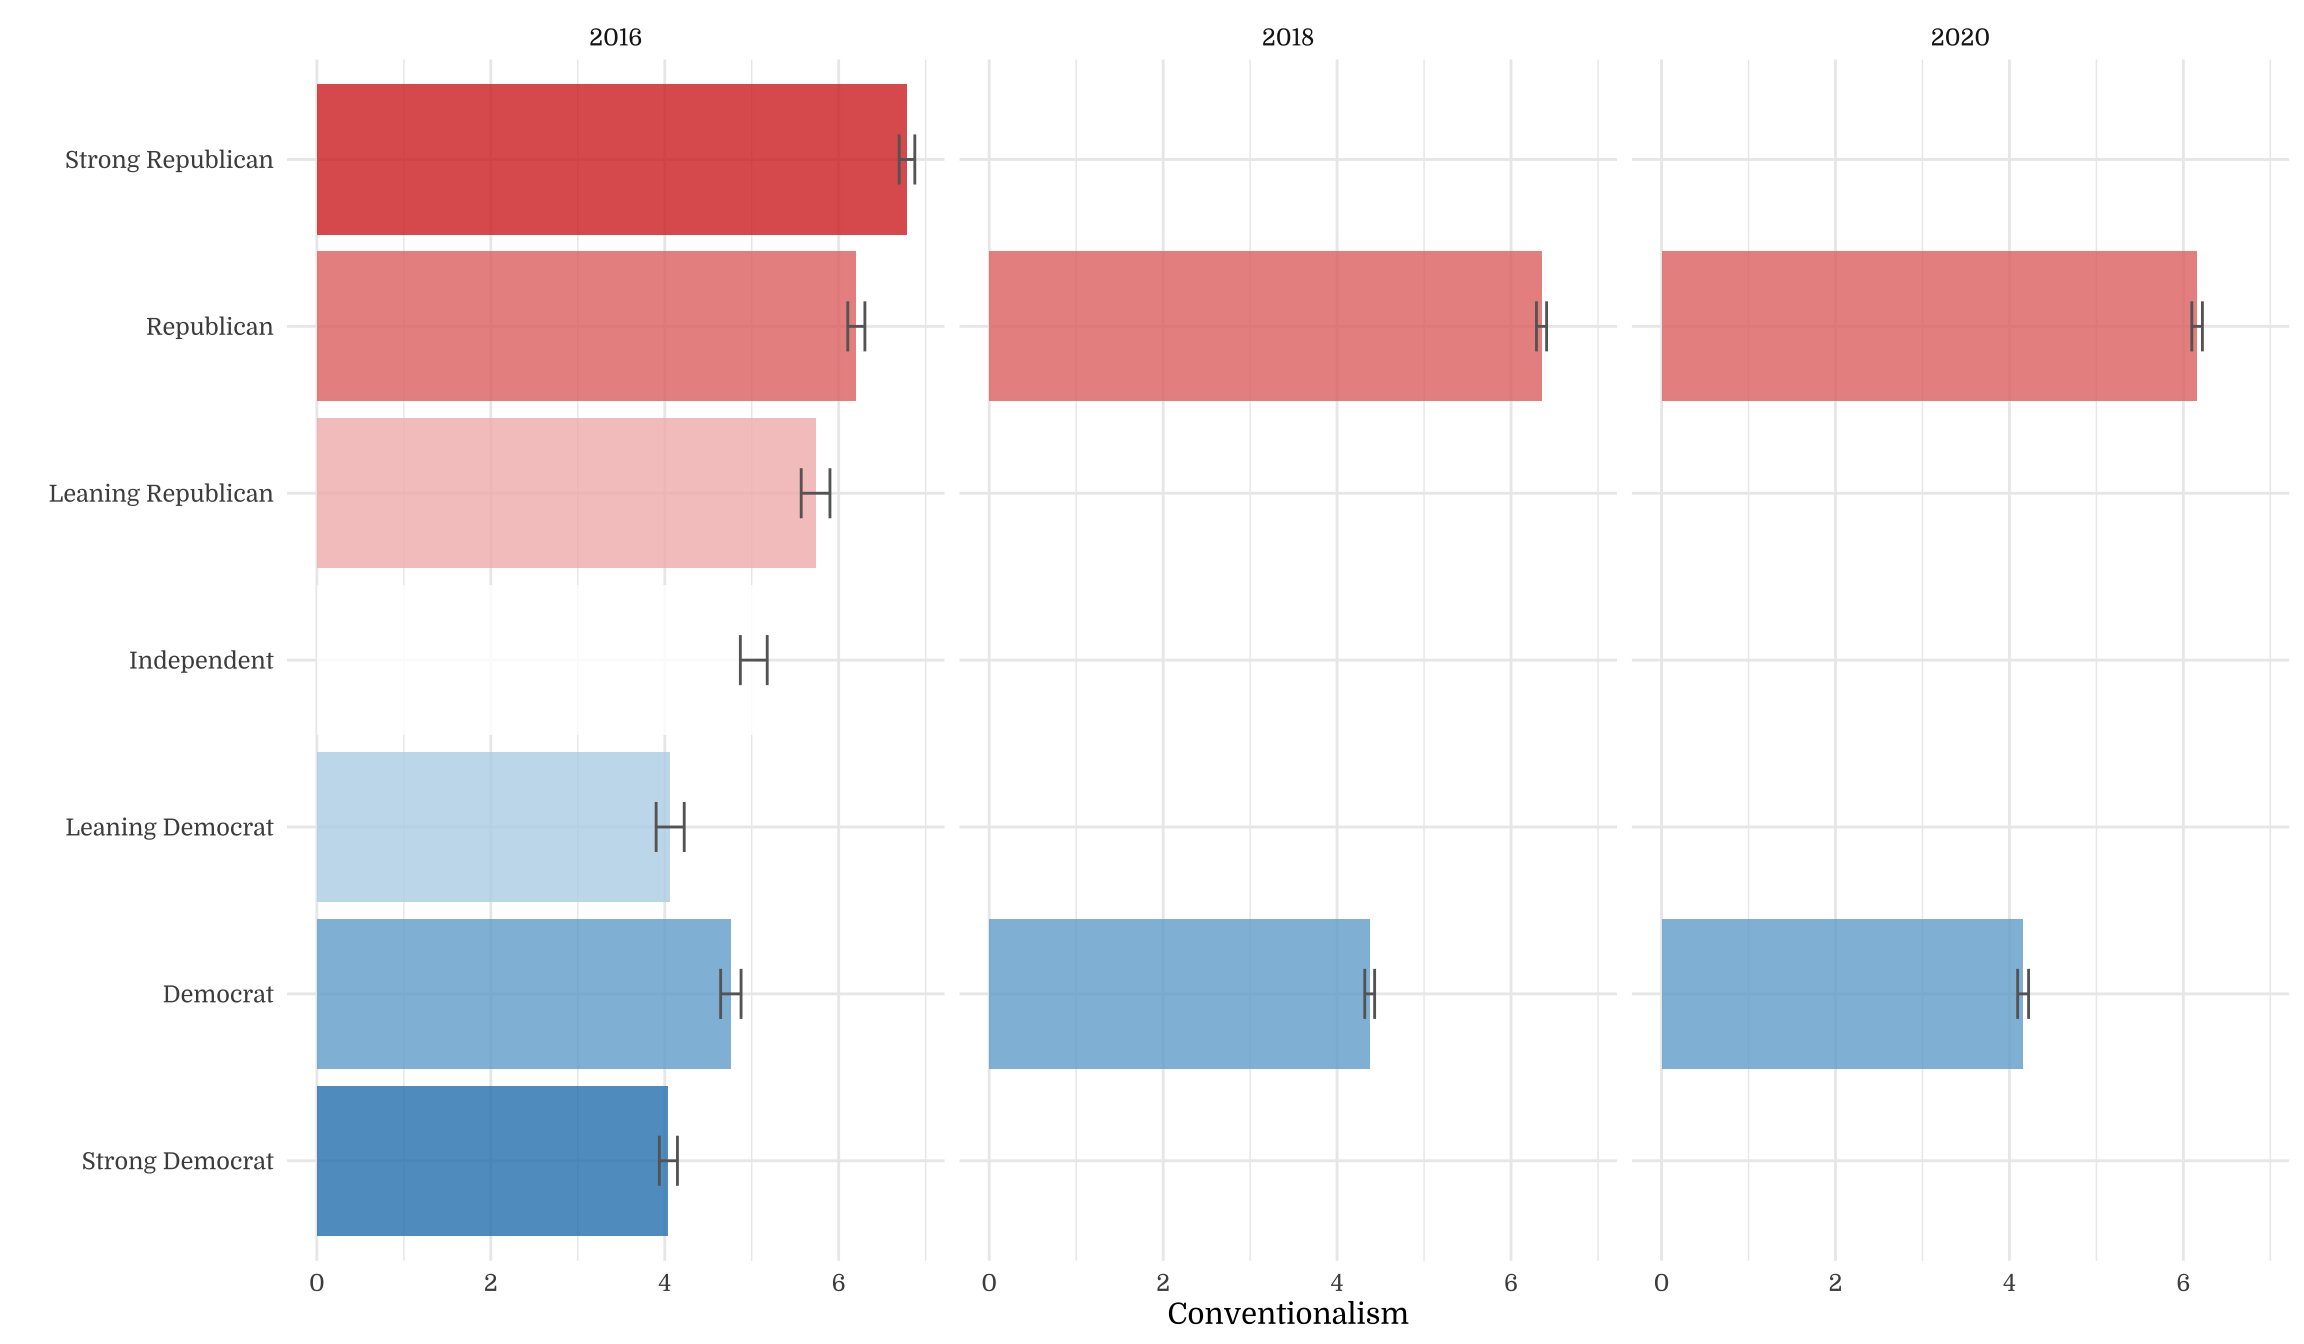
6.3 Per-Subfacet Party Identity
6.3.1 Aggression
6.3.2 Submission
6.3.3 Conventionalism
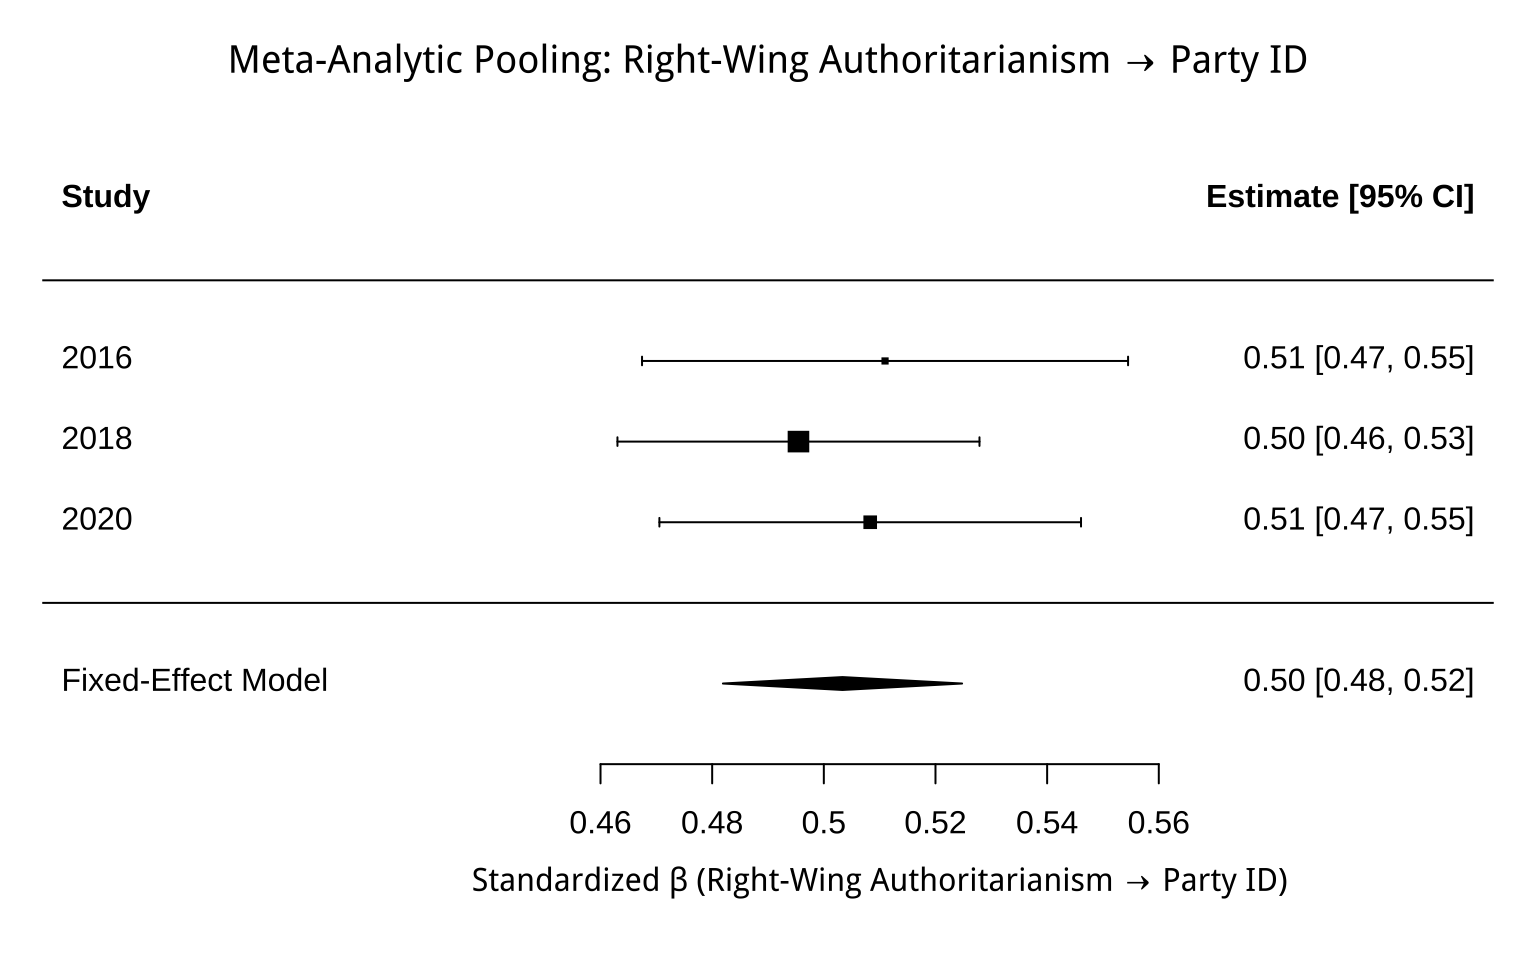
6.4 Party Identity Regression with Year Interaction
| Party ID (Pooled) | Party ID (2016) | Party ID (2018) | Party ID (2020) | |||||||||
|---|---|---|---|---|---|---|---|---|---|---|---|---|
| Predictors | Estimates | CI | p | Estimates | CI | p | Estimates | CI | p | Estimates | CI | p |
| (Intercept) | 0.60 | 0.52 – 0.68 | <.001 | 0.60 | 0.52 – 0.68 | <.001 | 0.64 | 0.59 – 0.70 | <.001 | 0.59 | 0.52 – 0.65 | <.001 |
| facet | 0.17 | 0.16 – 0.19 | <.001 | 0.17 | 0.16 – 0.19 | <.001 | 0.16 | 0.15 – 0.17 | <.001 | 0.18 | 0.16 – 0.19 | <.001 |
| year [2018] | 0.05 | -0.05 – 0.14 | .348 | |||||||||
| year [2020] | -0.01 | -0.12 – 0.09 | .814 | |||||||||
| facet × year [2018] | -0.02 | -0.04 – 0.00 | .059 | |||||||||
| facet × year [2020] | 0.00 | -0.02 – 0.02 | .750 | |||||||||
| Observations | 6259 | 1500 | 2759 | 2000 | ||||||||
| R2 / R2 adjusted | .256 / .255 | .261 / .261 | .245 / .245 | .258 / .258 | ||||||||
6.5 Forest Plot: Party ID Regression
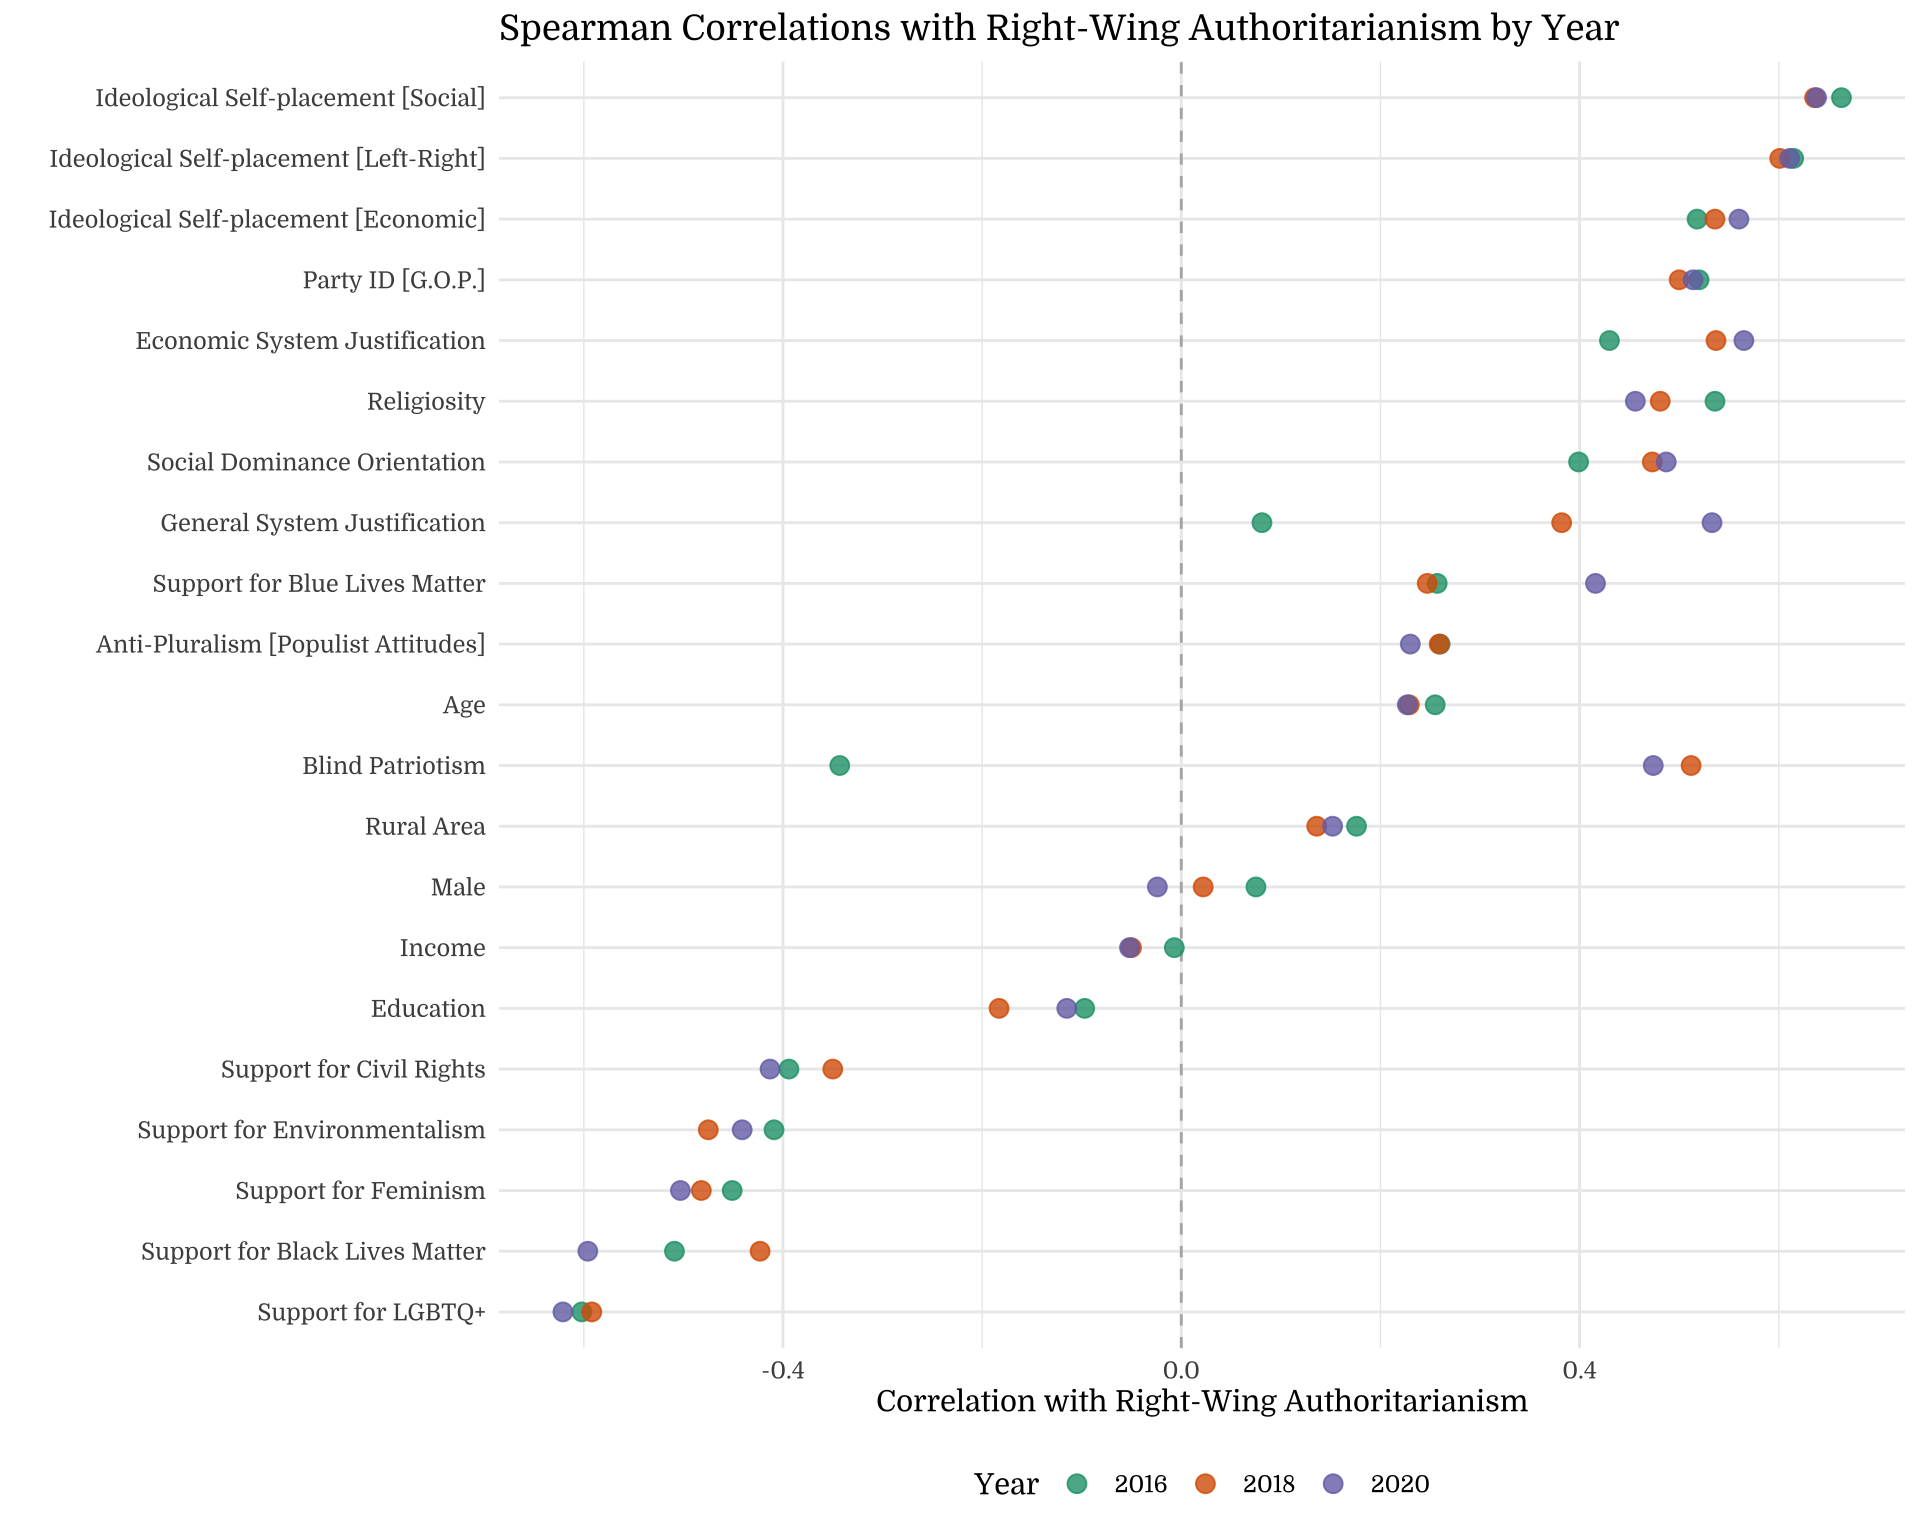
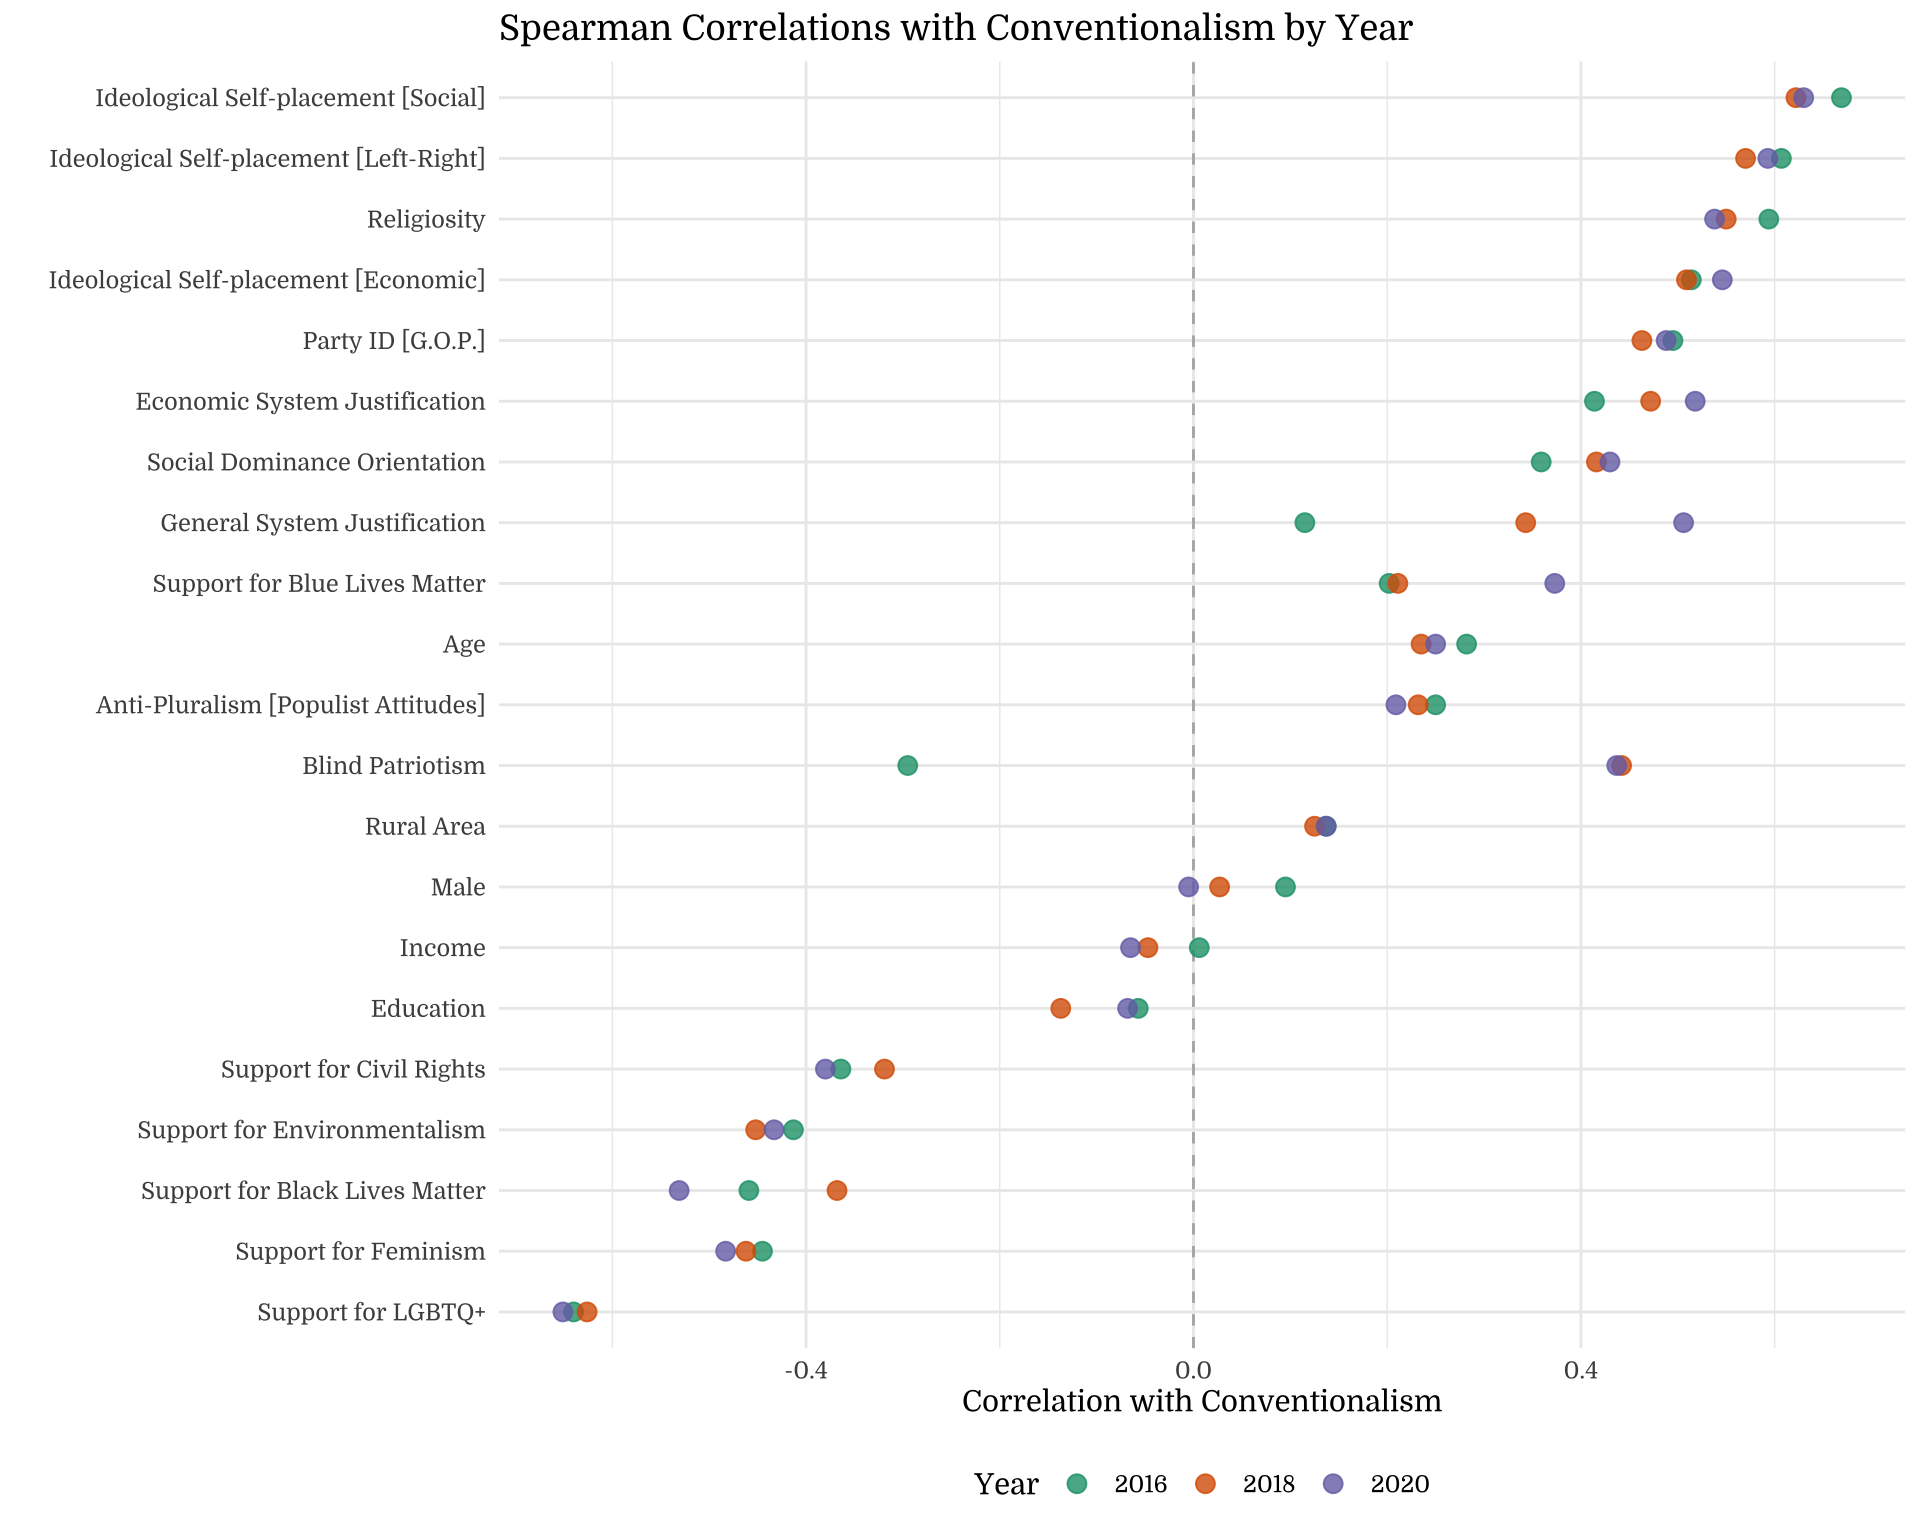
7 Correlation Comparison
7.1 Overall Cleveland Dot Plot
7.2 Per-Subfacet Cleveland Dot Plots
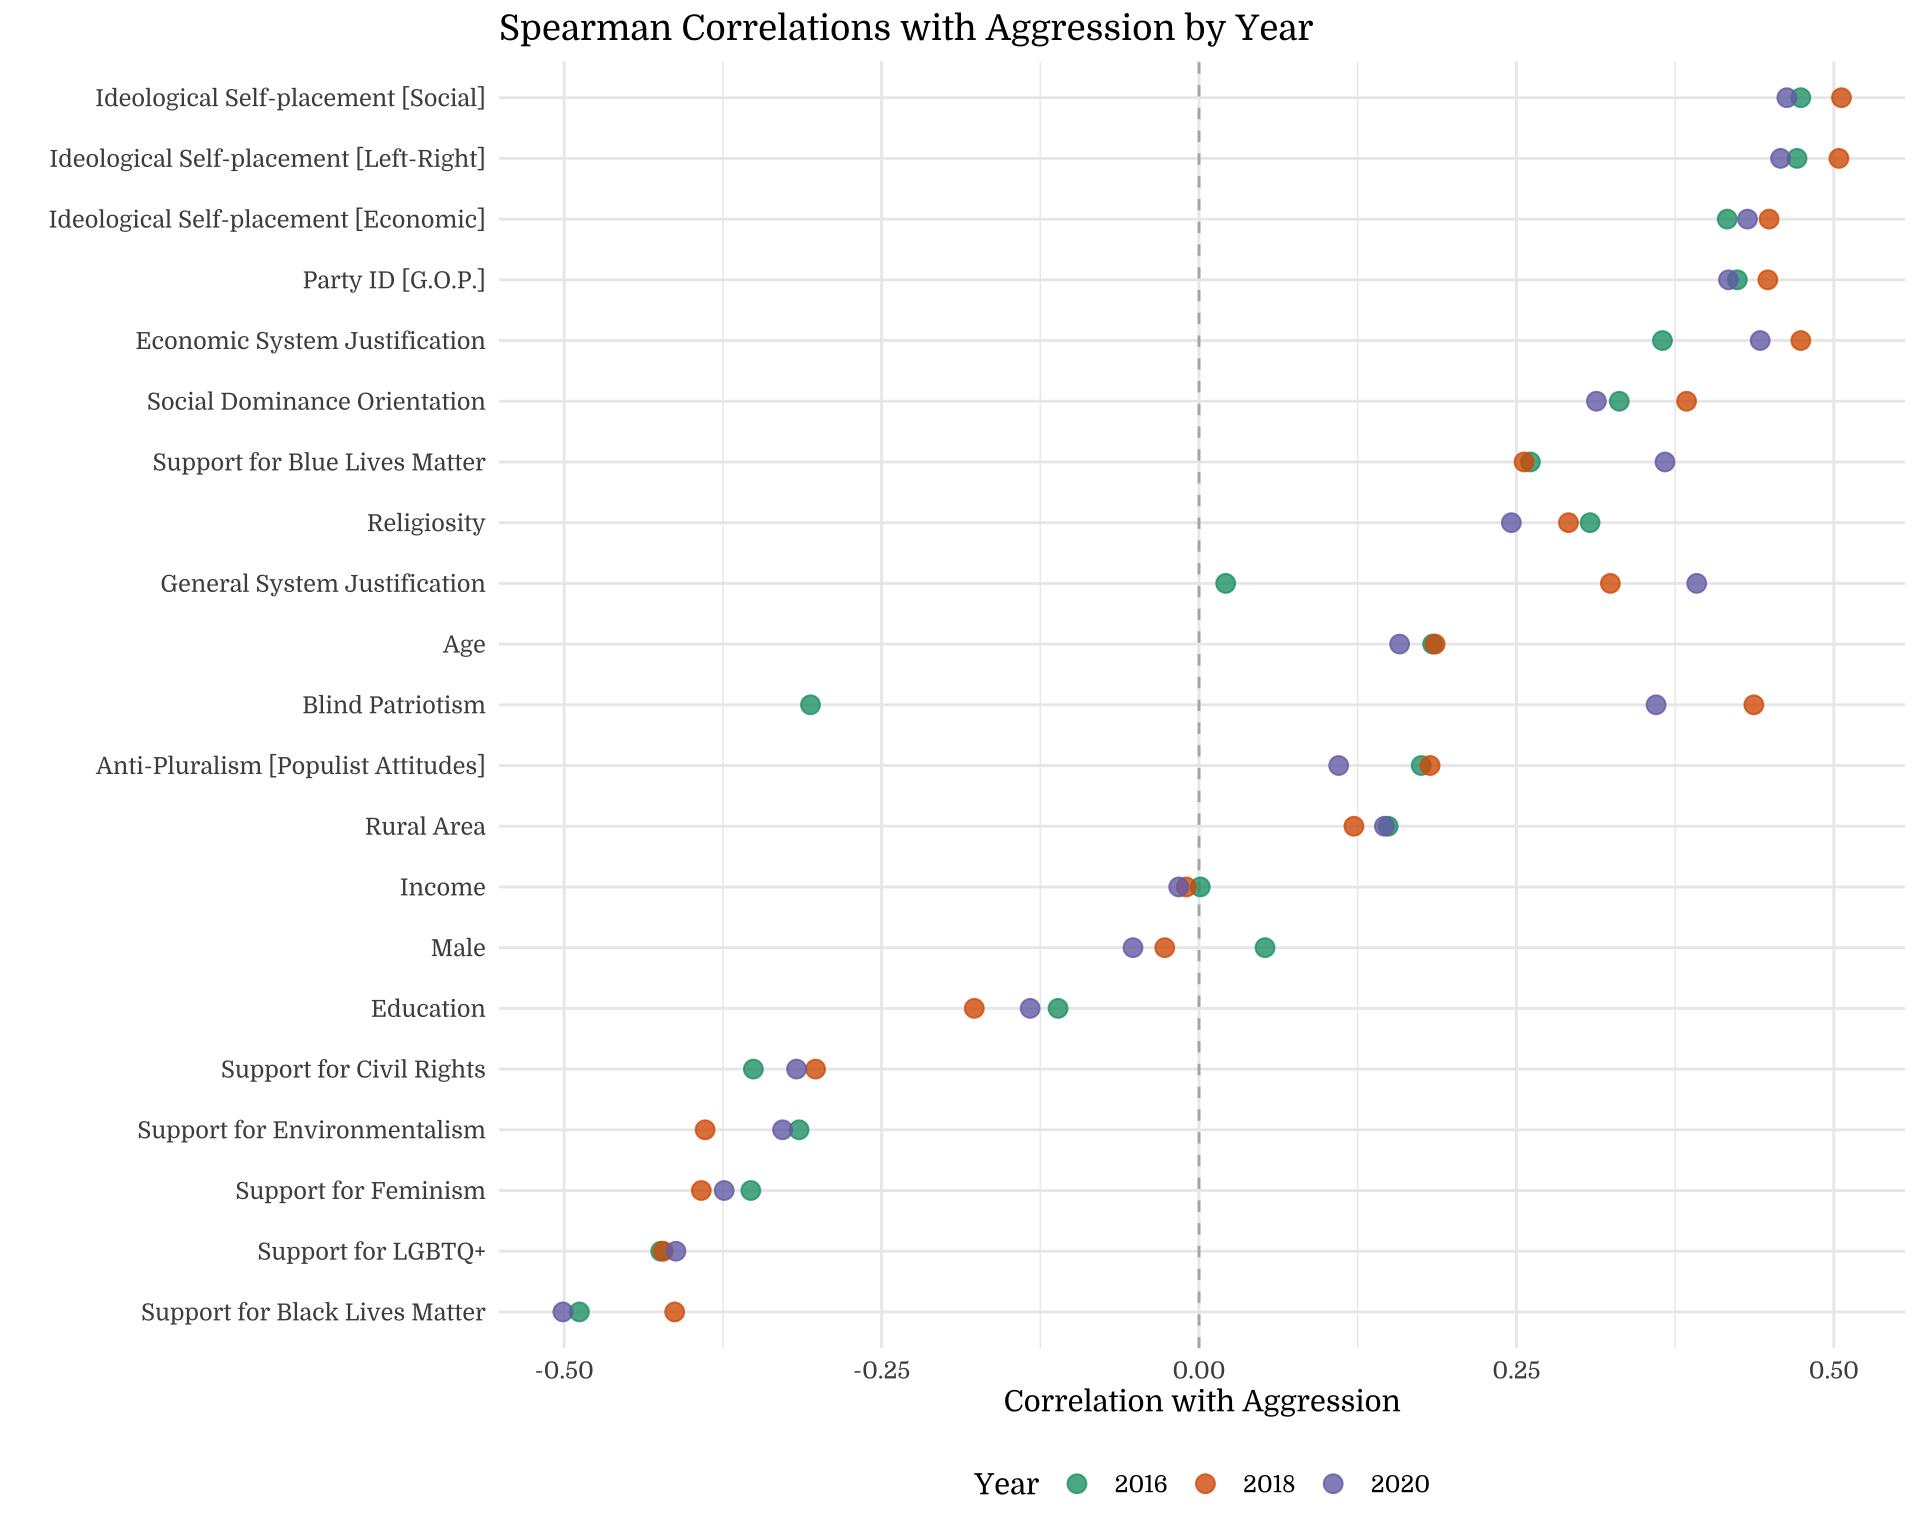
7.2.1 Aggression
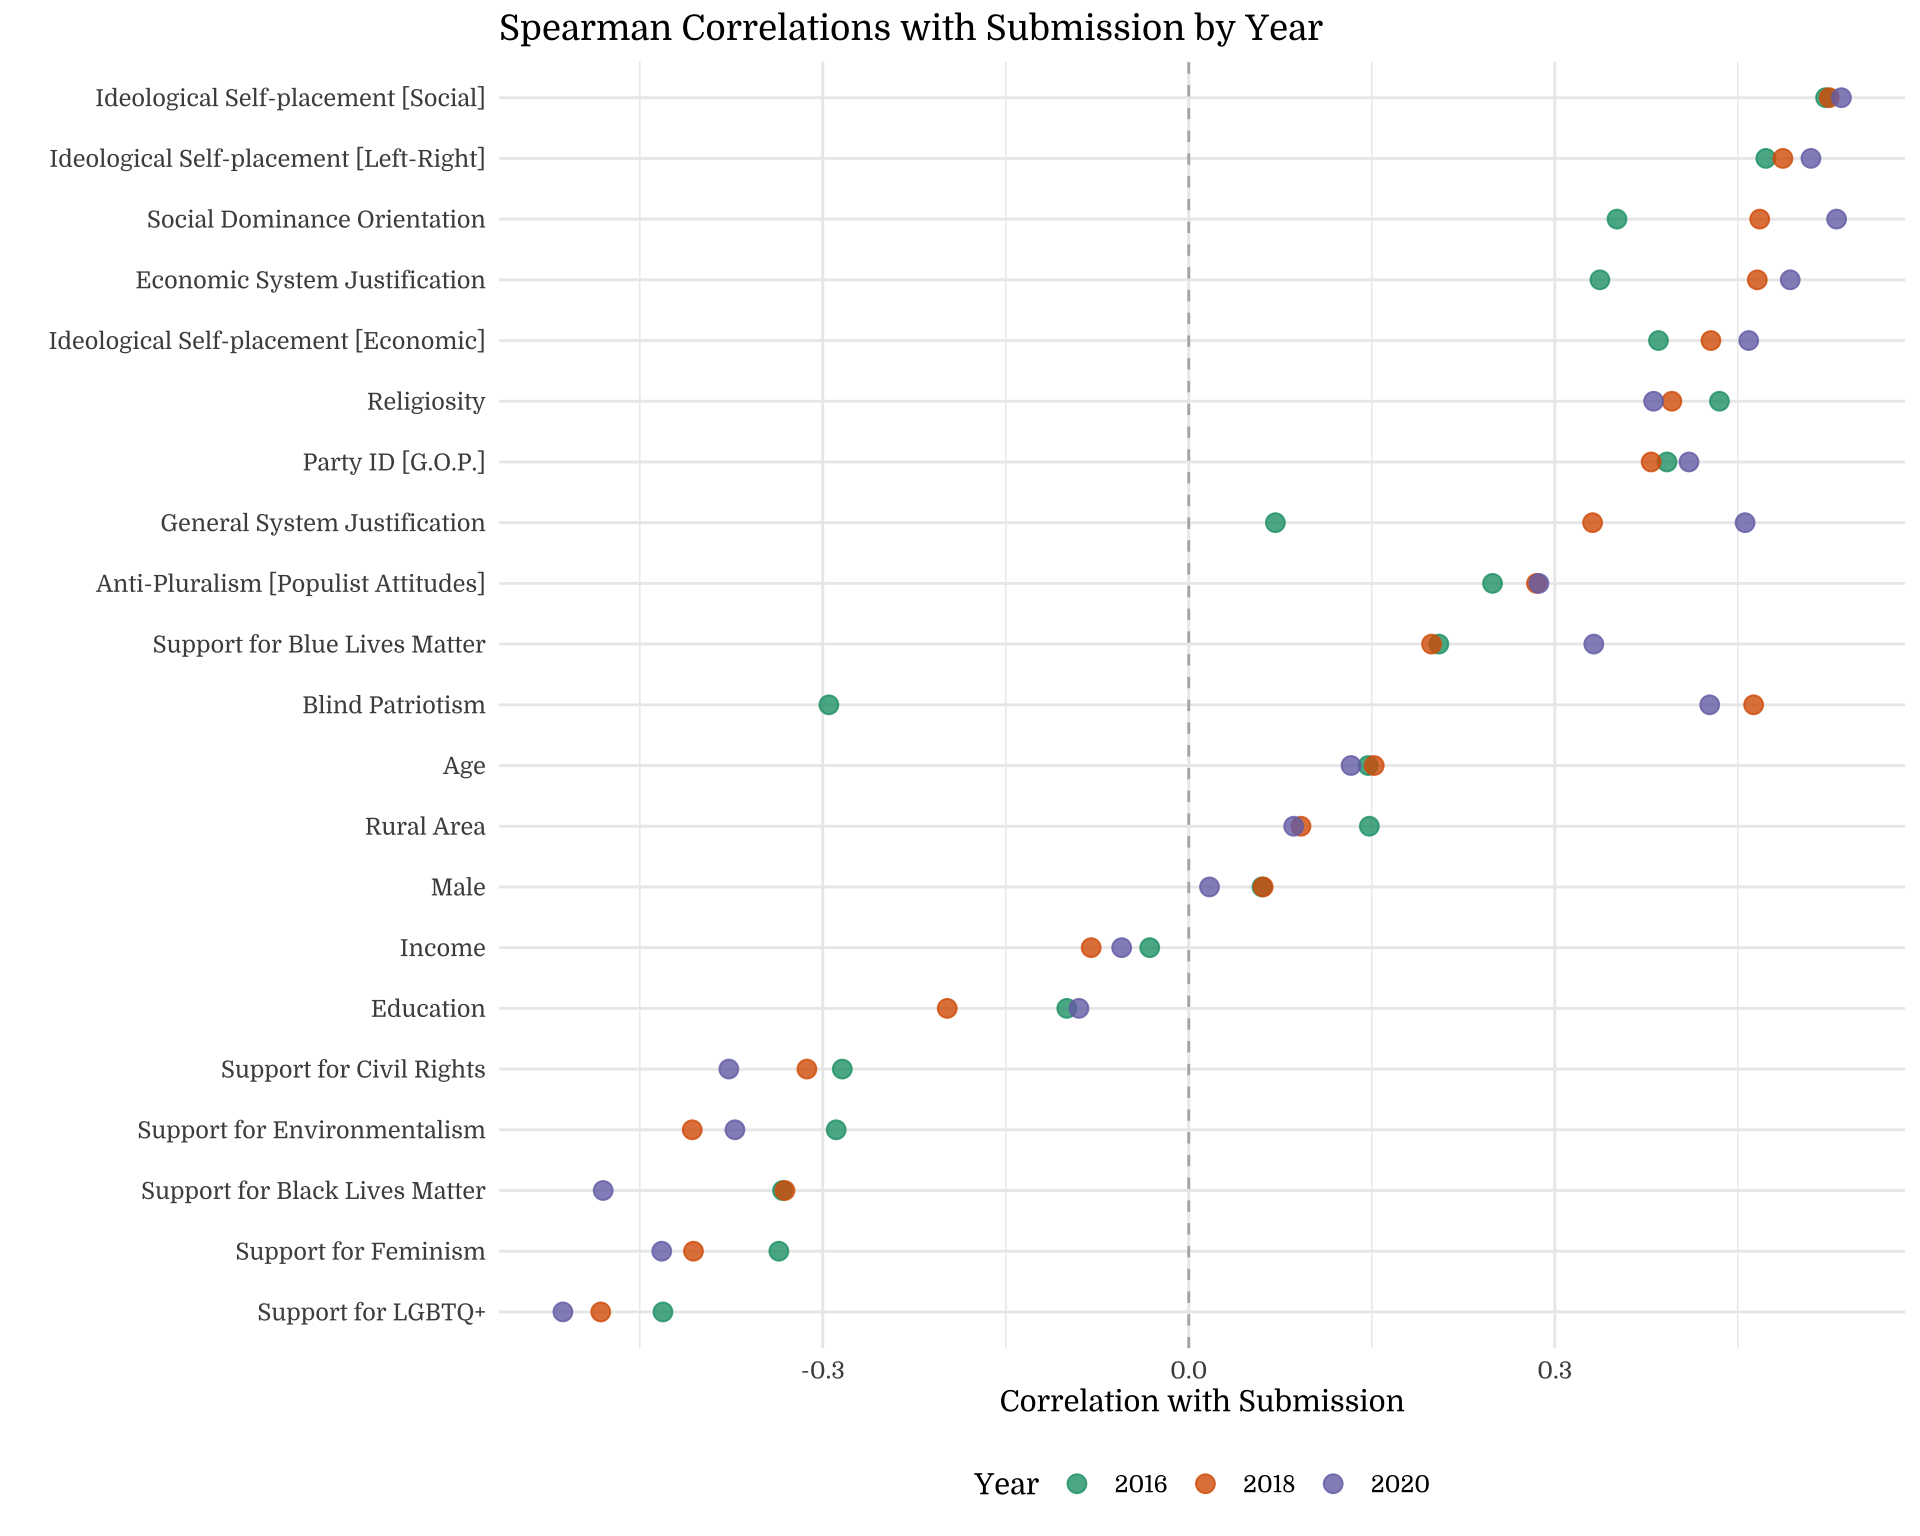
7.2.2 Submission
7.2.3 Conventionalism
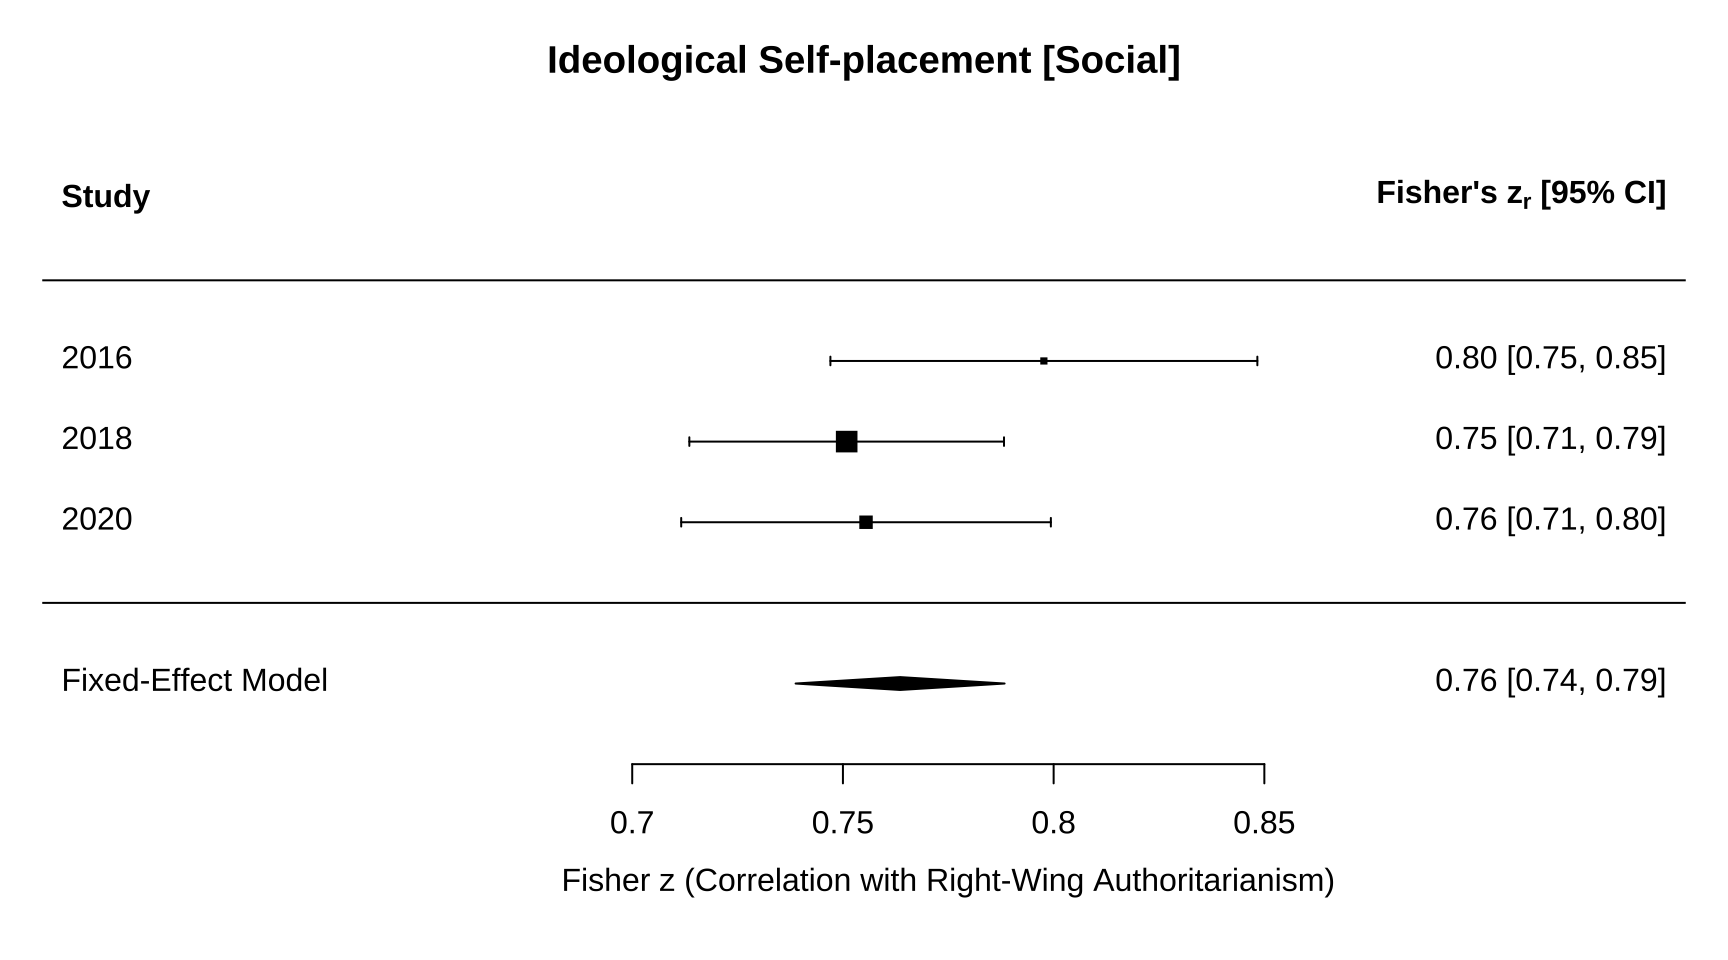
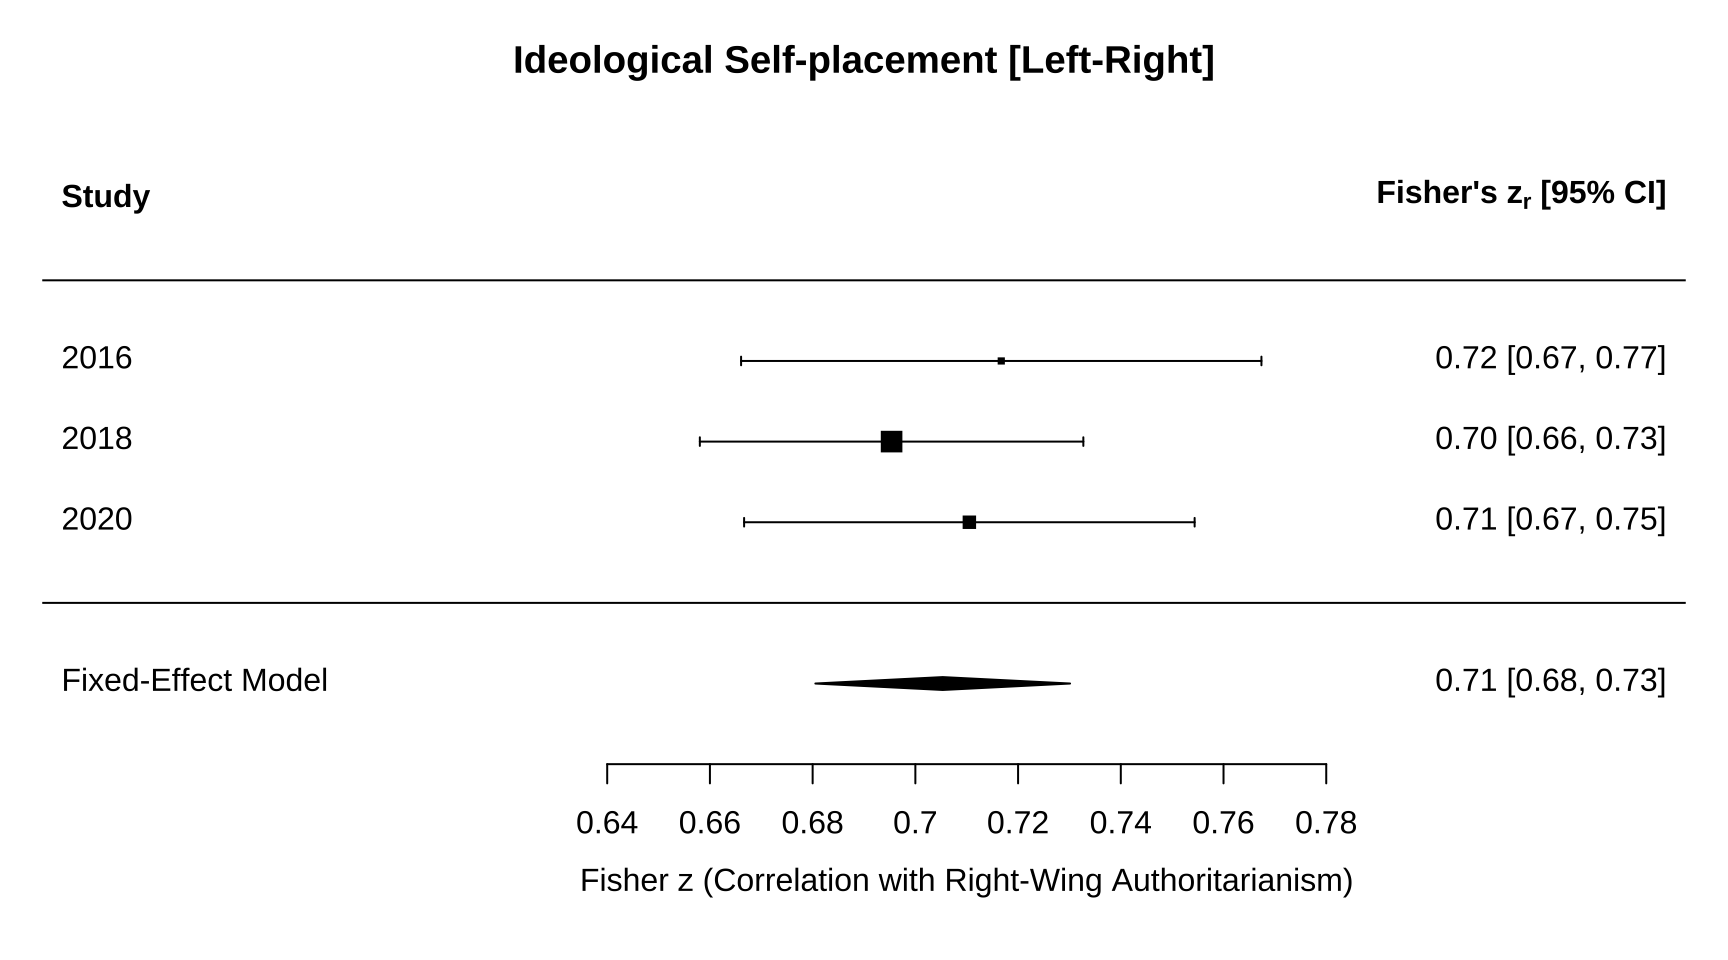
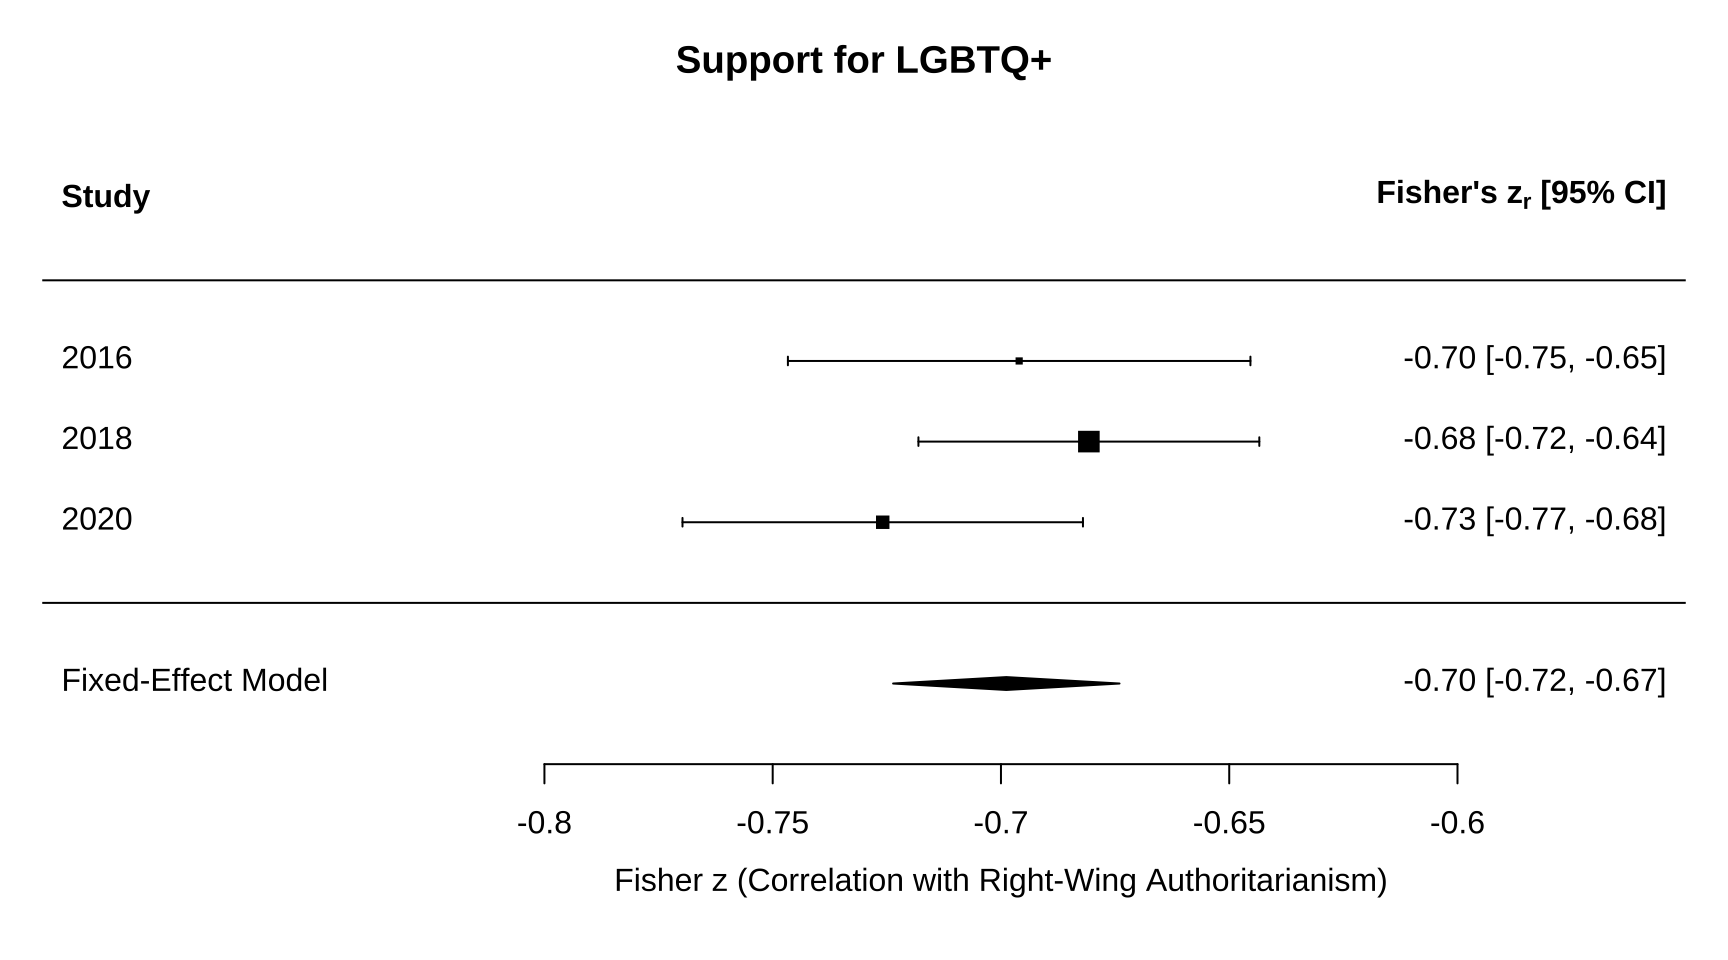
7.3 Forest Plots: Key Correlations
7.3.1 Ideological Self-placement [Social]
7.3.2 Ideological Self-placement [Left-Right]
7.3.3 Support for LGBTQ+
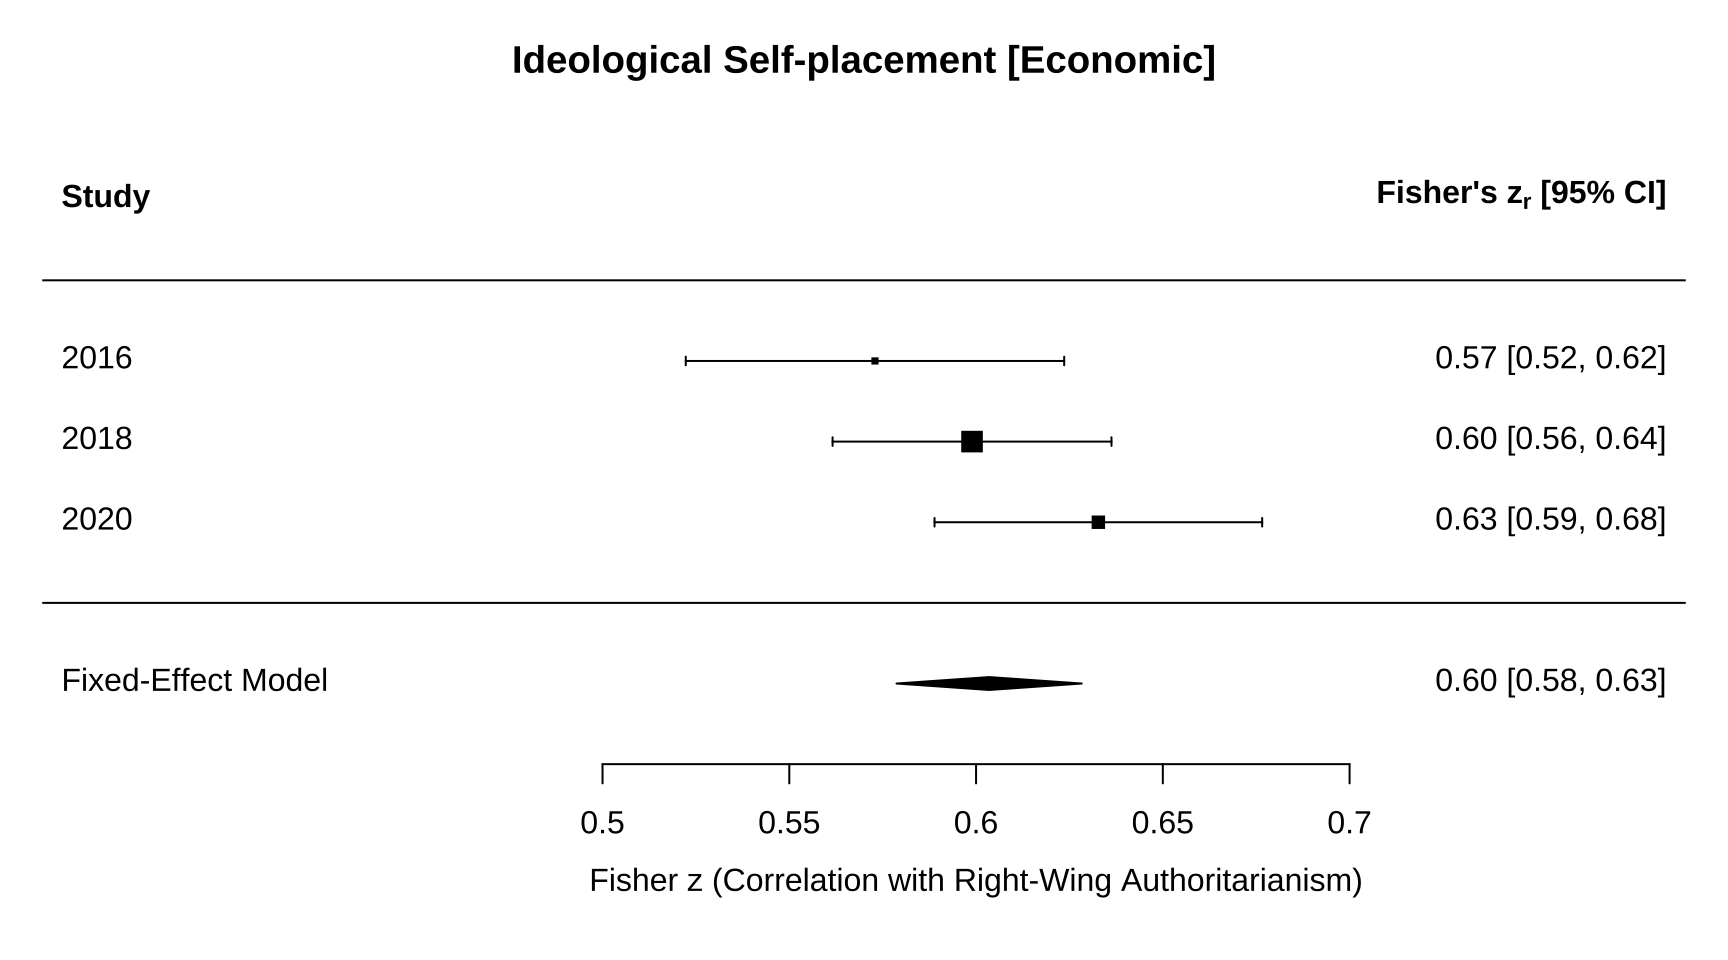
7.3.4 Ideological Self-placement [Economic]
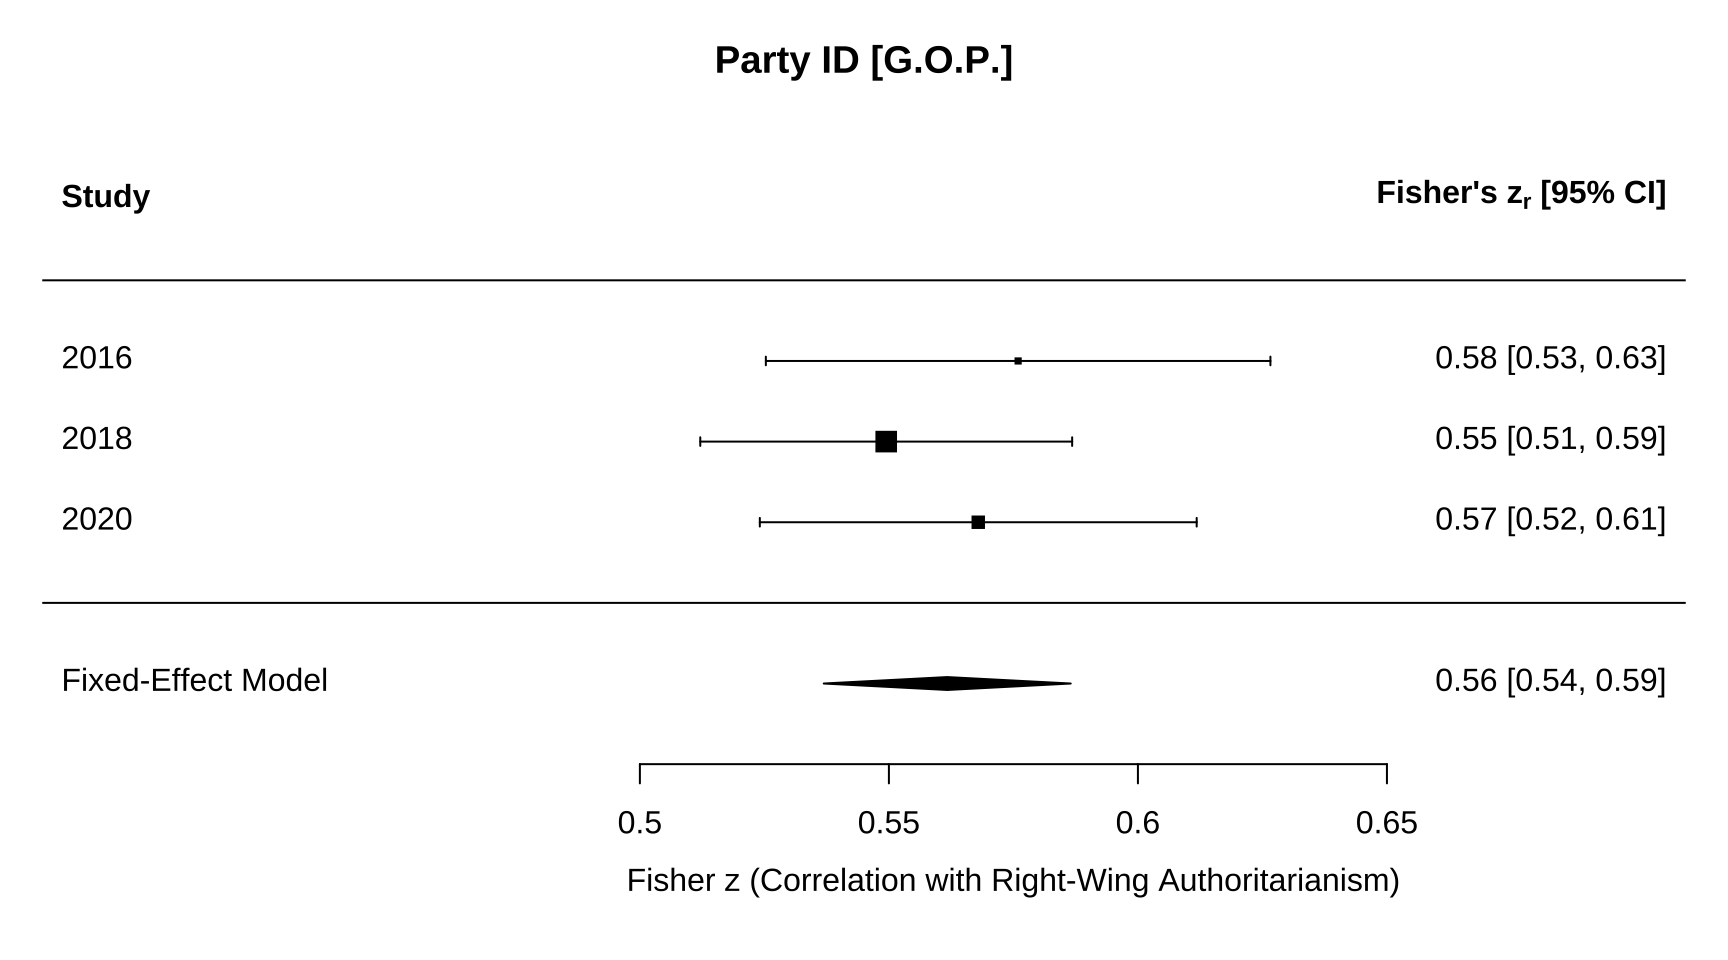
7.3.5 Party ID [G.O.P.]
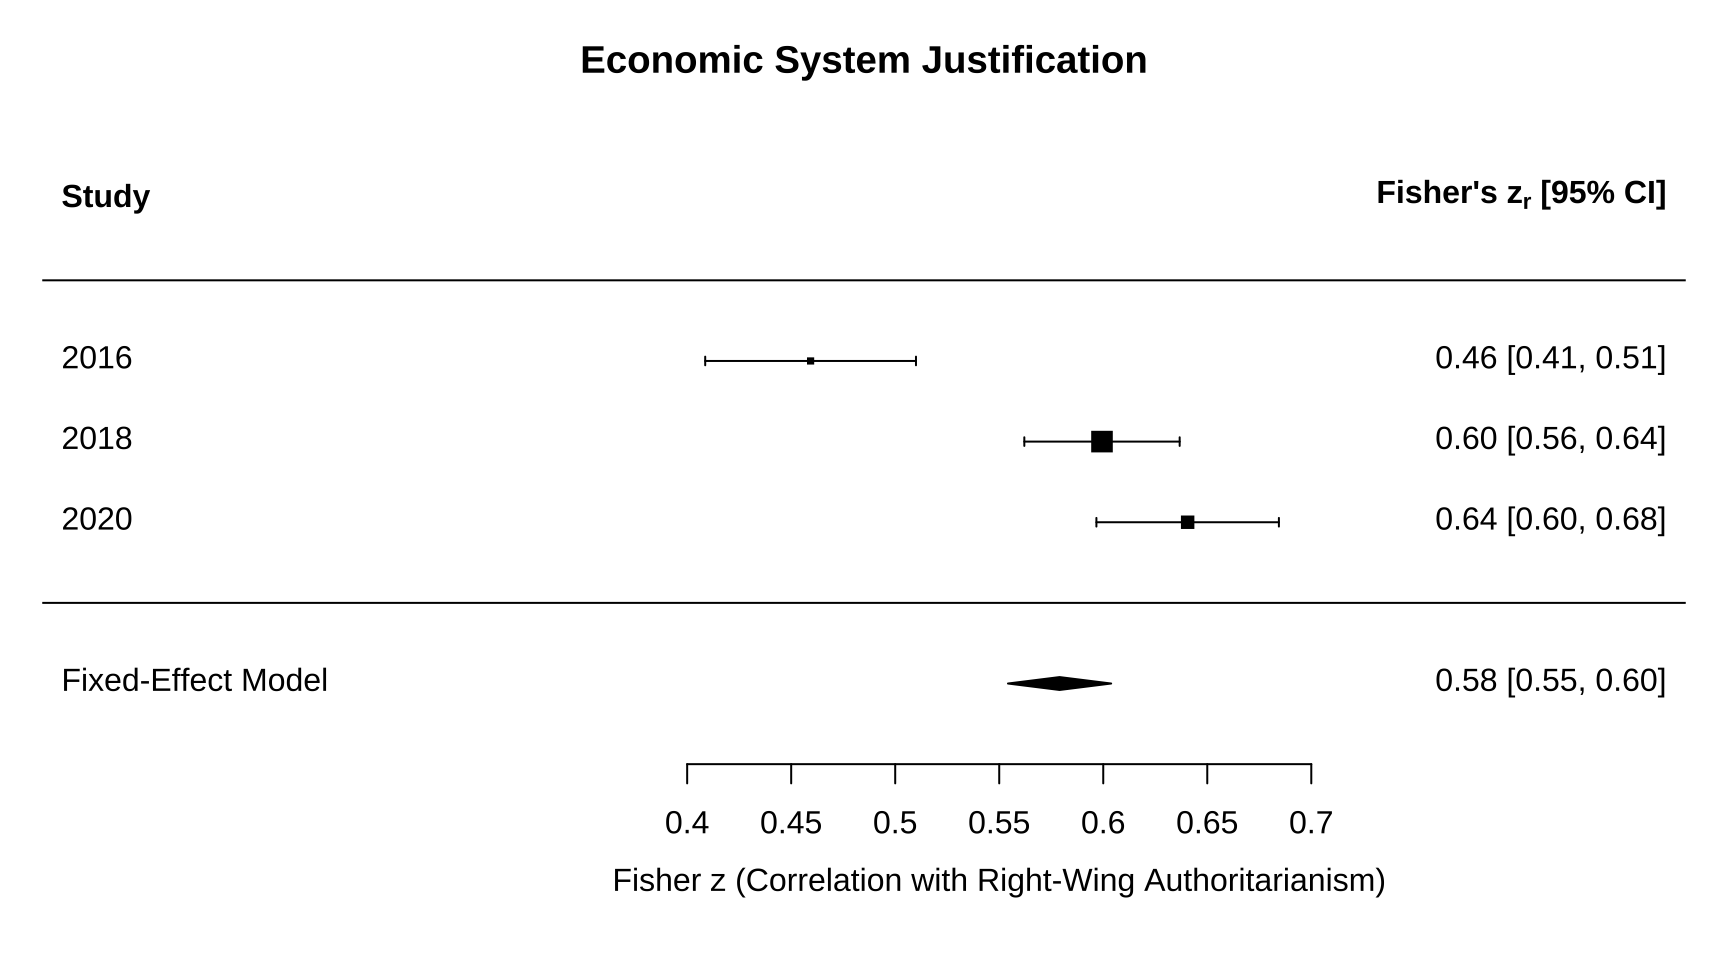
7.3.6 Economic System Justification
7.4 Correlation Table by Year
| label | 2016 | 2018 | 2020 |
|---|---|---|---|
| Age | 0.255 | 0.229 | 0.227 |
| Anti-Pluralism [Populist Attitudes] | 0.260 | 0.259 | 0.230 |
| Blind Patriotism | -0.343 | 0.512 | 0.474 |
| Economic System Justification | 0.430 | 0.537 | 0.565 |
| Education | -0.097 | -0.183 | -0.115 |
| General System Justification | 0.081 | 0.382 | 0.533 |
| Ideological Self-placement [Economic] | 0.518 | 0.536 | 0.560 |
| Ideological Self-placement [Left-Right] | 0.615 | 0.601 | 0.611 |
| Ideological Self-placement [Social] | 0.663 | 0.636 | 0.638 |
| Income | -0.007 | -0.050 | -0.052 |
| Male | 0.075 | 0.022 | -0.024 |
| Party ID [G.O.P.] | 0.520 | 0.500 | 0.514 |
| Religiosity | 0.536 | 0.481 | 0.456 |
| Rural Area | 0.176 | 0.136 | 0.152 |
| Social Dominance Orientation | 0.399 | 0.473 | 0.487 |
| Support for Black Lives Matter | -0.509 | -0.423 | -0.596 |
| Support for Blue Lives Matter | 0.257 | 0.247 | 0.416 |
| Support for Civil Rights | -0.394 | -0.350 | -0.413 |
| Support for Environmentalism | -0.409 | -0.475 | -0.441 |
| Support for Feminism | -0.451 | -0.482 | -0.503 |
| Support for LGBTQ+ | -0.602 | -0.592 | -0.621 |
5.3 Social Ideology