PPBS 2018 Post-Election
The following describes the survey methodology of the 2018 Post-Election iteration of The Psychology Political Behavior Studies (PPBS). This report is meant to detail the utilized survey methodology and relevant, general purpose characteristics of both exploratory and confirmatory samples, as well as any extra samples and its combined version. The text is in APA Style and is akin to an APA-like ‘Methods Section’.
PPBS datasets are designed to have an exploratory, quota-based Nationally Representative sample (on Age, Education, Income and Sex), and a Confirmatory (Replication) convenience sample, from the same data source to avoid false positives. Some PPBS studies also have recontacts or extra-samples to answer additional specific research questions (e.g., 2nd Sample in 2016). All data’s coodbooks can be found at the bottom of the page, with a searchable feature allowing to find metadata within and between columns.
Taken together, there were three independent samples collected in the months following the 2018 U.S. Presidential Election (from 1st December 2018 to March 14th, 2019) and amount to 6136 online interviews of American adults, lasting ~69 minutes (Median) for those successfully passing the variety of data quality checks (84%). The 2018 attrition rate was, on average, of 23%.
For more details, see PBBS’s Motivation.
| Sample 1 | Sample 2 | Overall | |
|---|---|---|---|
| Election cycle | Post-Election 2018 | Post-Election 2018 | Post-Election |
| Type | Nationally Representative | Confirmatory (Replication) | Convenience |
| Survey Period (Start) | December 1st, 2018 | December 1st, 2018 | December 1st, 2018 |
| Survey Period (End) | March 14th, 2019 | March 13th, 2019 | March 14th, 2019 |
| Country | United States | United States | United States |
| Attention Checks | Yes (10; various types) | Yes (10; various types) | Yes (10; various types) |
| Time Checks | Yes (12 page submit checks) | Yes (12 page submit checks) | Yes (12 page submit checks) |
| CAPTCHA | Yes (begining of survey) | Yes (begining of survey) | Yes (begining of survey) |
| Sample Size (N) | 2759 | 3377 | 6136 |
| Length of Interview (MD) | 60.48 | 78.55 | 69.52 |
| Attrition (%) | 0.24 | 0.23 | 0.24 |
| Data Quality checks (%) | 0.17 | 0.16 | 0.16 |
| Note. The Overall column displays the simple, non-weighted on sample size, average between the preceeding columns. If interested in the weighted averages, see section ‘Combined Samples’ below. |
Nationally Representative Sample (N=2759)
Sample Description
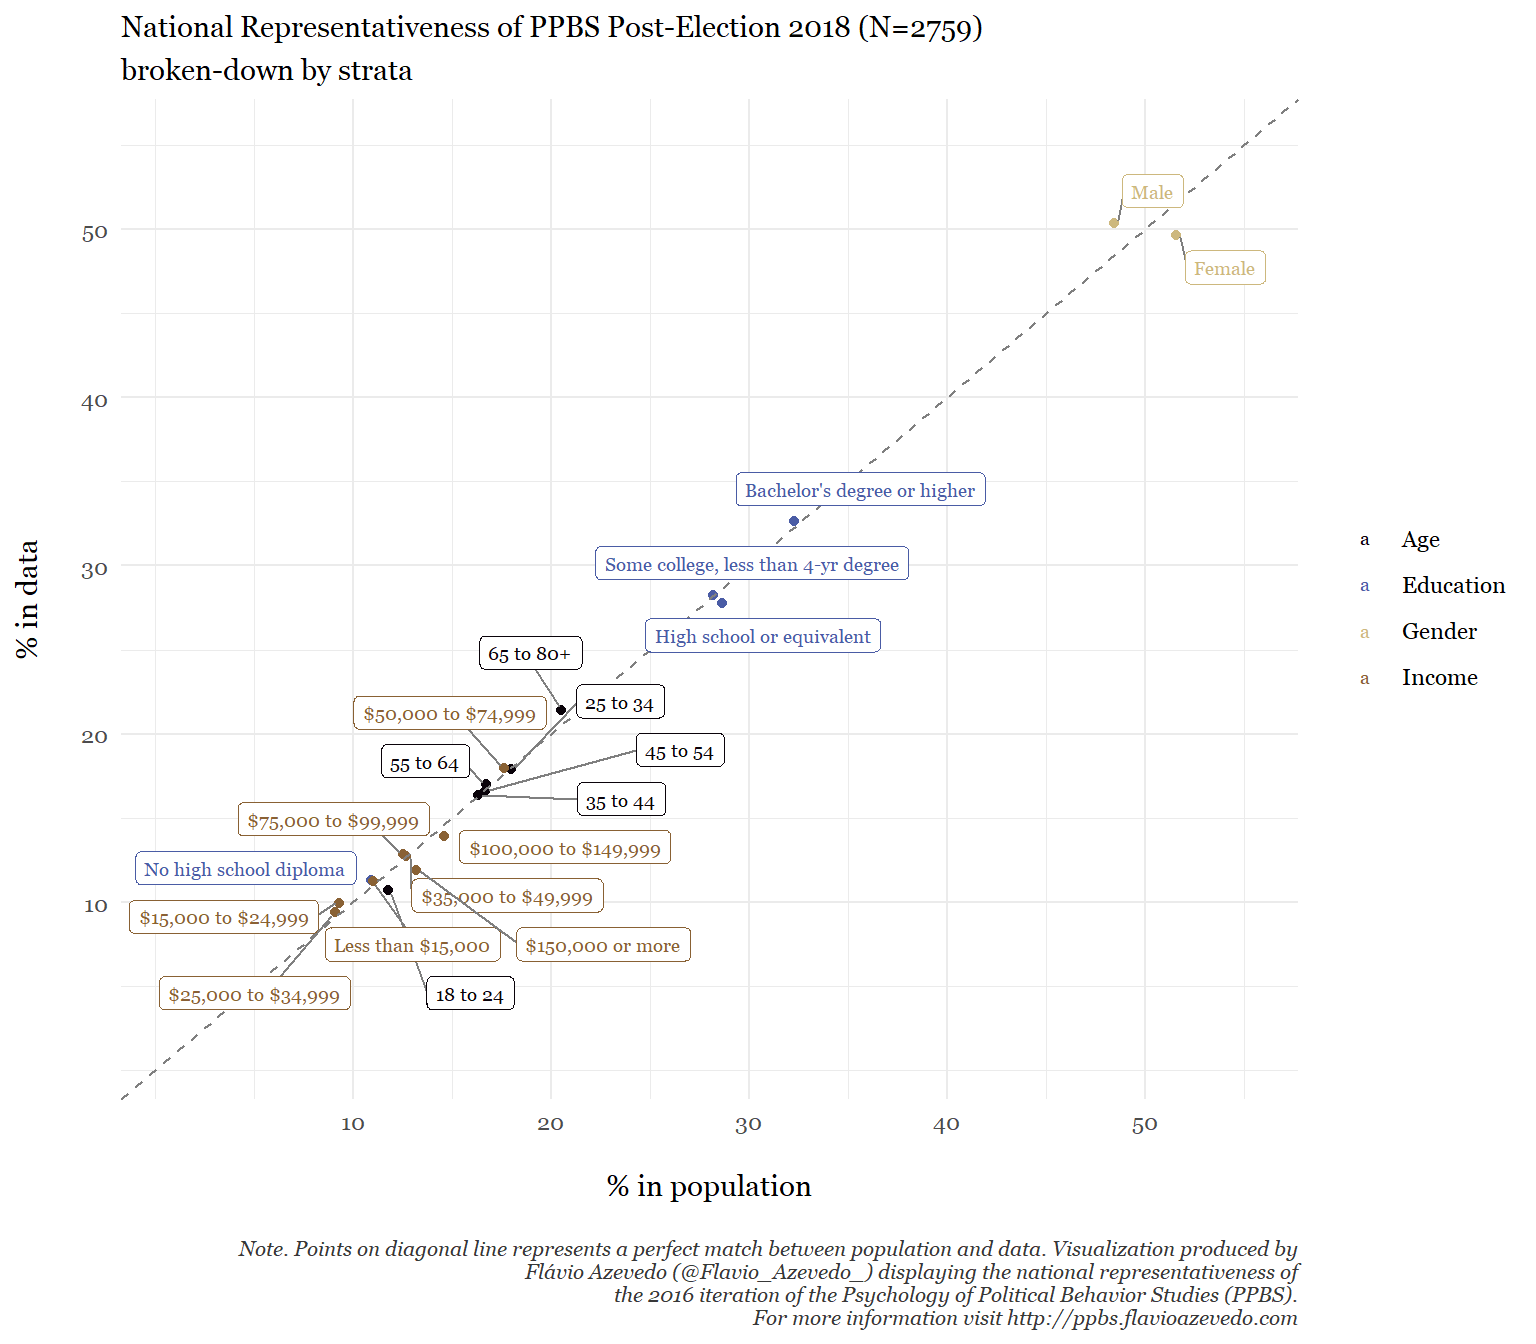
We hired Cint (www.cint.com), a survey research firm that recruits participants from a pool of over 13 million U.S. citizens, to recruit a nationally representative sample of 2759 Americans (49.66% women) in the months following the 2018 US Presidential Election (from December 01 to March 14, 2019)1. The quotas were designed to match that of the 2018 US Census’ Current Population Survey (CPS) on age, income, education and gender, with a maximum percentual difference of 5% at the bracket level. The representativeness of the collected sample is presented in the table below, which shows an average absolute deviation of 3.22% points (MD = 2.91) from the desired quotas, indicating the sample has achieved a high level of national representativeness.
In addition to administering a much greater number and variety of political and psychological instruments (including full scales) than in other nationally representative surveys (such as ANES, GSS, and WVS), we took a number of steps to insure that the quality of the data would be especially high. These included following professional recommendations to minimize problems of careless responding and satisficing behavior in online survey studies (Meade & Craig, 2012). Specifically, we employed 10 random attention questions, 12 page-time controls, and a Captcha question at the beginning of the survey. A total of 4644 participants were directed to the survey, and 3547 of them finished the survey (attrition rate 24%). There were 788 (17%) participants who failed more than two attention checks or finished the survey in under ~22 minutes and were therefore excluded. For the final sample of 2759, participants who successfully completed all study materials had a completion time of 99.82 minutes on average (MD: 60.48min).
The age distribution of our sample was as follows: 18–24 years (10.69%), 25–34 (17.91%), 35–44 (16.35%), 45–54 (16.6%), 55–65 (17.04%), and older than 65 (21.42%). The ethnic breakdown was: White (71.62%), Black/African American (18.16%), Latino (5.07%), Asian/Pacific Islander (3.15%), Native American (0.51%), Middle Eastern (0.22%), and Other (1.27%). In terms of religion, (20.77% identified as Catholic, 44.84% as Protestant, 2.61% as Jewish,0.8% as Muslim, 15.22% as either Atheist or Agnostic, and 15.77% responded they are not sure or refused to answer. With respect to education, 11.31% declared their highest educational achievement to be high-school graduation or lower, 27.8% indicated some college and 28.23% indicated having received a Bachelor or Graduate degree. The median income category was $50,000 to $74,999. The exact distribution of Income is as follows: Less $15,000 (11.24%), $15,000 to $24,999 (9.97%), $25,000 to $34,999 (9.42%), $35,000 to $49,999 (12.72%), $50,000 to $74,999 (17.94%), $75,000 to $99,999 (12.87%), $100,000 to $149,999 (13.92%) and $150,000 more (11.92%).
1 Note. Field on this project was particularly long because of the large sample size, combined with the fact we oversampled African Americans.
| Demographic | Brackets | Census CPS % | Expected Sample Frequencies | Observed Frequencies | Expected vs. Observed Frequencies | Expected vs. Observed % |
|---|---|---|---|---|---|---|
| Age | 18 to 24 | 11.78 | 325 | 295 | -30 | -9.23 |
| Age | 25 to 34 | 18.00 | 497 | 494 | -3 | -0.60 |
| Age | 35 to 44 | 16.32 | 450 | 451 | 1 | 0.22 |
| Age | 45 to 54 | 16.67 | 460 | 458 | -2 | -0.43 |
| Age | 55 to 64 | 16.73 | 462 | 470 | 8 | 1.73 |
| Age | 65 to 80+ | 20.50 | 566 | 591 | 25 | 4.42 |
| Education | No high school diploma | 10.90 | 301 | 312 | 11 | 3.65 |
| Education | High school or equivalent | 28.64 | 790 | 767 | -23 | -2.91 |
| Education | Some college, less than 4-yr degree | 28.20 | 778 | 779 | 1 | 0.13 |
| Education | Bachelor’s degree or higher | 32.25 | 890 | 901 | 11 | 1.24 |
| Gender | Female | 51.56 | 1423 | 1370 | -53 | -3.72 |
| Gender | Male | 48.44 | 1336 | 1389 | 53 | 3.97 |
| Income | Less than $15,000 | 11.01 | 304 | 310 | 6 | 1.97 |
| Income | $15,000 to $24,999 | 9.31 | 257 | 275 | 18 | 7.00 |
| Income | $25,000 to $34,999 | 9.10 | 251 | 260 | 9 | 3.59 |
| Income | $35,000 to $49,999 | 12.66 | 349 | 351 | 2 | 0.57 |
| Income | $50,000 to $74,999 | 17.60 | 486 | 495 | 9 | 1.85 |
| Income | $75,000 to $99,999 | 12.52 | 345 | 355 | 10 | 2.90 |
| Income | $100,000 to $149,999 | 14.60 | 403 | 384 | -19 | -4.71 |
| Income | $150,000 or more | 13.20 | 364 | 329 | -35 | -9.62 |
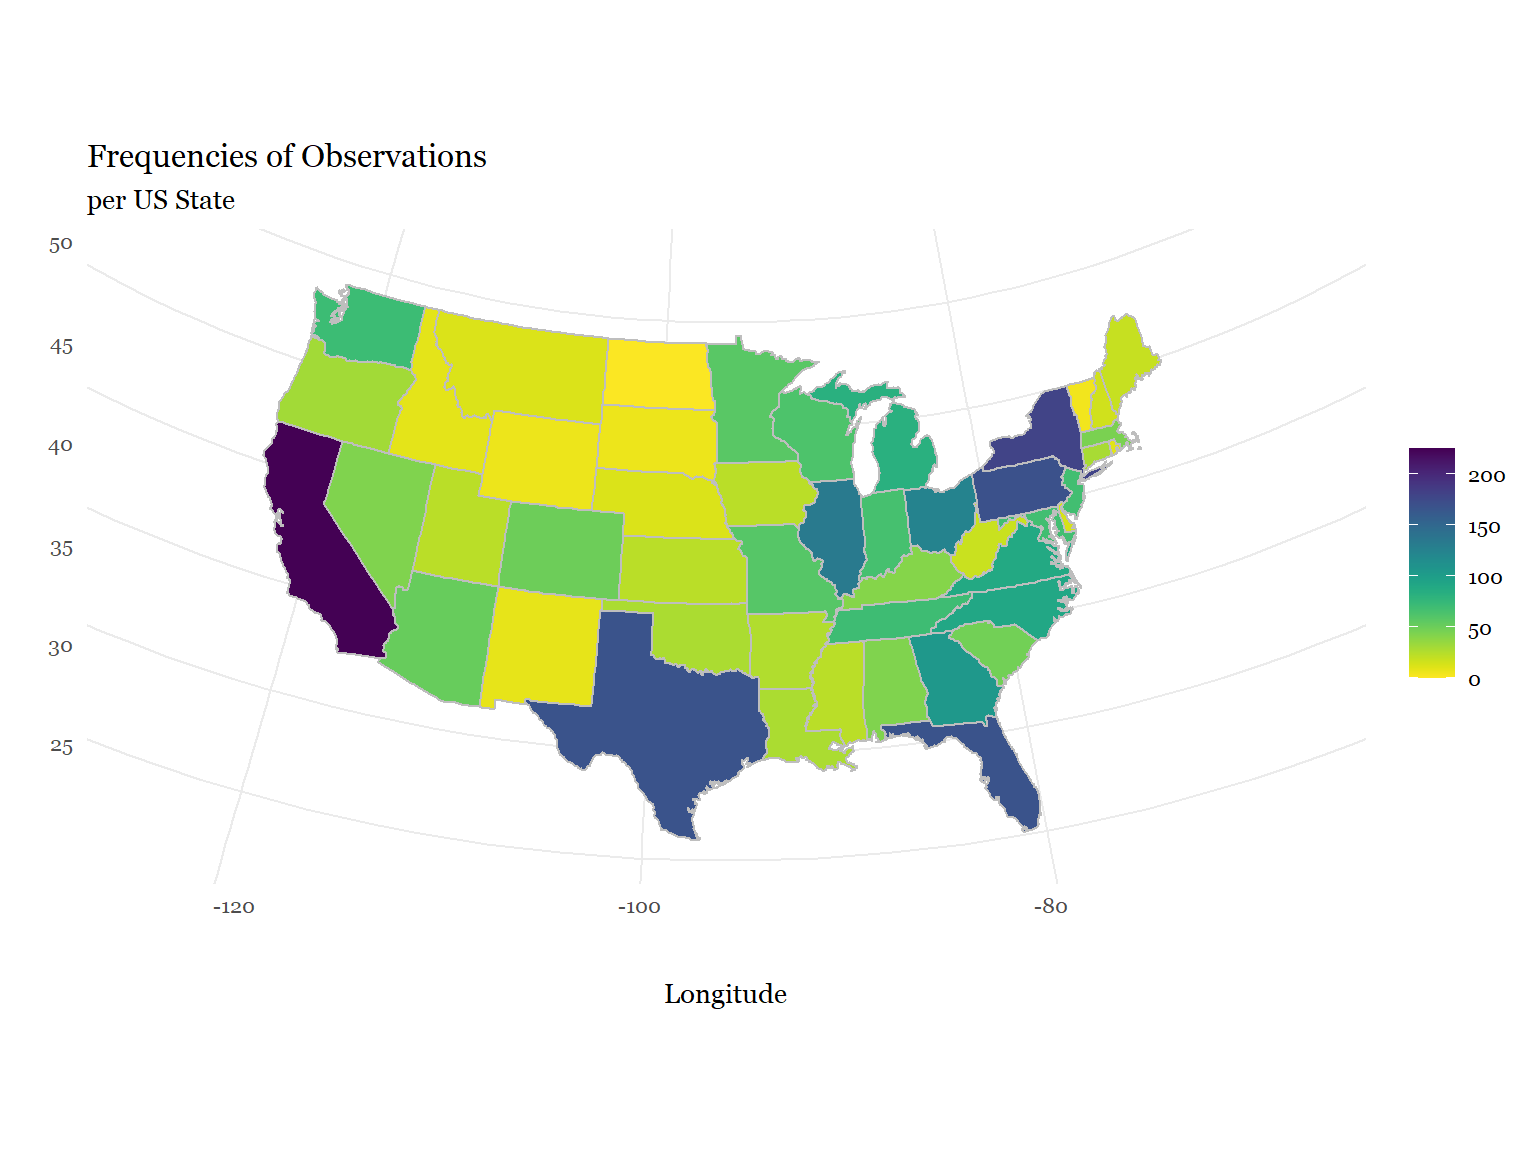
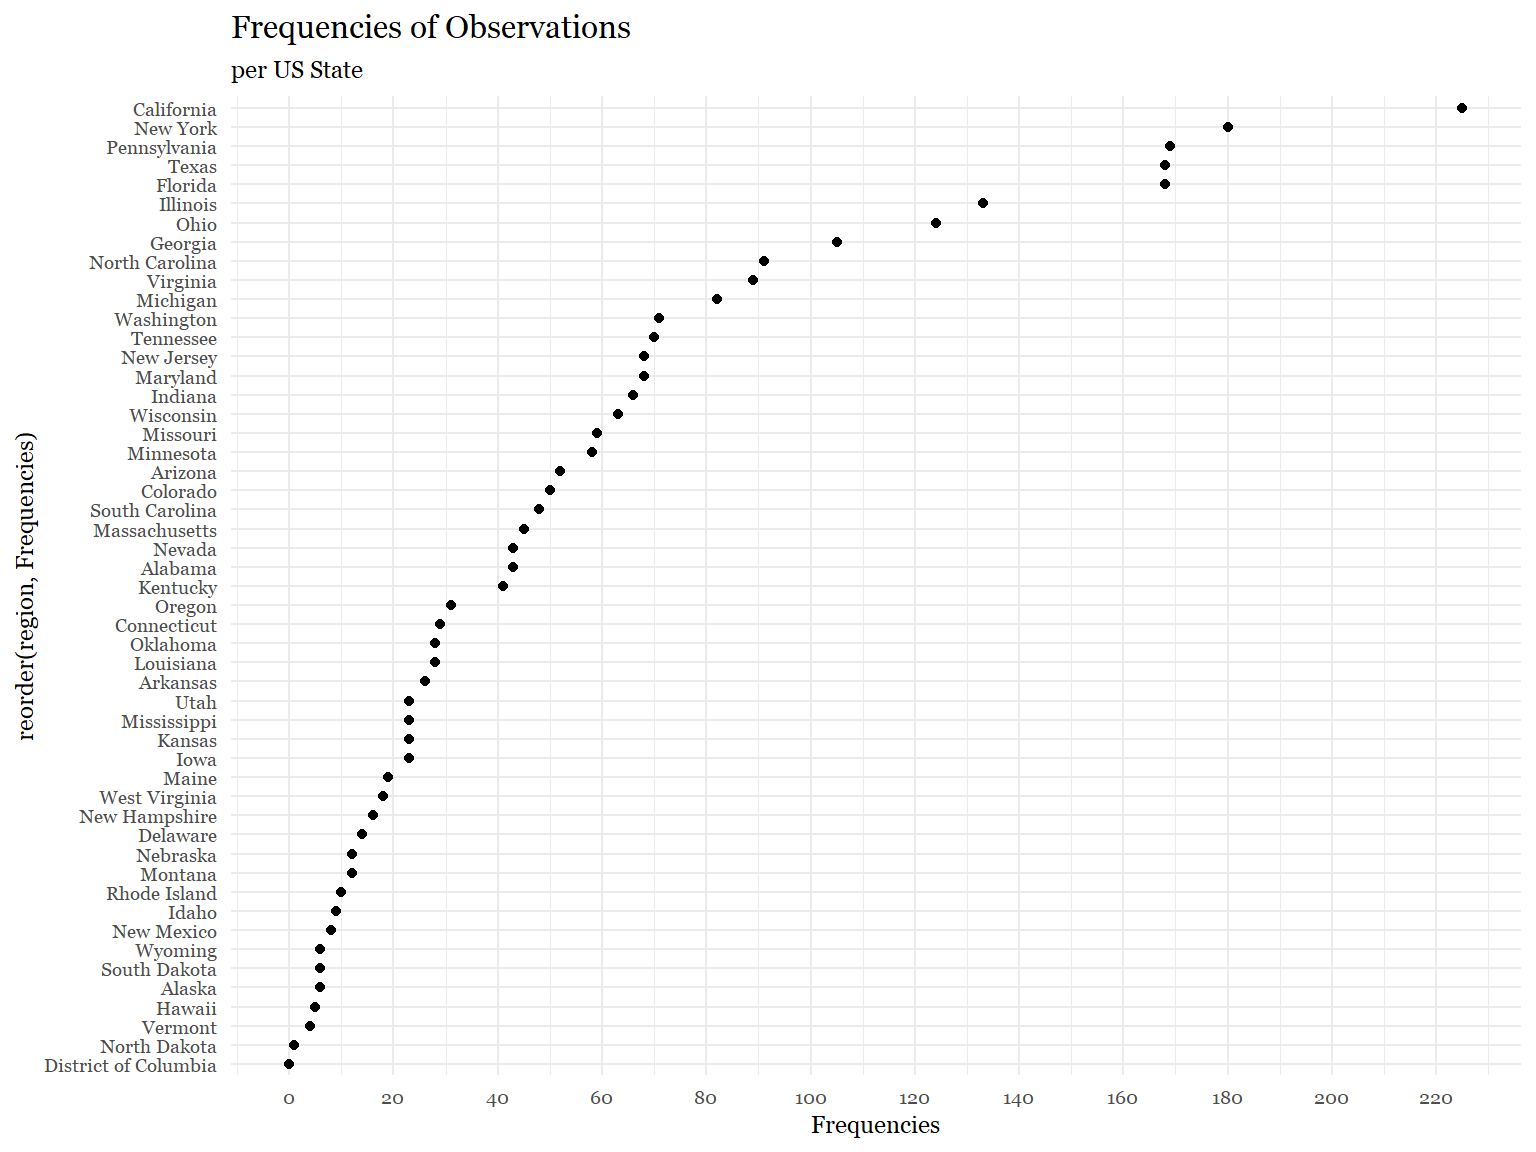
Regional Representation
As shown below, the distribution of data points per state tracks well with state population. The date has not been designed to be regionally representative, nor it claims to be, but results are not bad (cf. US Decennial Census Tables).
Convenience Replication Sample (N=3377)
Sample Description
Also through Cint, we also administered the same survey to a large convenience sample of 3377 American adults in the months preceding the 2020 US Presidential Election (from December 01 to March 13, 2019). We applied the same quality-control criteria as explained in the Nationally Representative sample. Specifically, we followed recommendations to minimize the problem of careless responding in online studies (Meade & Craig, 2012). A total of 5536 participants were directed to the survey, and 4288 of them finished the survey (attrition rate 23%). There were 911 (16%) participants who failed more than two attention checks or finished the survey in under ~22 minutes and were therefore excluded. For the final sample of 3377, participants who successfully completed all study materials had a completion time of 139.76 minutes on average (MD: 78.55min).
The age distribution of our sample was as follows: 18–24 years (1.33%), 25–34 (11.07%), 35–44 (19.78%), 45–54 (21.5%), 55–65 (18.54%), and older than 65 (27.78%). The ethnic breakdown was: White (71.13%), Black/African American (20.4%), Latino (3.49%), Asian/Pacific Islander (3.08%), Native American (0.47%), Middle Eastern (0.12%), and Other (1.3%). In terms of religion, (19.51% identified as Catholic, 50.76% as Protestant, 2.93% as Jewish,0.68% as Muslim, 12.17% as either Atheist or Agnostic, and 13.95% responded they are not sure or refused to answer. With respect to education, 3.73% declared their highest educational achievement to be high-school graduation or lower, 18.03% indicated some college and 38.08% indicated having received a Bachelor or Graduate degree. The median income category was $35,000 to $49,999. The exact distribution of Income is as follows: Less $15,000 (13.95%), $15,000 to $24,999 (11.87%), $25,000 to $34,999 (12.05%), $35,000 to $49,999 (17%), $50,000 to $74,999 (20.28%), $75,000 to $99,999 (9.86%), $100,000 to $149,999 (6.54%) and $150,000 more (6.54%). The sample has a larger proportion of women (N= 2149, 63.64%) than men (N= 1228, 36.36%).
Combined Samples (N=6136)
Sample Description
We combined and analyzed data from two large surveys conducted before the 2020 U.S. general election (from December 01 to March 14, 2019), including a nationally representative sample (N = 6136) and a large convenience sample (N = 3377. We hired Cint (www.cint.com), a survey research firm that recruits participants from a pool of over 13 million U.S. citizens. We took a number of steps to insure that the quality of the data would be especially high. These included following professional recommendations to minimize problems of careless responding and satisficing behavior in online survey studies (Meade & Craig, 2012). Specifically, we employed 8 random attention questions, 8 page-time controls, and a Captcha question at the beginning of the survey. A total of 10180 participants were directed to the survey, and 7835 of them finished the survey (attrition rate 23%). There were 1699 (17%) participants who failed more than two attention checks or finished the survey in under ~22 minutes and were therefore excluded. For the final sample of 6136, participants who successfully completed all study materials had a completion time of 121.8 minutes on average (MD: 68.9min).
The age distribution of our sample was as follows: 18–24 years (5.54%), 25–34 (14.15%), 35–44 (18.24%), 45–54 (19.3%), 55–65 (17.86%), and older than 65 (24.92%). The ethnic breakdown was: White (71.35%), Black/African American (19.39%), Latino (4.2%), Asian/Pacific Islander (3.11%), Native American (0.49%), Middle Eastern (0.16%), and Other (1.29%). In terms of religion, (20.08% identified as Catholic, 48.09% as Protestant, 2.79% as Jewish,0.73% as Muslim, 13.54% as either Atheist or Agnostic, and 14.77% responded they are not sure or refused to answer. With respect to education, 7.14% declared their highest educational achievement to be high-school graduation or lower, 22.43% indicated some college and 33.65% indicated having received a Bachelor or Graduate degree. The median income category was $50,000 to $74,999. The exact distribution of Income is as follows: Less $15,000 (12.73%), $15,000 to $24,999 (11.02%), $25,000 to $34,999 (10.87%), $35,000 to $49,999 (15.07%), $50,000 to $74,999 (19.23%), $75,000 to $99,999 (11.21%), $100,000 to $149,999 (9.86%) and $150,000 more (9.86%).
Note on Survey Company
Cint has the world’s largest network of integrated panels (4,500+). It was the original creator of a technological system allowing for an exchange of research panels, counting with a pool of participants in the USA of 13,260,833, and worldwide of 100,000,000+ in over 150 countries. Cint provides an updated, real-time age and gender breakouts by country of its participants’ pool, and is a partner and provider of samples for known giants in the research panels industry like GfK, Lucid, Ipsos, Qualtrics, Kantar, Nielsen, and GMO. Methodologically, Cint applies a variety of industry-standard 3rd party solutions – including Imperium, MaxMind, Firehol, Apility, Google reCAPTCHA and SmartyStreets – and its ISO-20252 compliant proprietary Fraud Detection tool – to ensure data quality. Cint also complies with the codes and guidelines of ESOMAR, CASRO, MRA and applicable national market research associations, as well as all applicable data protection laws/regulations - including EU’s strict GDPR. Most importantly, and contrary to several traditional companies such as YouGov, Cint not only doesn’t require hosting the questionnaire (leaving researchers in control of data quality checking) but welcomes and recommends the deployment of stringent data validation checks, including but not limited to: analysis of questionnaire completion time, data outliers, unanswered questions, patterned responses, straight-lining traps, and red herring questions.